- scRNA-seq 发现表达 WIF1/VCAN/NRG1 的基底亚型,显著富集于移行区与 BPH。
- 通路提示 EMT、基质重塑、免疫调节与 NRG–ERBB 旁分泌;CISH 在组织水平验证。
- 该群可能参与 BPH 的上皮—间质重塑,为分区疾病易感性提供细胞学线索。
引言
人前列腺是受雄激素调控的器官,解剖上分为外周区(PZ)、中央区(CZ)、移行区(TZ)及不含上皮的前部纤维肌性间质。三个富含上皮的区域在组织学、细胞构成及疾病易感性方面均有独特之处。良性前列腺增生(BPH)几乎仅发生于移行区,而前列腺癌主要起于外周区[1]。这种区域选择性提示,有必要理解前列腺生物学与病理学中的空间异质性。
单细胞 RNA 测序(scRNA-seq)使前列腺复杂结构的研究达到前所未有的分辨率[2–5],揭示上皮和间质谱系内部的异质性、区域特异状态、谱系轨迹及信号通路。Henry 等发现 club、hillock 两类新上皮细胞,在 TZ 比 PZ 更丰富[2];Yan 等发现年龄相关改变,PZ 富集 MYC、E2F 活性增强的 TFF3⁺ 腔面亚型,而 TZ 具有更强免疫和干性转录特征[3]。Joseph 等及 Yan 等均报道近端与远端成纤维细胞密度差异[3,4]。相比之下,基底细胞异质性研究较少,可能与样本量小有关[5]。一项研究将 KRT5⁺ 基底细胞分为 KRT16⁺KRT17⁺ 和 KRT16⁻KRT17⁻ 两条谱系,再分为七种转录亚型[6];另一项报道经典 KRT15⁺/c1、DST⁺/c6,罕见 RARRES2⁺/c17,以及富含基底和 hillock 特征的 S100A2⁺/c2、PLCG2⁺/c3 亚型[7]。多数既往研究只研究正常前列腺,难以联系 BPH 等疾病。
BPH 为上皮与间质的非恶性增殖,导致腺体增大,可引起尿道梗阻及明显降低生活质量的下尿路症状。其机制尚未完全明确,雄激素信号失调[8]、慢性炎症[9]和间质—上皮相互作用[10]被认为是关键;细胞衰老、细胞外基质重塑及激素失衡也与进展有关[11,12]。
本研究分析 10 位患者三个分区的癌旁非癌组织,发现独特的 WIF1⁺ 基底细胞,在 TZ 及 BPH 中显著富集。这一具有区域限制的群体可能参与 BPH 发病,为前列腺癌偏好外周区、BPH 几乎仅起于移行区的临床现象提供潜在细胞学基础。
材料与方法
伦理批准
研究经约翰斯·霍普金斯大学医学院 IRB 批准(NA_00048544、NA_00087094),所有参与者提供书面知情同意,研究遵循《赫尔辛基宣言》。
前列腺切除标本打孔取材
标本来自在约翰斯·霍普金斯医院因原发前列腺癌接受根治性前列腺切除的男性。新鲜标本自尖部向基底部切开,用 8 mm 打孔工具分别取三个分区组织,经 H&E 确认取材区不含癌,新鲜组织用于 scRNA-seq[13]。
人前列腺组织解离
组织用刀片切碎,在 0.25% Trypsin–EDTA(Gibco,Thermo Fisher Scientific;25200-072)中于 37°C 消化 10 分钟;随后在含 10% FBS、1 mg/ml I 型胶原酶(Gibco 17100-017)和 0.1 mg/ml DNase I(Roche 10104159001)的 DMEM 中,37°C 轻摇孵育 2.5 小时。400×g 离心 5 分钟,以 HBSS 洗涤,再在 0.25% Trypsin–EDTA 中于 37°C 孵育 10 分钟。细胞悬于含 10% FBS 和 0.4 mg/ml DNase I 的 DMEM,经 40 μm 滤网过滤。
单细胞测序及预处理
各取材样本按说明书用 10x Genomics Chromium Single Cell 3′ Library and Gel bead Kit V2(CG00052_RevF)建库,在 Illumina HiSeqX 上进行 150 bp 双端测序。用 Cell Ranger 拆分为 FASTQ,以 3.2.0 版 count 流程比对 GRCh38 转录组并生成基因×细胞计数矩阵。矩阵导入 R 的 Seurat 4.0.4(作者最后访问文档日期 2026 年 8 月 28 日);基因数 <500 或线粒体基因比例 >20% 的低质量细胞排除。
数据整合与细胞类型识别
依 Seurat 流程采用基于锚点的整合方法合并样本[14]。运行 PCA、FindNeighbors、FindClusters 后,以 RunUMAP 进行非线性降维,得到二维表示。结合已知细胞类型特异性基因的差异表达识别各群;同时表达多类上皮、间质、免疫标志的小群体视为双细胞并从后续分析剔除。
差异表达
使用 Seurat 的 FindMarker 函数比较细胞群或样本,Wilcoxon 秩和检验评估显著性,Benjamini–Hochberg 法校正多重比较。log₂ 倍数变化 >0.5 且校正 p<0.05 定义为显著差异表达基因(DEG)。
通路富集
用 msigdbr 导入 MSigDB 的 Hallmark 和 Gene Ontology Biological Process(GOBP)基因集[15],用 clusterProfiler 的超几何检验分析显著 DEG 富集[16],按校正 p 判定。对于基因数较少的分析,即两次比较交集得到的 BPH 上调 WIF1⁺ 基底相关基因,采用 MSigDB 在线平台的 GSEA;选取 FDR q<0.05 的前 10 条通路作图。
Ingenuity 通路分析(IPA)
依据文献已知相互作用构建的生物网络,推断基底细胞群表达差异的上游调节因子及通路[17]。根据相关基因预测的上调或下调计算 z 分数。用 Seurat 比较 WIF1⁺ 与其他基底群,选 |log₂FC|>1 且 FDR 校正 p<0.01 的 DEG 进行 IPA,并绘制通路、上游调节因子及其 z 分数。
显色原位杂交(CISH)
FFPE 切片 60°C 烘烤 30 分钟,室温二甲苯脱蜡两次、每次 10 分钟,再经两次 100% 乙醇处理、风干。室温加过氧化氢 10 分钟;在 1× RNAscope Target retrieval reagent(Advanced Cell Diagnostics,322000)中 100°C 蒸热 18 分钟,再用 Protease Plus(322331)于 40°C 消化 30 分钟。探针为 Hs-TP63(601891-C1)、Hs-NRG1(311181-C1)、Hs-VCAN(430071-C1)、Hs-WIF1(429391-C2)。加探针后在 HybEZ II 烤箱 40°C 孵育 2 小时,按厂商流程放大和显色;C1 为绿,C2 为红。50% Gill 苏木精复染 30 秒,60°C 烘烤 15 分钟,用 VectaMount 永久封片剂(Vector Laboratories,H-5000)封片,并以 VENTANA DP200(Roche)扫描。
细胞通讯网络
使用 CellChat[18],将归一化表达数据转为 CellChat 对象,根据配体—受体数据库及表达模式预测信号网络。把某通路全部配体—受体相互作用概率合并为通路水平通讯概率;细胞群不足 10 个细胞时,过滤其通讯。
结果
前列腺主要细胞类型
对 10 位因局限性前列腺癌接受根治性切除者的组织进行 scRNA-seq。每人分别取 PZ、CZ、TZ 良性区,经组织学检查均未见浸润性腺癌(图 1A,B)。排除润湿失败等技术问题导致的低质量样本后,保留 PZ 7 份、CZ 9 份、TZ 9 份,共 25 份、129,887 个高质量细胞。PZ 数据曾用于研究肿瘤特异性改变[13],本研究将其与另两区共同重分析。
UMAP 和无监督聚类主要按细胞类型分群(图 1C)。经典标志用于注释:上皮 KRT8/KRT18,内皮 KDR/FLT1,周细胞 RGS5/NOTCH3,T 细胞 CD3D/CD3E,髓系 CD68/C1QB,成纤维 DCN/LUM,平滑肌 ACTG2/DES,B 细胞 CD79A/MS4A1,肥大细胞 TPSAB1/TPSB2(图 S1)。差异表达支持这些注释(图 1D)。
对上皮再聚类并行 PCA、UMAP,得到腔面 KLK3/ACPP、基底 KRT14/DST 和罕见神经内分泌 CHGA/CHGB 亚型(图 1E,F)。在 UMAP 基底与腔面群之间还有一群细胞,常表达 LTF 或 KRT13,以及与前列腺炎症性萎缩(PIA)[13,19–22]和 club/hillock 细胞[2]相关的基因,提示中间上皮状态。其独特标志包括 LTF、LCN2、OLFM4、MMP7、KRT13(图 1G)。
WIF1⁺ 基底细胞富集于移行区
既往已有基底细胞分区差异报道[5,23]。本研究初始 UMAP 中,基底细胞群被中间上皮群隔开(图 1E),提示内部转录异质性。仅对子集基底细胞再聚类,识别四群(图 2A):第一群强表达 KRT5、KRT15、KRT23,命名 KRT23⁺,呈经典基底表达程序;第二群以 DDIT3、TXNIP、HES1、MAFB 为标志,与应激及 paligenosis(成熟细胞重新获得增殖能力的程序)一致[24,25],可能对应既往 PLCG2⁺/c3[7];第三群较少,以 FOXI1 和液泡型 H⁺-ATPase 亚基为特征,类似离子细胞样基底细胞[7](图 2B、S2)。
第四群高表达 WIF1、VCAN、PPP1R14C、NPPC、SFRP1,接近既往 Basal-5-VCAN 亚型[6]。全细胞类型比较显示 VCAN、SFRP1 也在成纤维细胞表达,而 WIF1 特异且显著富集于这一基底群(图 2C),故命名 WIF1⁺ 基底细胞。各样本相对丰度分析显示其明显富集于 TZ(图 2A,D)。
对不同分区标本行 TP63 与 WIF1 CISH,证实 WIF1 主要局限于 TZ 的 TP63⁺ 基底上皮,PZ、CZ 基底细胞几乎不表达;少数间质 WIF1⁺ 细胞主要在 PZ、CZ(图 2E、S3)。VCAN/WIF1 CISH 显示 TZ 腺体基底细胞共表达,两区间质成纤维样细胞也表达 VCAN(图 S4),支持 TZ 富集的 WIF1⁺VCAN⁺ 群体,但 VCAN 单独不特异。
小鼠前列腺中,基底上皮均不表达 Wif1;其高表达局限于一群成纤维细胞(图 S5),对应 Joseph 等所称导管成纤维细胞[4]及本组此前报道的 Rorb⁺ 腺下成纤维细胞[26]。这些结果提示小鼠缺少人类的 WIF1⁺ 基底亚型。
EMT、间质重塑及免疫调节
相比其他三个基底亚型,WIF1⁺ 群特异上调 104 个基因(图 3A、表 S1)。MSigDB Hallmark 中最显著的是上皮—间质转化(EMT),另有血管生成、雄激素反应、凝血、顶端连接,提示参与组织重塑及区域动态(图 3B)。GO 分析还涉及前列腺发育与形态发生(图 3C)。
IPA 推断最显著激活的通路包括细胞外基质组织、胶原生物合成及修饰酶、胶原链三聚化(图 3D、表 S2),提示可能参与基质/基底膜重塑及腺体结构支持,即组织结构相关程序被激活。相反,吞噬体形成、中性粒细胞脱颗粒、S100 家族信号等免疫通路预计受抑;被抑制的主要上游因子包括 IFNG、IL1B、NFKB1、TNF,激活者包括 IL10RA、IL4R 等抗炎相关因子(图 3E、表 S3)。这些分析提示移行区微环境中的免疫调节作用及免疫原性程序受抑。
配体—受体分析推断 NRG(神经调节蛋白)信号仅由 WIF1⁺ 基底细胞发向其他上皮群(图 3F)。弦图显示其为独特配体来源,靶细胞为腔面、中间上皮和 FOXI1⁺ 基底细胞,腔面细胞相互作用最强。具体为 WIF1⁺ 细胞产生 NRG1,与腔面细胞 ERBB2/ERBB3 相互作用(图 3G)。同批 TZ 标本 CISH 证实 NRG1 与 WIF1 共定位(图 3H)。鉴于 NRG–ERBB 参与上皮形态发生和稳态[27],该群可能调节移行区上皮维持与分化。另外,预测其分泌 LAMC1、LAMC2、LAMB3、TNC 等基质成分,与上皮和间质整合素受体作用(图 S6),进一步支持上皮—间质通讯和微环境重塑的潜在作用。
WIF1⁺ 基底细胞在 BPH 中富集
鉴于其 TZ 富集及 EMT[12]、雄激素反应[8]、间质重塑[10]特征,作者假设该群参与 BPH。重分析既往数据[4],包括 3 份 BPH 腺性样本(GSM5252126、GSM5252128、GSM5252130)及 6 份正常供体样本(GSM5252457、GSM5252459、GSM5252461、GSM5252458、GSM5252460、GSM5252462),主要细胞类型清晰分离(图 4A)。基底子集同样出现 KRT23、DDIT3、WIF1、FOXI1 四群(图 4B,C);WIF1 群的 WIF1、VCAN、NPPC、PPP1R14C 特征与本研究高度相似(图 S7)。其比例在 BPH 显著高于正常供体 TZ(图 4D,E)。
同研究的 3 份 BPH 间质结节(GSM5252127、GSM5252129、GSM5252131)以上皮以外的成纤维和平滑肌细胞为主;但少量上皮中的相当部分基底细胞表达 WIF1(图 S8)。在 2 位 TURP 患者(66、71 岁)及 2 位年轻供体(21、25 岁)TZ 上行 TP63/WIF1 CISH,确认 BPH 标本该群丰富(图 4F,G、S9)。无明显炎细胞浸润的 BPH 结节,WIF1 表达更一致、更强;明显慢性炎症区或邻近炎症浸润的腺体则较少,提示与炎症调控的潜在联系(图 S10)。
重分析既往 BPH 与正常前列腺 bulk RNA-seq[28],WIF1、NPPC、VCAN 等属于最显著上调基因(图 S11)。DESeq2 校正与不校正年龄所得结果高度一致(图 S12)。以本研究单细胞数据为参照进行稳健细胞类型分解(RCTD),进一步证实 BPH 的 WIF1⁺ 群较正常组织及 BPH 间质结节显著富集(图 4H、S11)。
BPH 中上调的 WIF1⁺ 基底相关基因
在既往单细胞数据[4]中比较 BPH 与正常供体 TZ 的 WIF1⁺ 群,RPS10、RPS29、RPL39、RPL12 等大量核糖体基因上调(图 5A、表 S4)。GO 富集于核糖体生物发生,提示 BPH 中生物合成活性升高;氧化应激和细胞黏附通路也上调(图 5B)。
取两组 DEG 的交集——本研究 WIF1⁺ 对其他基底亚型,以及 Joseph 等数据中该亚型的 BPH 对供体 TZ——得到 45 个共同上调基因,称为“WIF1⁺ 基底相关 BPH 上调基因”(图 5C、表 S5)。显著者包括 WIF1、VCAN、PPP1R14C、NRG1、ITGA2、PRSS23、GLIPR1、GPR87、UCHL3、PAWR(图 5D)。
WIF1 是 WNT 抑制因子[29],VCAN 编码主要基质蛋白聚糖,提示调节上皮—间质信号及基质重塑[30];PPP1R14C 为蛋白磷酸酶 1 调节抑制因子,可能参与细胞骨架或收缩调节[31]。NRG1 也在 BPH 升高,结合其指向邻近上皮 ERBB2/ERBB3 的预测,提示旁分泌作用。BPH 标本 VCAN、NRG1 CISH 均显示与该群一致的基底层分布(图 5E,F)。
PRSS23 为切割蛋白肽键的丝氨酸蛋白酶[32],GPR87 编码与纤维化有关的 G 蛋白偶联受体[33],UCHL3 通过去除其他蛋白的泛素参与细胞过程[34],均提示增殖及上皮—间质重塑。这些基因呈梯度:BPH 最高,供体 TZ 最低,切除标本 TZ 居中(图 5D);后者不少已有符合 BPH 的结节性增生(图 S3)。
另对 Cao 等按前列腺体积分组的独立公开单细胞数据 GSE226237[35]重分析,WIF1⁺ 群为主要基底亚群;大体积 BPH 基底细胞的 WIF1 及相关基因表达高于小体积组(图 S13)。上述共同上调基因富集于 EMT、雌激素反应、顶端连接和血管生成(图 5G),以及细胞增殖、分化、运动等 GOBP 条目(图 5H)。作者据此推测,TZ 富集的 WIF1⁺ 基底细胞可能通过上皮与间质重塑参与 BPH 发病。
图 1.
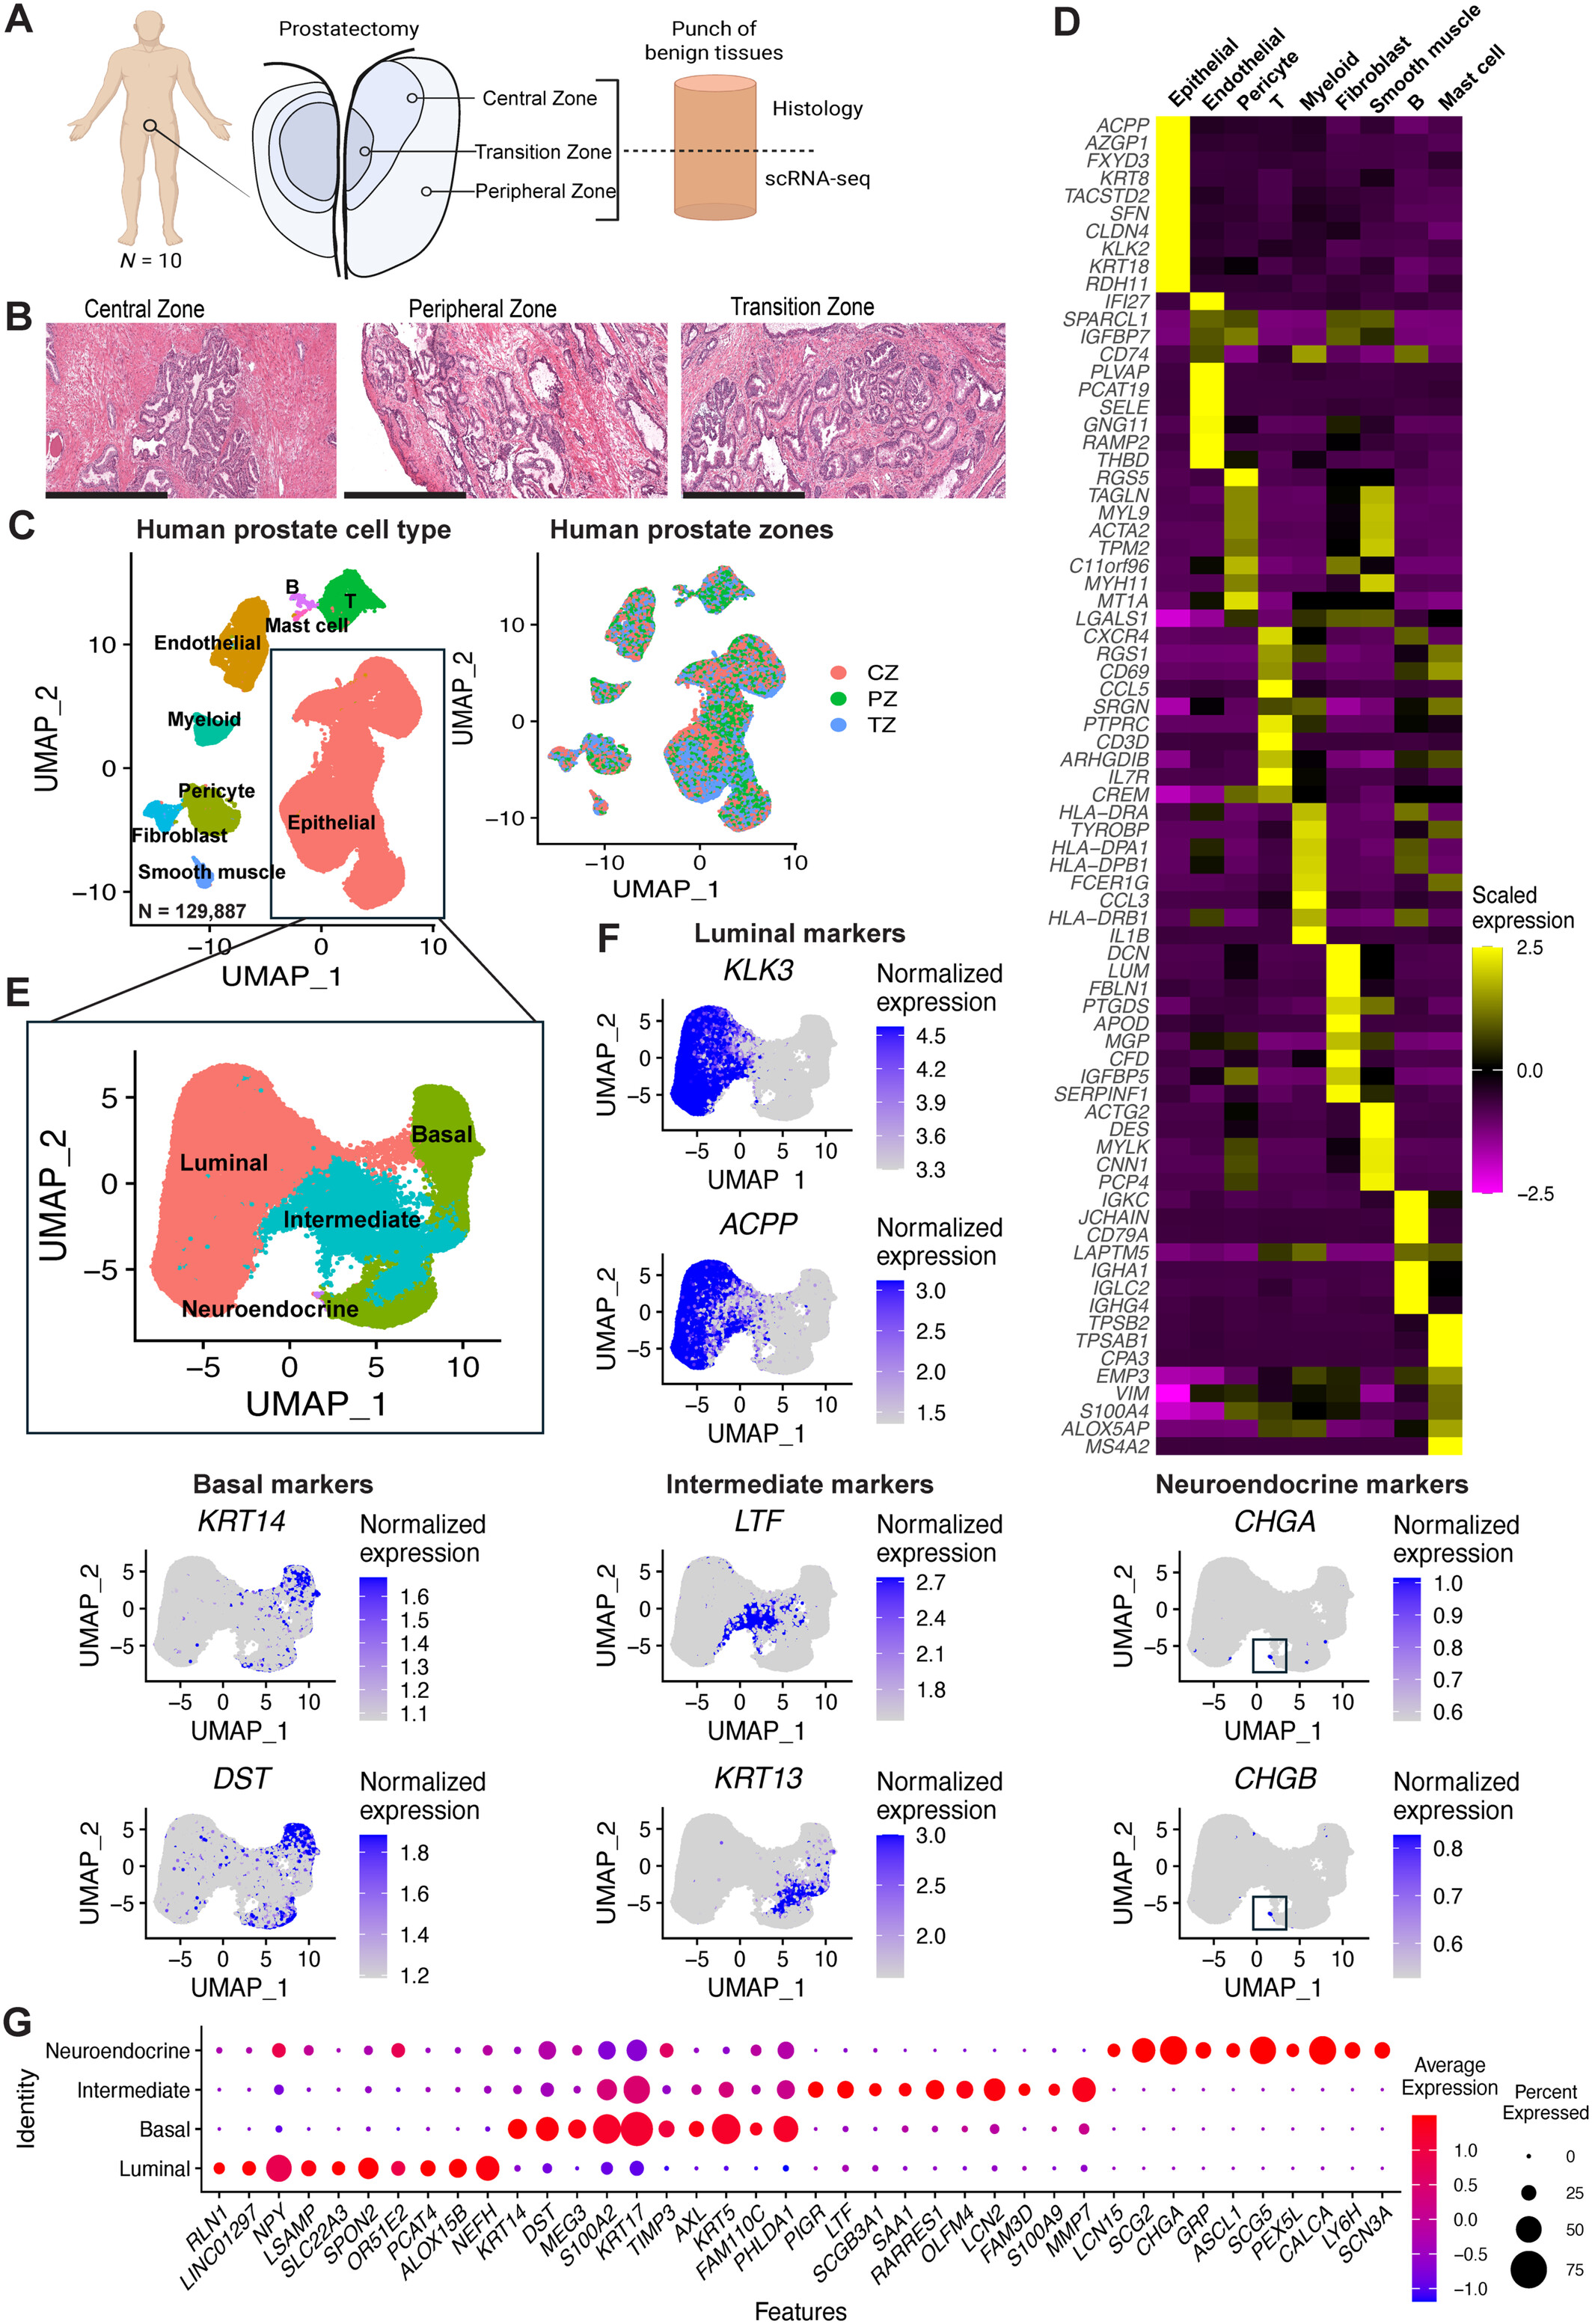
图 2.
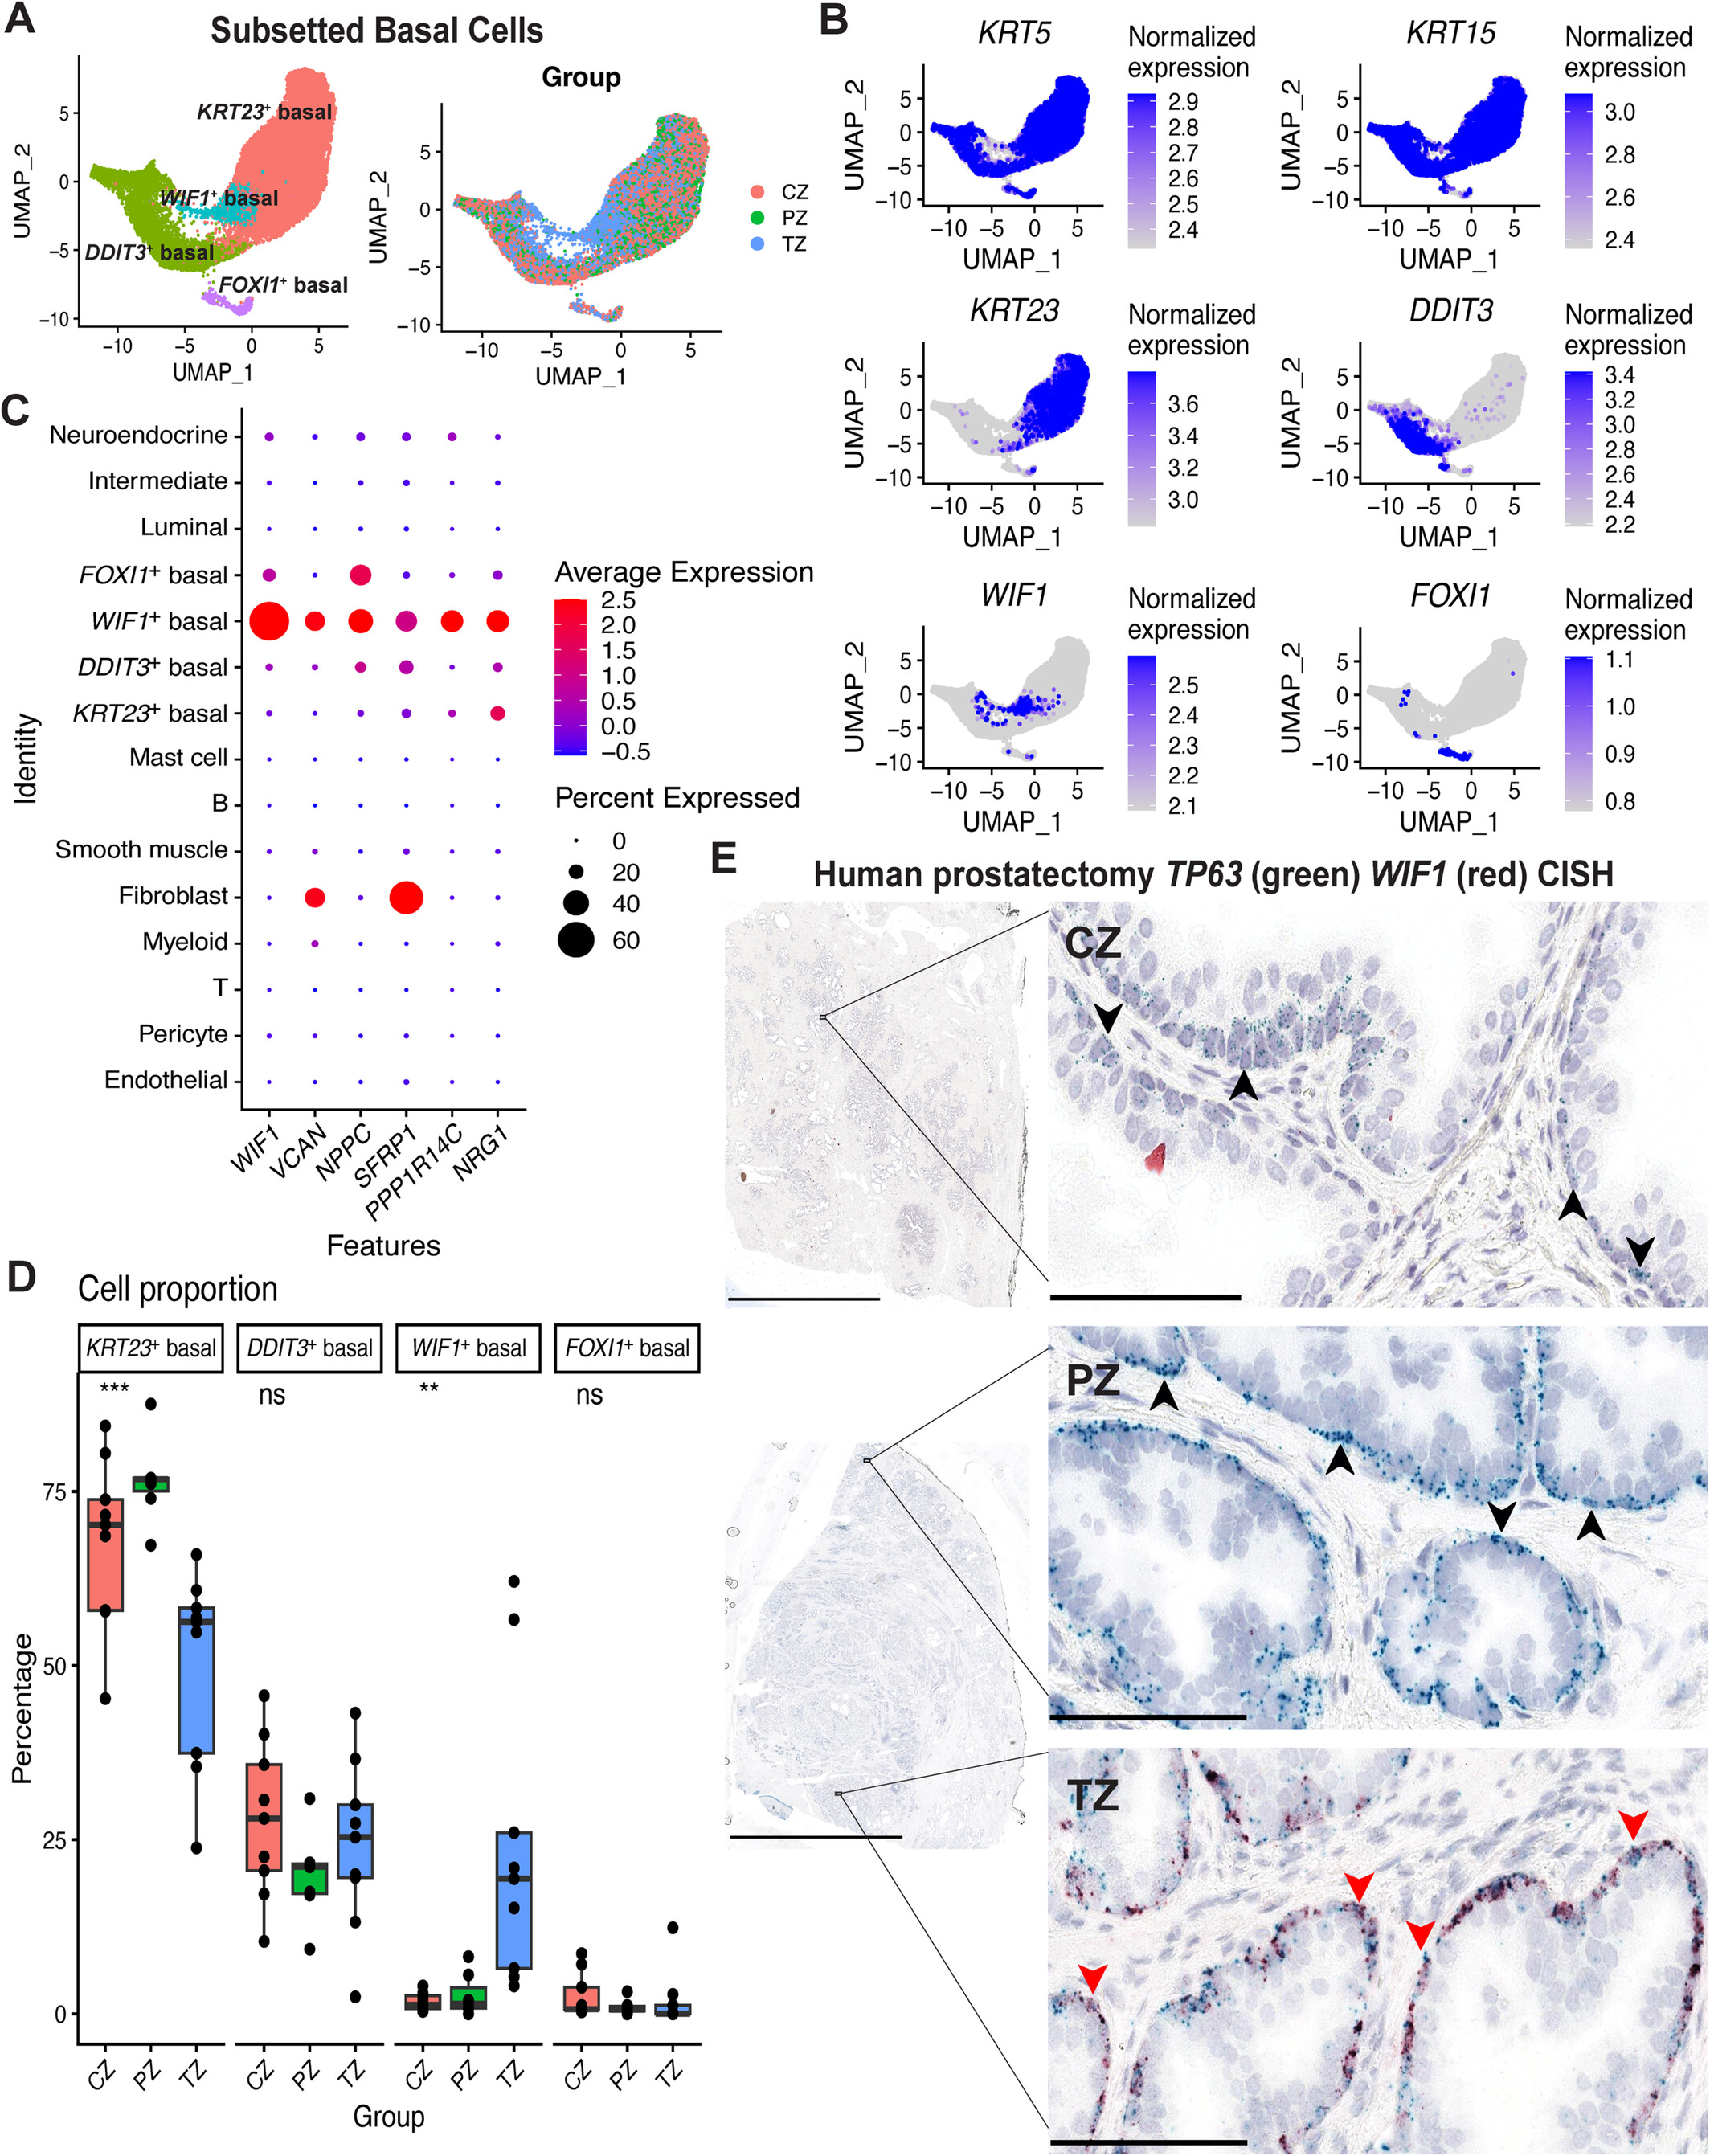
图 3.
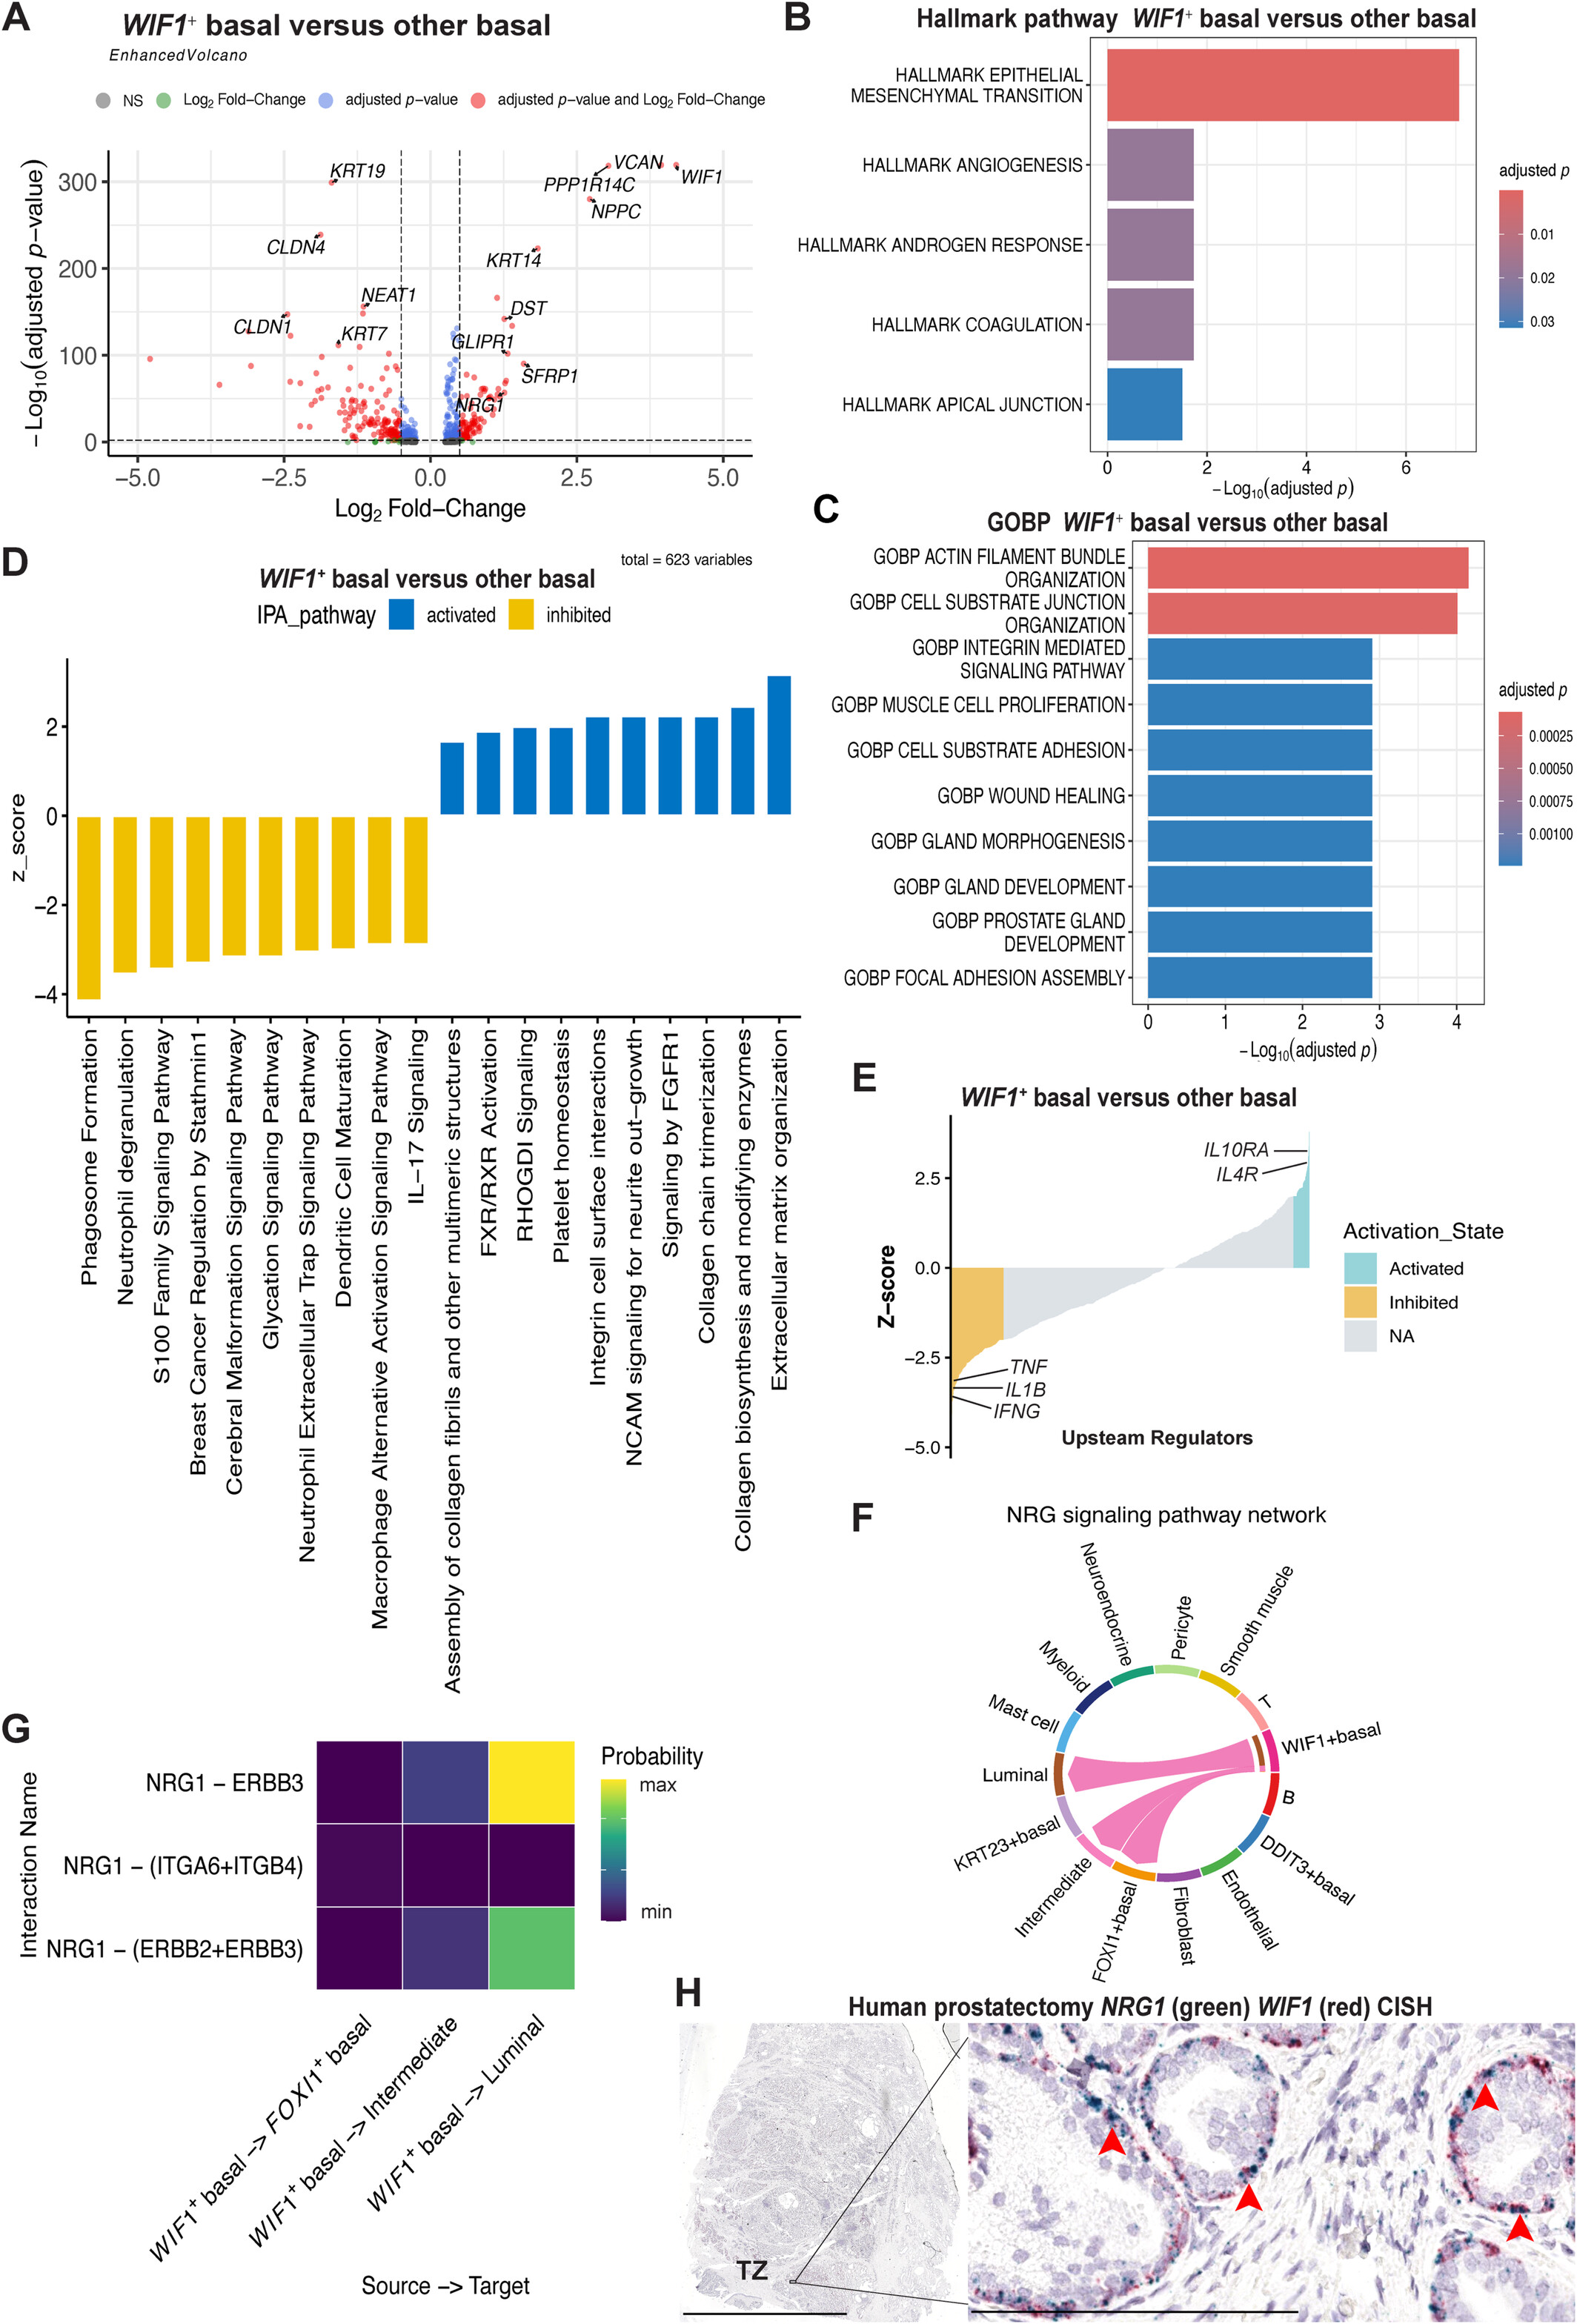
图 4.
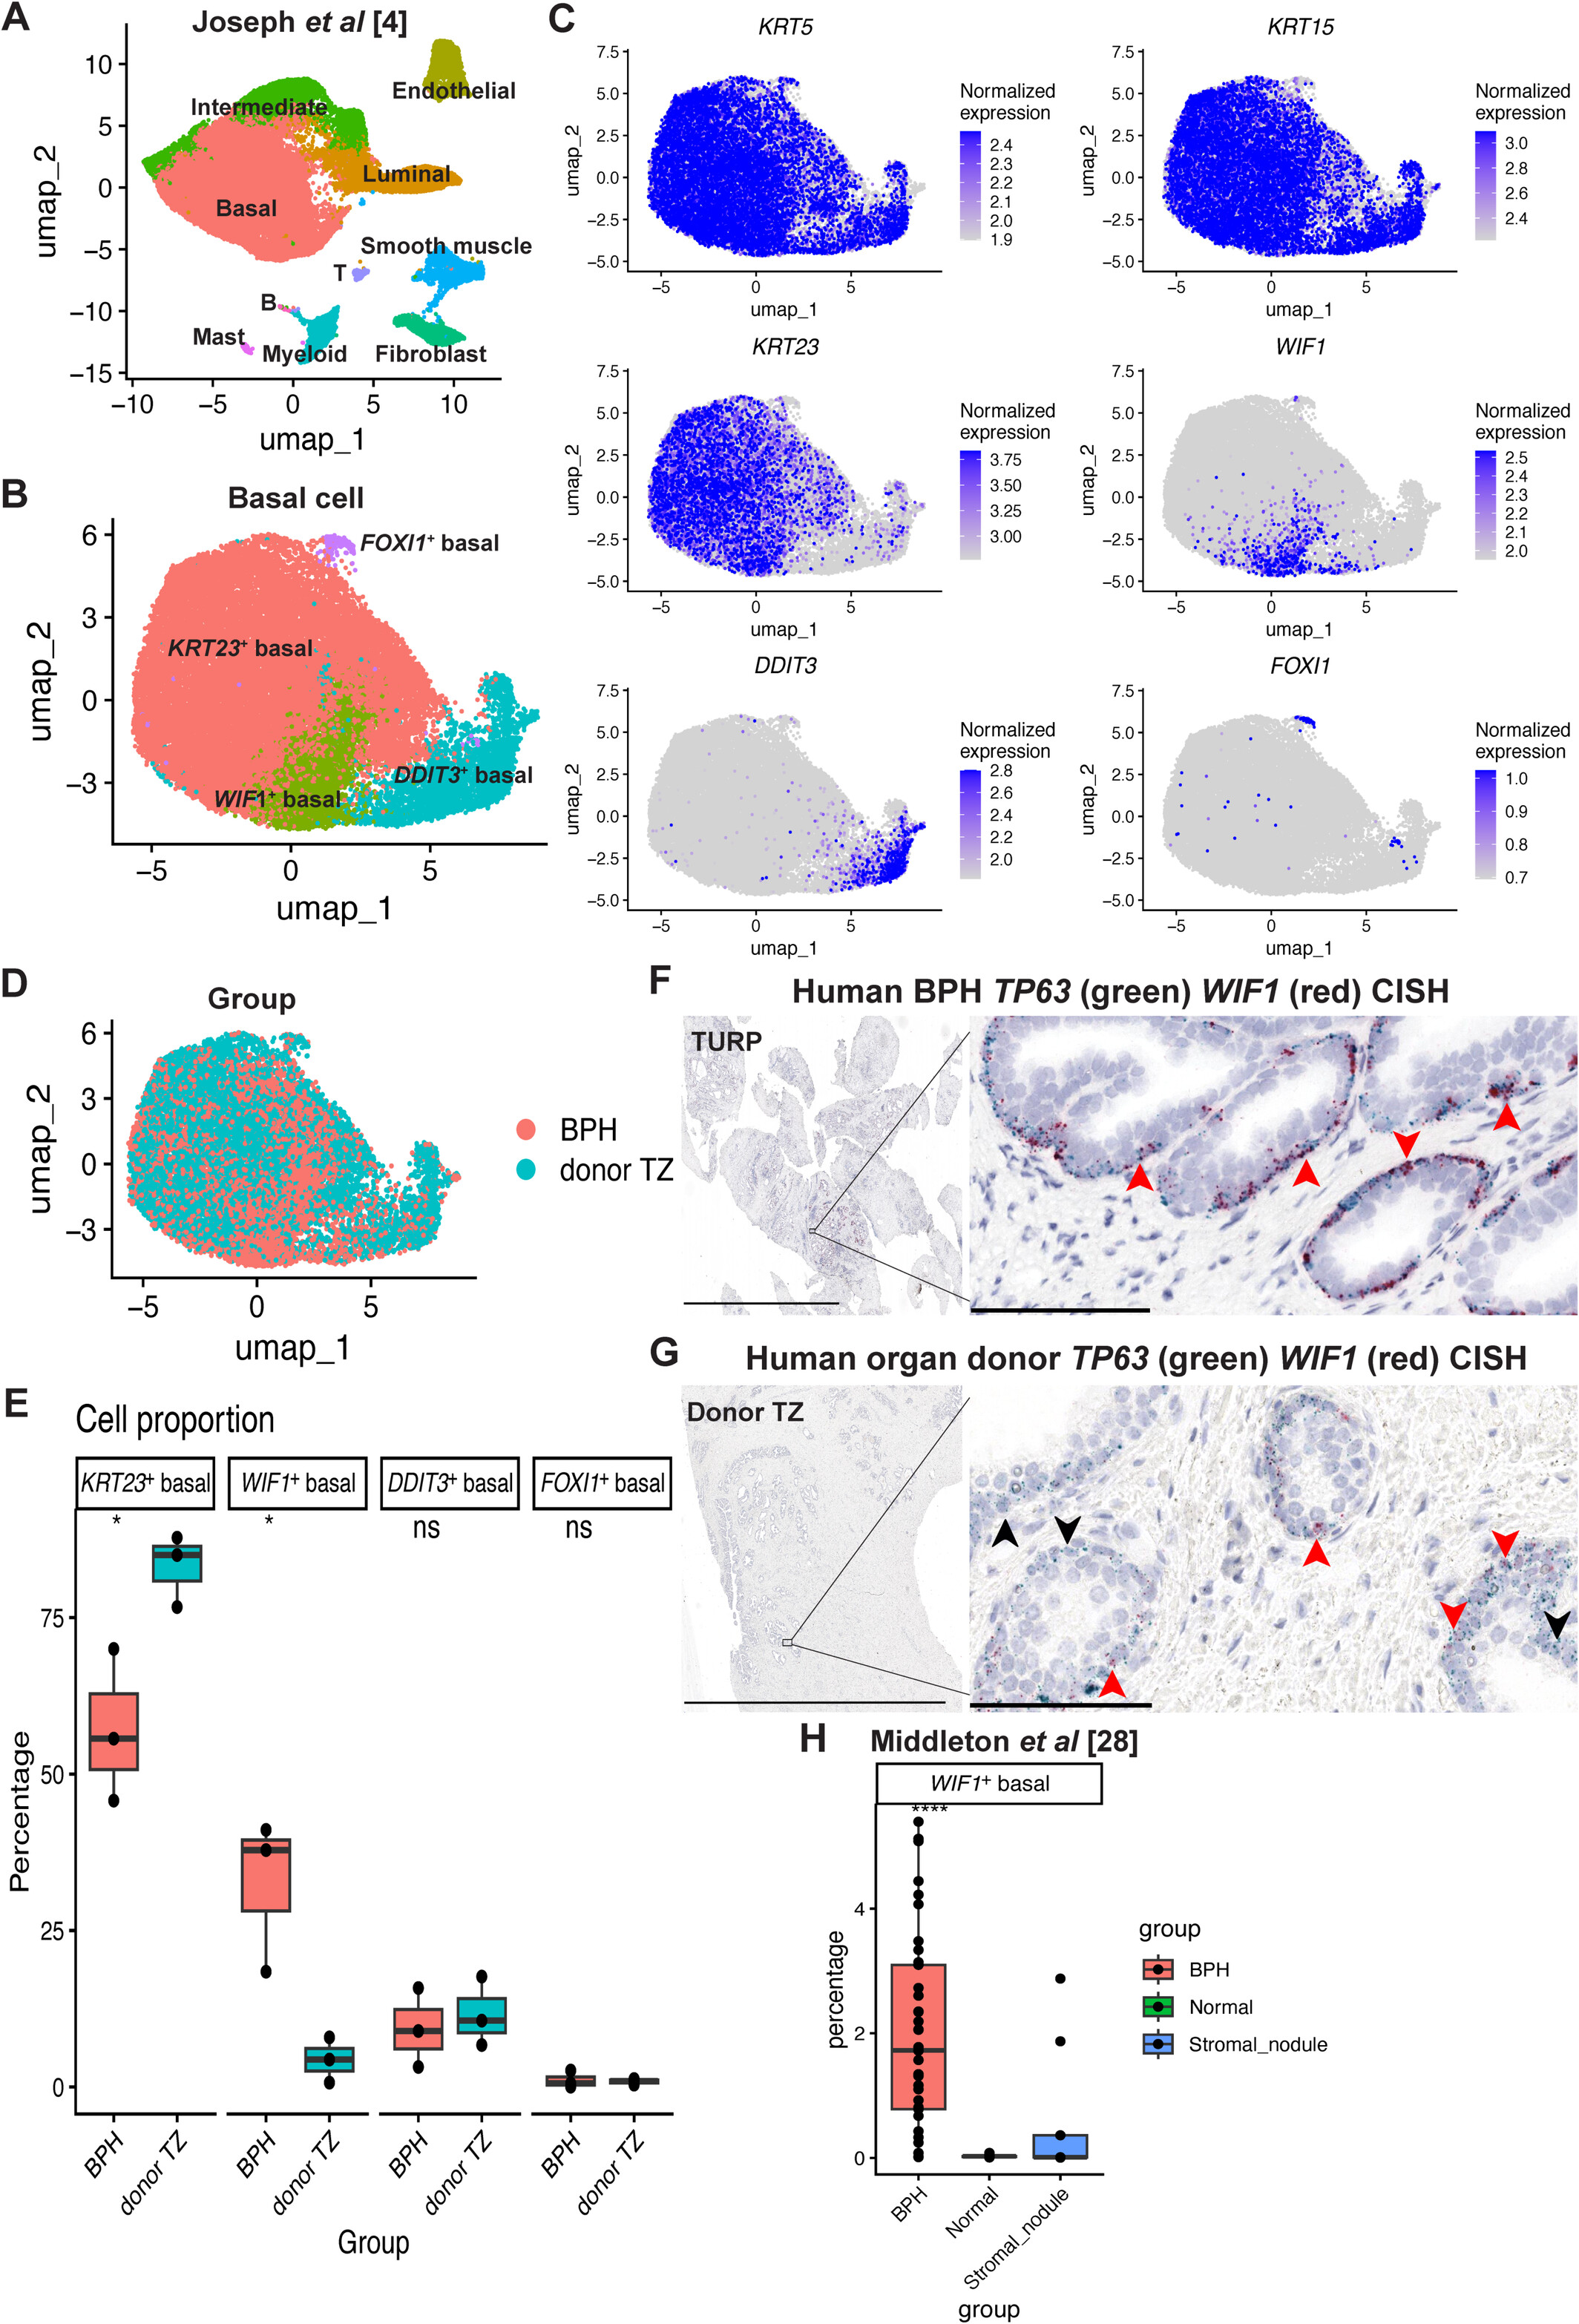
图 5.
讨论
人前列腺上皮主要包括腔面、基底、中间型及少量神经内分泌细胞,基底亚型文献较少。本研究发现转录和解剖位置均独特的 WIF1⁺ 群,其 WIF1、VCAN、PPP1R14C、NRG1 表达与 Hu 等的 Basal-VCAN 一致[6]。Hu 等认为该群主要分布于 PZ 与 TZ,而本研究 scRNA-seq 和 CISH 均显示显著 TZ 富集。
WIF1 是最突出的标志。雄激素反应及腺体发育/形态发生通路富集,与既往 WIF1 受雄激素调控并参与前列腺发育的研究一致[36]。WIF1 为分泌性 Wnt 拮抗因子,Wnt 对增殖和癌发生重要[37–47];其他分泌性拮抗因子包括 sFRP[48]和 Dkk[49]。本群 SFRP1、DKK3 同样高表达(表 S1);三者在 TZ 基底层联合表达,可能形成局部 Wnt 梯度,限制间质配体激活上皮受体[50]。
IPA 还显示相对其他基底群,其炎症通路受抑。作者推测该群可形成 WNT 活化较弱、炎症较低的上皮微环境,维持稳态,并可能解释 TZ 前列腺癌起始率较低;此假说仍须机制验证。
BPH 是常见的年龄相关疾病,以 TZ 上皮及间质增生为特征[51]。公开数据结合 TURP 的 CISH 显示 WIF1⁺ 群在 BPH 富集,且相对于供体 TZ,其基因特征发生明显改变,提示可能参与发病。
VCAN 编码基质 versican,CISH 证实其表达,提示活跃的基质重塑。Versican 可促进成纤维细胞活化和肌成纤维样表型[52,53],可能驱动 BPH 的纤维肌性扩张。EMT 是该群最显著 Hallmark;上皮获得间质特征的过程参与可塑性、再生和纤维化[54],与既往将 EMT 联系到 BPH 的证据一致[12]。
NRG1 可激活邻近上皮 ERBB2/3,促进增殖和存活[55],在肠干细胞微环境的上皮再生中已有证明[56]。本研究推断 NRG 仅由 WIF1⁺ 群指向其他上皮,尤其腔面细胞;切除及 BPH TURP 标本 CISH 均确认 NRG1 在该群表达。作者提出该群分泌 NRG1,形成促进 BPH 上皮发展的旁分泌环。既往研究也曾报道成纤维细胞分泌 NRG1,与上皮 EGFR、ERBB3 相互作用[4,6]。
WIF1⁺ 群的功能可能依情境而变:WIF1、SFRP1、DKK3 高表达及炎症通路相对受抑支持稳态作用;同时,其 NRG1、VCAN、EMT、基质组织、血管生成及 BPH 增殖特征又支持重塑。CISH 证实同一基底群共表达 WIF1、NRG1、VCAN,提示可随生理或疾病环境协调两类程序。雄激素受体在前列腺也有类似情境依赖行为[57];还需功能研究确定各通路相对贡献和时间动态。
小鼠 Wif1 不在基底细胞表达,而标记 Rorb⁺ 腺下成纤维细胞[26],提示人 WIF1⁺ 基底群可能具有间质样特征。Alonso-Magdalena 等认为 BPH 间质可经 EMT 由上皮产生,即上皮失去极性和基底膜附着并获得间质特征[12]。本群是否为基底上皮与间质之间的中间态,仍待研究。
不同年龄的供体及 TURP 队列均显示 TZ 富集。Middleton 等 bulk 数据经年龄校正与未校正分析高度一致。年龄影响不能完全排除,也可能随老化功能增强,但其优先定位 TZ 看来较稳健。该群可能支持 EMT、增殖、基质组织和血管生成,而 PZ、CZ 缺少这种微环境;因此其 TZ 富集可能是 BPH 区域偏好的关键细胞因素。
核心局限是缺少直接功能实验。单细胞转录组、通路富集及组织验证共同支持其与 EMT、基质重塑、增殖、WNT 调节有关,但仍只是相关性。没有谱系追踪、体外共培养或体内模型,尚不能判断它是重塑的致因还是继发反应。未来需定向改变 WIF1 表达或清除该群,确定因果与机制;空间转录组也有助于原位描绘其与间质、免疫及血管成分的相互作用。
致谢与作者贡献
感谢 Sidney Kimmel Comprehensive Cancer Center 实验与计算基因组核心支持单细胞测序及分析(P30CA006973,WGN、SY)。部分资助来自 NIH/NCI P50CA058236(WGN、SY、AMD)、U01CA196390(AMD、SY)、P01CA247886(SY)、U54CA274370(AMD、SY)、P50CA180995(CEP 授予 MKG),以及 Prostate Cancer Foundation、Allegheny Health Network Johns Hopkins Pilot Project、Patrick C. Walsh Fund、Irving Hansen Foundation、Commonwealth Foundation、Maryland Cigarette Restitution Fund(均 SY)。RW、AMD、SY 构思;RW、QZ、AMD、SY 设计实施方法;QZ、AMD、SY 验证;RW、AMD、SY 分析;WGN、AMD、SY 提供资源和经费;RW、AG、YZ、KS、JM、AS、DH、SY 整理数据;RW、SY 起草;AMD、SY 监督。全体作者参与修改并批准稿件。
数据可用性
Joseph 等[4]的人正常及 BPH 数据为 GEO GSE172357,包含上述 3 份腺性 BPH、3 份间质 BPH 及 6 份年轻供体样本,按相同流程过滤、整合、聚类、注释及差异表达分析。Cao 等[35]独立 BPH 数据为 GSE226237,大体积样本 GSM7068696、GSM7068697、GSM7068698,小体积样本 GSM7068699、GSM7068700、GSM7068701,同样预处理后比较细胞类型及体积组。
Middleton 等[28]BPH、间质结节和正常前列腺 bulk RNA-seq 为 dbGaP phs001698.v1.p1;作者经批准下载受控访问数据,用 DESeq2 进行有/无年龄校正的比较,以本研究单细胞数据为参照做 RCTD[58]。Graham 等[26]小鼠数据为 GEO GSE228945。本研究新产生的人前列腺切除数据存于 dbGaP phs003480.v2.p1。
补充材料目录
原页面正文没有独立数据表;以下保留其补充材料目录表。数据表 S1–S5 位于作者补充文件中,保留原始下载入口。
补充材料目录(原文 Supporting Information)。数据表 S1–S5 位于作者补充文件。
| Filename | Description |
|---|---|
| path70117-sup-0001-FiguresS1-S13.docxWord 2007 document , 22.2 MB | Figure S1. Expression of canonical marker genes across human prostate cell populations Figure S2. Differentially expressed genes defining prostate basal cell subtypes Figure S3. Enrichment of WIF1+ basal cells in the human prostate transition zone Figure S4. VCAN is expressed in WIF1+ basal cells Figure S5. Wif1 expression is restricted to a subset of mouse prostate fibroblast Figure S6. Ligand-receptor interactions involving WIF1+ basal cells Figure S7. Differentially expressed genes defining basal cell subtypes in benign prostatic hyperplasia (BPH) and organ donor prostate samples Figure S8. WIF1+ basal cells represent a major basal cell subtype in benign prostatic hyperplasia (BPH) stromal nodule sample Figure S9. WIF1+ basal cell is enriched in benign prostatic hyperplasia (BPH) Figure S10. Spatial association between WIF1+ basal cell and inflammation Figure S11. Enrichment of WIF1+ basal cells in benign prostatic hyperplasia (BPH) revealed by bulk RNA-seq deconvolution analysis Figure S12. Differential expression analysis of benign prostatic hyperplasia (BPH) bulk RNA-seq data with and without age adjustment Figure S13. Upregulation of WIF1+ basal cell associated genes in large-volume benign prostatic hyperplasia (BPH) |
| path70117-sup-0002-TablesS1-S5.xlsExcel spreadsheet, 227.5 KB | Table S1. Genes with significantly increased expression in WIF1+ basal versus other basal cell subtypes (p_val_adj < 0.05 and avg_log2FC > 0.5) Table S2. Ingenuity pathway analysis (IPA) of pathways in WIF1+ basal versus other basal cell subtypes (DEGs with p_val_adj < 0.01 and log2FC > 1) Table S3. Ingenuity pathway analysis (IPA) of upstream regulators in WIF1+ basal versus other basal cell subtypes (DEGs with p_val_adj < 0.01 and log2FC > 1) Table S4. Genes with significantly increased expression in WIF1+ basal, BPH versus donor TZ (p_val_adj < 0.05 and avg_log2FC > 0.5) Table S5. Overlapping genes from two comparisons—WIF1+ basal related BPH up-regulated genes |
Abstract
The cellular composition and disease susceptibilities of the distinct zones of the human prostate remain incompletely understood. Benign prostatic hyperplasia (BPH) is a common condition that causes widespread morbidity and is nearly exclusively localized to the transition zone (TZ). Through extensive single-cell RNA sequencing (scRNA-seq) of benign regions from prostatectomy specimens, we identified a basal cell population expressing WIF1, VCAN, and NRG1, among other genes, that was significantly enriched in the TZ. Analysis of previously published scRNA-seq datasets further confirmed that WIF1+ basal cells were significantly enriched in BPH compared with normal prostate. Pathway and cell–cell communication analyses revealed that this basal subtype is associated with programs related to cell proliferation, epithelial–mesenchymal transition, immune regulation, angiogenesis, and hormone response. Together, the molecular signature, zonal distribution, and pathway enrichment suggest that TZ-enriched WIF1+ basal cells may contribute to BPH pathogenesis by promoting epithelial and stromal remodeling. © 2026 The Author(s). The Journal of Pathology published by John Wiley & Sons Ltd on behalf of The Pathological Society of Great Britain and Ireland.
Introduction
The human prostate is an androgen-regulated organ anatomically divided into distinct zones—peripheral zone (PZ), central zone (CZ), transition zone (TZ)—as well as the anterior fibromuscular stroma, which lacks epithelium. Each of the epithelial rich zones (PZ, CZ, and TZ) harbor at least some unique histological features, cellular composition, and disease susceptibilities. Notably, benign prostatic hyperplasia (BPH) arises almost exclusively in the TZ, whereas prostate cancer develops predominantly in the PZ [1]. This striking zonal selectivity underscores the need to understand spatial heterogeneity in prostate biology and pathology.
Recent advances in single-cell RNA sequencing (scRNA-seq) have enabled dissection of the prostate's complex architecture at unprecedented resolution [2-5]. These studies have uncovered substantial heterogeneity within both epithelial and stromal lineages, revealing zone-specific cell states, lineage trajectories, and molecular signaling pathways. For example, Henry et al identified two novel epithelial populations, termed club and hillock cells, which were more abundant in the TZ than in the PZ [2]. Yan et al further demonstrated age-associated changes, reporting a TFF3+ luminal subtype with elevated MYC and E2F activity enriched in the PZ, while the TZ exhibited stronger transcriptional signatures related to immunity and stemness [3]. Stromal heterogeneity has also been noted, with Joseph et al and Yan et al both describing proximal–distal fibroblast density differences [3, 4]. Despite these insights, basal cell heterogeneity has received limited attention and remains poorly understood, likely due to small sample sizes [5]. One recent study described two lineages of KRT5+ basal cells (KRT16+KRT17+ and KRT16−KRT17−), which were further subdivided into seven transcriptionally distinct subtypes [6]. The other study described multiple basal subpopulations, including KRT15+/c1 and DST+/c6 clusters representing a classical basal phenotype, a rare RARRES2+/c17 basal subtype, and S100A2+/c2 and PLCG2+/c3 subtypes that were enriched for basal and hillock cell signatures [7]. Most prior studies focused solely on normal prostate tissue, limiting their ability to connect cell states with disease contexts such as BPH.
BPH is characterized by non-malignant proliferation of epithelial and stromal cells, leading to prostatic enlargement that can lead to urethral obstruction, causing lower urinary tract symptoms (LUTS) that substantially reduce quality of life. Although the pathogenesis of BPH remains incompletely understood, dysregulated androgen signaling [8], chronic inflammation [9], and stromal–epithelial interactions [10] are considered key contributors. Additional studies have implicated cellular senescence, extracellular matrix remodeling, and hormonal imbalances in disease progression [11, 12].
In this study, we analyzed peri-cancerous prostate tissues from 10 patients spanning all three anatomical zones and identified a distinct basal cell population-WIF1+ basal cells. This subtype was significantly enriched in the TZ and in BPH tissues, pointing to a zonally restricted population potentially involved in BPH pathogenesis. These findings provide a potential novel cellular basis for the clinical observation that prostate cancer arises predominantly in the peripheral zone, whereas BPH develops almost exclusively in the transition zone.
Materials and methods
Ethics approval
The study was performed under the Johns Hopkins University School of Medicine Institutional Review Board (IRB protocols NA_00048544 and NA_00087094) approved protocol. Written informed consent was obtained from all participants and the study was conducted in accordance with the Declaration of Helsinki (https://www.wma.net/what-we-do/medical-ethics/declaration-of-helsinki/).
Human prostatectomy tissue punches
Prostate tissue specimens were collected from men diagnosed with primary prostate cancer undergoing radical prostatectomy at The Johns Hopkins Hospital. Prostatectomies were sectioned fresh from apex to base, and fresh tissue samples were collected using an 8 mm punch biopsy tool from each zone of the prostate. H&E staining was performed to confirm no cancer lesion was included in these punch areas. Freshly collected tissue punches were processed for scRNA-seq [13].
Dissociation of human prostate tissues
Dissected tissues were minced with razor blades and digested in 0.25% Trypsin–EDTA (Gibco, Thermo Fisher Scientific, Waltham, MA, USA; catalog no. 25200-072) for 10 min at 37°C, followed by incubation for 2.5 h at 37°C with gentle agitation in DMEM containing 10% FBS, 1 mg/ml Collagenase Type I (Gibco 17100-017), and 0.1 mg/ml of DNase I (Roche, Basel, Switzerland; catalog no. 10104159001). Digested tissues were centrifuged at 400×g for 5 min, washed with Hank's balanced salt solution (HBSS), and further incubated in 0.25% Trypsin–EDTA for 10 min at 37°C. Cells were suspended in DMEM containing 10% FBS and 0.4 mg/ml of DNase I and filtered through a 40 μm cell strainer.
Single-cell RNA-sequencing and data pre-processing
Libraries for scRNA-seq were prepared using the 10x Genomics Chromium Single Cell 3′ Library and Gel bead Kit V2 (10x Genomics, Pleasanton, CA, USA; catalog no. CG00052_RevF) following the manufacturer's protocol for each human prostatectomy tissue punch. The cDNA libraries were sequenced (150 bp paired-end) on the Illumina HiSeqX platform (Illumina, San Diego, CA, USA). Each sequenced library was demultiplexed to FASTQ files using Cell Ranger (10x Genomics). Cell Ranger (version 3.2.0) count pipeline was used to align reads to the GRCh38 transcriptome and create a gene-by-cell count matrix. The resulting gene expression matrix was loaded into Seurat (v4.0.4) in R (https://satijalab.org/seurat/, last accessed 28 August 2026). Low-quality cells were filtered out if genes were below 500, as well as if mitochondrial genes were > 20%.
Data integration and cell type identification
We applied the ‘anchor-based’ integration method to assemble multiple samples into an integrated dataset, following the Seurat integration workflow [14]. After running principal component analysis (PCA), FindNeighbors and FindClusters functions, we performed nonlinear dimensionality reduction with the RunUMAP function to obtain a two-dimensional representation. Differential gene expression analysis of previously characterized cell type-specific genes was used to identify the cell type for each cluster. A small cluster of cells expressing biomarkers from more than one cell type (epithelial, stromal, and immune) were considered as doublets and removed from downstream analysis.
Differential gene expression analysis
The FindMarker function in the Seurat package was performed to identify differentially expressed genes (DEGs) among cell clusters or samples. Statistical significance was assessed using the Wilcoxon rank-sum test, and p values were adjusted for multiple testing using the Benjamini–Hochberg method. Genes with log2(fold-change) > 0.5 and adjusted p < 0.05 were considered significant DEGs.
Pathway enrichment analysis
Gene sets from the Molecular Signatures Database (MSigDB), including the Hallmark and Gene Ontology Biological Process (GOBP) collections, were imported using the R package msigdbr [15]. Pathway enrichment analysis of significant DEGs was performed using clusterProfiler with the hypergeometric test [16]. Significantly enriched pathways were identified based on adjusted p values. For analyses with a limited number of DEGs, specifically WIF1+ basal genes upregulated in BPH and identified by intersecting two comparisons, pathway enrichment was performed using Gene Set Enrichment Analysis (GSEA) via the MSigDB online platform (https://www.gsea-msigdb.org/gsea/msigdb/index.jsp). The top 10 pathways with a false discovery rate (FDR) q value < 0.05 were selected for visualization.
Ingenuity pathway analysis (IPA)
Upstream regulators that are likely to mediate the observed gene expression differences across basal cell clusters were analyzed using ingenuity pathway analysis (IPA) [17]. Biological networks constructed from known interactions in the published literature were used to infer upstream molecular regulators and pathways. Using observed differential gene expression, a z-score was derived from predicted up-regulation or down-regulation of relevant genes in a pathway. Seurat was used to perform differential gene expression analyses comparing WIF1+ basal to other basal cell clusters. The subsequent IPA analysis was implemented with DEGs with at least abs(log2FC) > 1 and a FDR adjusted p value < 0.01. The predicted pathways and upstream regulators were plotted with their associated z-scores.
Chromogenic in situ hybridization (CISH)
To prepare formalin-fixed paraffin-embedded (FFPE) tissue for chromogenic in situ hybridization (CISH) staining, slides were incubated for 30 min at 60°C and deparaffinized by incubating slides at room temperature (RT) for 10 min in xylene twice, and then subsequently incubated in 100% ethanol twice and finally left to air dry. Hydrogen peroxide solution was added to the slides for 10 min at RT. Slides were steamed in 1× RNAscope Target retrieval reagent (Advanced Cell Diagnostics, Newark, CA, USA; catalog no. 322000) at 100°C for 18 min, followed by Protease Plus (Advanced Cell Diagnostics; catalog no. 322331) digestion for 30 min at 40°C to allow target accessibility. The following probes were used for CISH staining: Hs-TP63 (Advanced Cell Diagnostics; catalog no. 601891-C1), Hs-NRG1 (Advanced Cell Diagnostics; catalog no. 311181-C1), Hs-VCAN (Advanced Cell Diagnostics; catalog no. 430071-C1), and Hs-WIF1 (Advanced Cell Diagnostics; catalog no. 429391-C2). Probes were added to slides and incubated in the HybEZ Oven (Advanced Cell Diagnostics, model HybEZ II) for 2 h at 40°C, followed by signal amplification and detection assay following the manufacturer's protocol. The C1 probe signal was detected with green color and C2 probe signal was detected with red color. Slides were counter-stained with 50% Gill's Hematoxylin for 30 s, baked for 15 min at 60°C, coverslipped with VectaMount permanent mounting medium (Vector Laboratories, Newark, CA, USA; catalog no. H-5000), and then scanned using a VENTANA DP200 scanner (Roche).
Cell–cell communication network analysis
CellChat [18] was used to explore the cell–cell communication between cell types. First, the normalized gene expression data were converted into a CellChat object. A ligand–receptor interaction database was used to predict signaling networks based on gene expression patterns. Next, communication probabilities were computed at the signaling pathway level by aggregating the probabilities of all ligand–receptor interactions associated with each pathway. We filtered out communications if there were fewer than 10 cells in the cell group.
Results
Identification of major cell types in human prostate
We performed scRNA-seq on prostate tissues from 10 individuals who underwent radical prostatectomy for treatment of localized prostate cancer. From each subject, benign regions were sampled from the PZ, CZ, and TZ, and were evaluated by histology to assess the presence of malignant glands. No invasive adenocarcinoma was identified in the benign tissue punches (Figure 1A,B). After excluding low-quality samples due to technical failures (e.g., wetting failure), we retained seven PZ, nine CZ, and nine TZ samples, yielding a total of 129,887 high-quality single cells across 25 samples. Data from the PZ were previously reported in the context of assessing tumor specific alterations [13], and were re-analyzed with the data from the other two zones in this study.
Figure 1.
Uniform manifold approximation and projection (UMAP) based dimensionality reduction and unsupervised clustering revealed distinct cell populations that were grouped primarily by cell type in the UMAP projection (Figure 1C). Based on canonical markers, we annotated epithelial (KRT8, KRT18), endothelial (KDR, FLT1), pericyte (RGS5, NOTCH3), T cell (CD3D, CD3E), myeloid (CD68, C1QB), fibroblast (DCN, LUM), smooth muscle (ACTG2, DES), B cell (CD79A, MS4A1), and mast cell (TPSAB1, TPSB2) populations (supplementary material, Figure S1). Differential gene expression confirmed cell-type specificity and reinforced these annotations (Figure 1D).
To further explore the epithelial cells, we subclustered epithelial cell clusters and performed dimensionality reduction with PCA followed by UMAP. This revealed canonical luminal (KLK3, ACPP), basal (KRT14, DST), and rare neuroendocrine (CHGA, CHGB) subtypes (Figure 1E,F).
Strikingly, we identified a population of cells situated between basal and luminal clusters in the UMAP coordinate system. These cells often expressed LTF or KRT13 (Figure 1F) among a host of genes previously linked to prostate inflammatory atrophy (PIA) [13, 19-22] and club/hillock cells [2], suggesting a potential intermediate epithelial state. Differential expression analysis highlighted unique gene signatures for these intermediate cells, including LTF, LCN2, OLFM4, MMP7, and KRT13 (Figure 1G).
WIF1+ basal cells are enriched in human prostate transition zone
Recent studies have highlighted some zonal differences in basal cells in the human prostate [5, 23]. In this study, our analysis revealed substantial heterogeneity within the basal compartment to add to our understanding of prostate basal cell states/subtypes. In initial UMAP projections, basal cell populations were separated by intermediate epithelial clusters (Figure 1E), suggesting underlying transcriptional diversity and prompting further analysis.
To dissect this heterogeneity, we performed subclustering of only the basal cells and identified four distinct basal subpopulations (Figure 2A). The first, characterized by robust expression of canonical basal markers including KRT5, KRT15, and KRT23, was designated KRT23+ basal cells and exhibited a classical basal gene expression program (Figure 2B, supplementary material, Figure S2). The second, marked by DDIT3, TXNIP, HES1, and MAFB (Figure 2B, supplementary material, Figure S2), displayed a transcriptional program consistent with cellular stress responses and paligenosis [24, 25], likely corresponding to the previously reported PLCG2+/c3 basal population [7]. The third, a minor population defined by FOXI1 and vacuolar-type H+-ATPase subunits, resembled previously reported ionocyte-like basal cells (Figure 2B; supplementary material, Figure S2) [7].
Figure 2.
Notably, a fourth basal subpopulation exhibited high expression of WIF1, VCAN, PPP1R14C, NPPC, and SFRP1 (Figure 2B; supplementary material, Figure S2), and closely resembled the previously reported Basal-5-VCAN subtype [6]. To further assess the specificity of these genes, we examined their expression across all prostate cell types. While VCAN and SFRP1 were also expressed in fibroblasts, WIF1 expression was exclusive and significantly enriched in this basal subtype (Figure 2C). Based on the specificity, we designated this novel population as the WIF1+ basal cell subtype.
To determine whether basal subtypes displayed zonal preferences, we quantified their relative abundance across all samples. Strikingly, the WIF1+ basal subtype showed strong enrichment in the TZ (Figure 2A,D).
To validate this striking zonal selectivity of the WIF1+ basal cell subtype, we performed CISH for TP63, a canonical basal marker, and WIF1 on prostatectomy specimens from multiple zones. Co-localization of TP63 and WIF1 confirmed that WIF1 expression was largely restricted to TP63+ basal epithelial cells in the TZ, supporting the classification of WIF1+ cells as a distinct basal subtype. Notably, TP63+WIF1+ basal cells were markedly enriched in the TZ, with nearly absent WIF1 expression observed in basal cells of the PZ or CZ. Rare WIF1-expressing cells located in the stromal compartment were also observed, mostly in the PZ and CZ (Figure 2E; supplementary material, Figure S3).
To further validate the molecular features of the WIF1+ basal cell subtype, we performed CISH for VCAN and WIF1 on the same prostatectomy specimens. Consistent with the scRNA-seq analysis and the expression patterns shown in Figure 2C, co-expression of VCAN and WIF1 was observed in basal cells within the TZ glands. In addition, VCAN expression was also detected in stromal fibroblast-like cells in both the TZ and PZ (supplementary material, Figure S4). These findings further support the existence of this distinct WIF1+VCAN+ basal cell population enriched in the TZ while demonstrating that VCAN expression alone is not specific to this epithelial subtype.
We next examined whether this basal subtype exists in the mouse prostate. Intriguingly, Wif1 was not expressed in any mouse basal epithelial cells. Instead, high expression was detected in a subset of fibroblasts (supplementary material, Figure S5), corresponding to the ductal fibroblast population previously described by Joseph et al [4] and subglandular fibroblast by our previous study, characterized by expression of Rorb [26]. These findings indicate that the WIF1+ basal cell subtype is absent in mouse prostate.
EMT, stromal remodeling, and immune modulation pathways are upregulated in WIF1+ basal cells
Differential gene expression among the four basal subtypes revealed 104 genes uniquely upregulated in WIF1+ basal cells compared with all other basal cell subtypes (Figure 3A; supplementary material, Table S1). To explore the biological functions of this basal subtype, we performed pathway analysis using Hallmark and Gene Ontology Biological Process (GOBP) terms from MSigDB. WIF1+ basal cells were most significantly enriched for the Hallmark epithelial-mesenchymal transition (EMT) pathway, along with angiogenesis, androgen response, coagulation, and apical junction gene sets, suggesting a specialized role in tissue remodeling and zonal dynamics (Figure 3B). Gene ontology (GO) analysis further implicated this subtype in prostate gland development and morphogenesis (Figure 3C).
Figure 3.
To complement these findings, we computationally inferred the activation and inhibition states of pathways and upstream regulators in WIF1+ basal cells compared with all other basal subtypes using IPA. The top activated pathways included extracellular matrix organization, collagen biosynthesis and modifying enzymes, collagen chain trimerization (Figure 3D; supplementary material, Table S2), suggesting a potential role for WIF1+ basal cells in extracellular matrix and basement membrane remodeling and glandular tissue architecture support. Based on these observations, we speculated that these WIF1+ basal cells may have activated tissue-structural programs.
In contrast, immune-associated pathways such as phagosome formation, neutrophil degranulation, and S100 family signaling were predicted to be inhibited in WIF1+ basal cells. Likewise, the top inhibited upstream regulators of WIF1+ basal cells included IFNG, IL1B, NFKB1, and TNF, while the top activated regulators included several anti-inflammatory cytokines, such as IL10RA, IL4R (Figure 3E; supplementary material, Table S3). Collectively, these analyses suggested an immunomodulatory role for WIF1+ basal cells within the transition zone microenvironment. Based on these observations, we speculated that these WIF1+ basal cells may have inhibited immunogenic programs.
To investigate potential intercellular communication, we applied ligand–receptor interaction analysis across all cell types in the human prostate. Notably, NRG (neuregulin) signaling was inferred to occur exclusively from WIF1+ basal cells to other epithelial populations (Figure 3F). A chord diagram visualized the directionality and strength of the interaction, revealing that WIF1+ basal cells act as a unique ligand source, while luminal, intermediate, and FOXI1+ basal cells serve as target populations. Among these, luminal cells exhibited the strongest inferred interaction.
Looking into the ligand–receptor pair in NRG signaling, NRG1 produced by WIF1+ basal cells was predicted to interact with ERBB2/ERBB3 receptors on luminal cells (Figure 3G). To validate this observation spatially, we performed CISH on transition zone tissue from the same prostatectomy specimens. Co-localization of NRG1 and WIF1 confirmed that NRG1 is expressed within WIF1+ basal cells (Figure 3H). Given that NRG–ERBB signaling plays a key role in epithelial morphogenesis and homeostasis [27], these findings suggest that WIF1+ basal cells may serve as the regulator of epithelial maintenance and differentiation within the transition zone niche.
In addition, WIF1+ basal cells were inferred to secrete multiple extracellular matrix components, including LAMC1, LAMC2, LAMB3, and TNC, which were predicted ligands interacting with integrin receptors expressed on both epithelial and stromal cells (supplementary material, Figure S6). These predicted interactions further support a potential role for WIF1+ basal cells in epithelial-stromal crosstalk and microenvironmental remodeling.
WIF1+ basal cells are enriched in BPH
Given the enrichment of WIF1+ basal cells in the transition zone and involvement in pathways such as EMT [12], androgen response [8], and stromal remodeling [10], we hypothesized that this basal subtype may be involved in the pathogenesis of benign prostatic hyperplasia (BPH).
To test this, we analyzed a previously published single-cell RNA-seq dataset [4], which included three BPH glandular samples (GSM5252126, GSM5252128, GSM5252130), and six normal prostate donor samples (GSM5252457, GSM5252459, GSM5252461, GSM5252458, GSM5252460, GSM5252462). Dimensionality reduction and clustering of this dataset revealed clear segregation by canonical cell types (Figure 4A). Upon subsetting basal epithelial cells, we identified the same four transcriptionally distinct basal subtypes described in our dataset, marked by KRT23, DDIT3, WIF1, and FOXI1, respectively (Figure 4B,C). The WIF1+ basal cells from this dataset exhibited a highly similar gene signature to that in our prostatectomy samples, including expression of WIF1, VCAN, NPPC, and PPP1R14C (supplementary material, Figure S7), strongly supporting the identity of this population as the same cell type.
Figure 4.
We next quantified the relative abundance of basal subtypes across BPH tissues and those from normal TZ samples from organ donors. The proportion of WIF1+ basal cells was significantly elevated in BPH tissues compared to organ donor TZ (Figure 4D,E).
Next, we analyzed three BPH stromal nodule samples (GSM5252127, GSM5252129, GSM5252131) from the same study [4]. Using canonical marker genes, we identified major prostate cell types within the stromal nodules. In this dataset, epithelial cells represented only a small fraction compared to stromal populations such as fibroblasts and smooth muscle cells. Notably, within the epithelial compartment, a significant fraction of basal cells expressed WIF1 (supplementary material, Figure S8).
To confirm this observation at the tissue level, we performed CISH on BPH samples obtained via transurethral resection of the prostate (TURP; n = 2 subjects, ages 66 and 71 years), alongside TZ tissues from young organ donors from JHU (n = 2, ages 21 and 25 years). Co-staining for TP63 and WIF1 confirmed the identity of WIF1+ basal cells, and these cells were significantly abundant in BPH specimens (Figure 4F,G; supplementary material, Figure S9).
Notably, we observed spatial variation in WIF1 expression relative to inflammatory status. Basal cells within BPH nodules lacking prominent inflammatory infiltrates exhibited more consistent and stronger WIF1 expression. In contrast, glands located in regions with marked chronic inflammation or adjacent inflammatory infiltrates contained fewer WIF1+ basal cells, suggesting a potential association between WIF1+ basal cell and inflammatory modulation (supplementary material, Figure S10).
To further validate this enrichment of WIF1+ basal cells in BPH, we analyzed previously published bulk RNA-seq data from BPH and normal prostate tissues [28]. Several WIF1+ basal cell-associated genes, including WIF1, NPPC, and VCAN, were among the most significantly upregulated genes reported in that study when comparing BPH with normal prostate (supplementary material, Figure S11). To further assess the potential contribution of age as a confounding factor, we performed differential expression analysis using DESeq2 with and without age adjustment and observed highly consistent results across both analyses (supplementary material, Figure S12). Using our scRNA-seq dataset as a reference, robust cell type decomposition (RCTD) analysis further confirmed a significant enrichment of WIF1+ basal cells in BPH samples relative to both normal prostate and BPH stromal nodule samples (Figure 4H; supplementary material, Figure S11).
WIF1+ basal-associated genes are upregulated in BPH
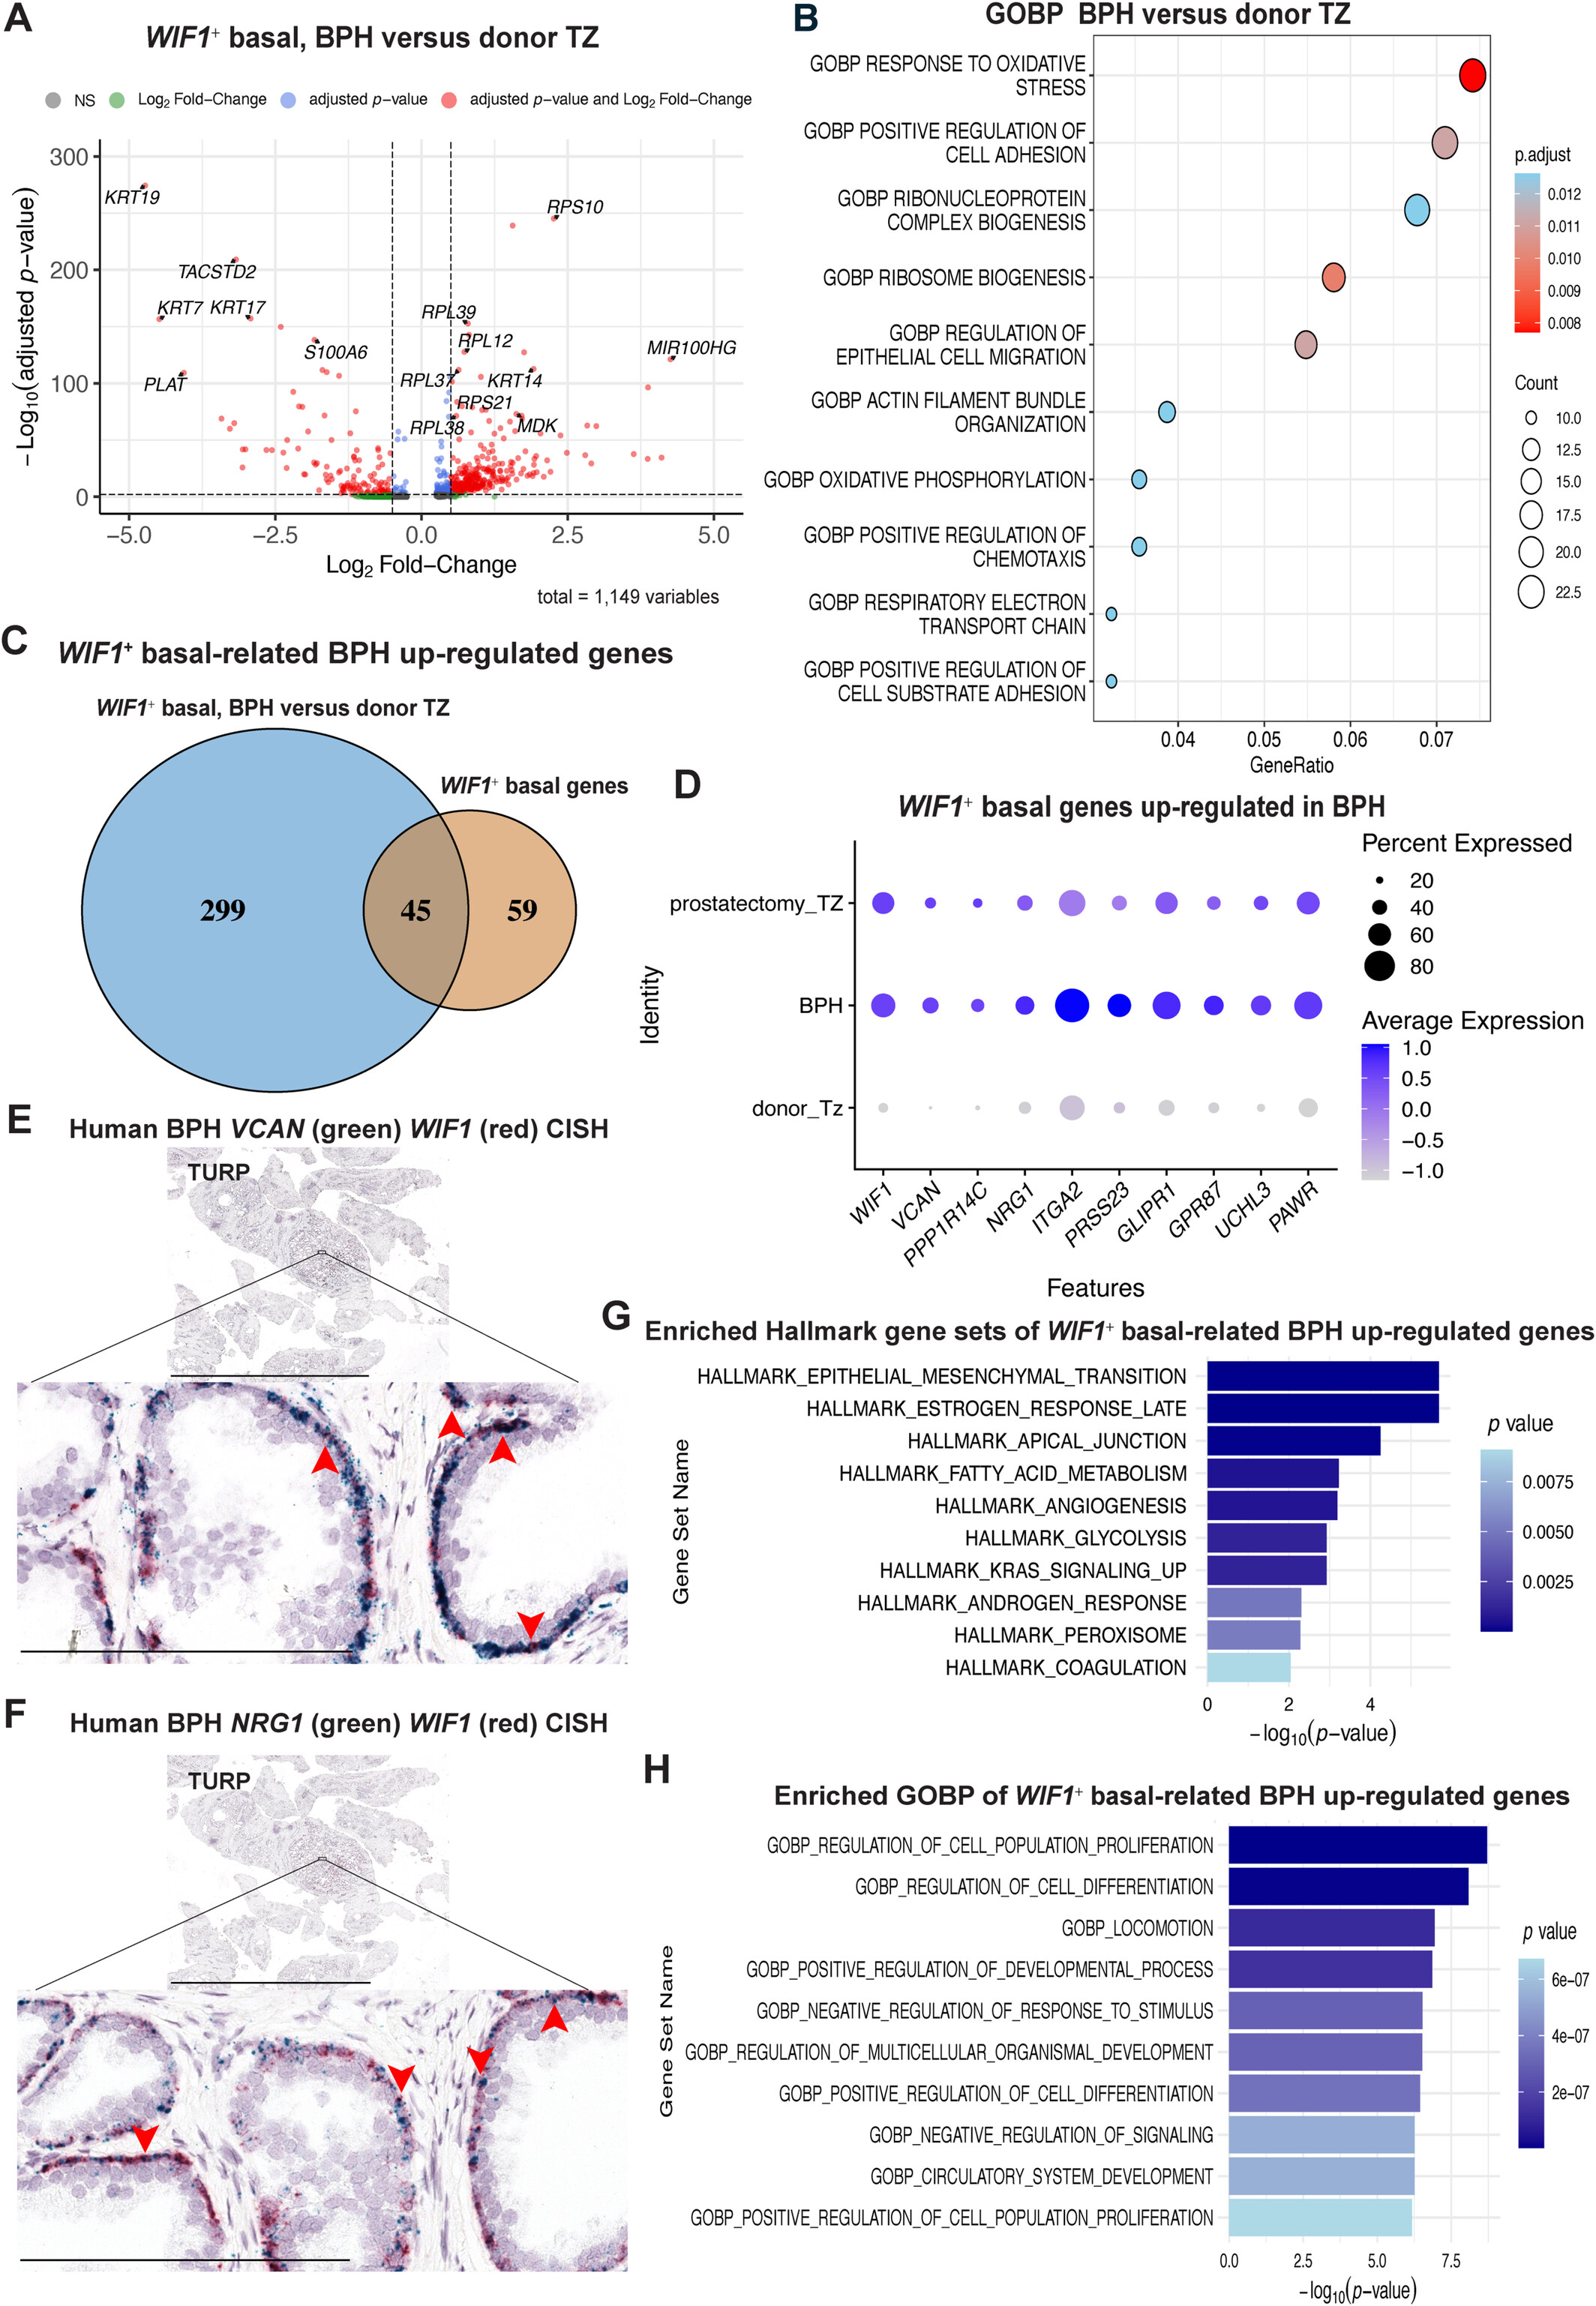
To determine whether WIF1+ basal cells undergo transcriptional changes in BPH, we compared their transcriptomes in BPH and normal TZ from organ donors using the previously published single cell sequencing dataset [4]. A large number of ribosomal genes, including RPS10, RPS29, RPL39, RPL12, were significantly upregulated in WIF1+ basal cells from BPH compared to those from normal TZ (Figure 5A; supplementary material, Table S4). Gene ontology (GO) analysis of the DEGs revealed strong enrichment of pathways involved in ribosomal biogenesis (Figure 5B), suggesting elevated biosynthetic activity in these cells during BPH development. Oxidative stress response pathways and cell adhesion pathways were also upregulated.
Figure 5.
To pinpoint genes associated with both cell identity and disease, we intersected DEGs from two comparisons: (1) WIF1+ basal versus other basal subtypes (current study), and (2) BPH versus donor TZ from WIF1+ basal cell (derived from Joseph et al [4]). This yielded 45 overlapping upregulated genes, that we refer to as ‘WIF1+ basal-related BPH up-regulated genes’ (Figure 5C; supplementary material, Table S5). Among these, the most significantly elevated genes included WIF1, VCAN, PPP1R14C, NRG1, ITGA2, PRSS23, GLIPR1, GPR87, UCHL3, and PAWR (Figure 5D).
Several of these genes are key components of the WIF1+ basal cell signature and were also upregulated in BPH, supporting their potential relevance in disease pathology. For example, upregulation of WIF1, a known WNT signaling inhibitor [29], and VCAN, a major extracellular matrix (ECM) proteoglycan, suggested a role in modulating epithelial-stromal signaling and extracellular matrix remodeling [30]. PPP1R14C, a regulatory inhibitor of protein phosphatase 1 may contribute to cytoskeletal or contractile regulation [31]. Notably, NRG1, which was predicted to signal from WIF1+ basal cells to ERBB2/ERBB3 receptors on neighboring epithelial cells, was also elevated in BPH, suggesting a potential paracrine signaling role.
We next performed CISH for VCAN and NRG1 on BPH specimens. Both genes exhibited spatial expression patterns consistent with WIF1+ basal cells, with clear localization to the basal layer across these tissues (Figure 5E,F), supporting their involvement within the WIF1+ basal cell program in BPH.
Other genes, such as PRSS23 (a serine protease that cleaves peptide bonds in proteins) [32], GPR87 (encodes a G protein-coupled receptor), found to contribute to fibrosis [33], and UCHL3 (ubiquitin C-terminal hydrolase L3), a protein that plays a crucial role in cellular processes by removing ubiquitin from other proteins [34], further suggested involvement in cell proliferation and epithelial-stromal remodeling. Notably, these genes displayed a graded expression pattern across conditions, with the highest levels observed in BPH, the lowest in the donor TZ, and intermediate levels in TZ samples from prostatectomy (Figure 5D), many of which showed evidence of nodular hyperplasia consistent with BPH (supplementary material, Figure S3).
To further validate the association of WIF1+ basal cells with BPH, we analyzed an independent publicly available single-cell RNA-seq dataset (GSE226237, Cao et al [35]), comprising BPH samples stratified by prostate gland volume. Reanalysis of this cohort identified WIF1+ basal cell as a major basal cell subpopulation across samples. Notably, expression levels of WIF1 and its associated genes were elevated in basal cells from large-volume BPH compared with small-volume BPH (supplementary material, Figure S13).
Pathway enrichment analysis of WIF1+ basal-related BPH up-regulated genes revealed activation of ‘epithelial-mesenchymal transition (EMT)’, along with ‘estrogen response’, ‘apical junction’, and ‘angiogenesis’ pathways (Figure 5G), indicating potential epithelial-mesenchymal transition, hormonal sensitivity, and stromal activity. GOBP terms such as cell proliferation, cell differentiation, and cell locomotion were also significantly enriched (Figure 5H). Taken together, we speculated that TZ enriched WIF1+ basal cells may play an active role in BPH pathogenesis by participating in remodeling of the prostate epithelium and stroma.
Discussion
Human prostate epithelium comprises four principal cell types: luminal, basal, intermediate, and a small population of neuroendocrine epithelial cells. Among these, subtypes within the basal cell compartment have been rarely characterized in the literature. In this study, we identified WIF1+ basal cells as a transcriptionally and anatomically distinct subpopulation compared to other basal epithelial cells. These cells display a unique gene expression profile enriched for WIF1, VCAN, PPP1R14C, and NRG1, consistent with the Basal-VCAN cell type described by Hu et al [6]. While Hu et al reported that this cell type is predominantly located in both the peripheral and transition zones [6], our scRNA-seq data and CISH staining demonstrated that WIF1+ basal cells are markedly enriched in the TZ of the human prostate.
Among the upregulated genes, WIF1 emerged as the most prominent marker of this population. Pathway and Gene Ontology analyses revealed enrichment of ‘androgen response’ (HALLMARK pathway), and ‘gland development and morphogenesis’ (GO pathway), consistent with a prior study showing that WIF1 is androgen-regulated and contributes to prostate gland development [36]. Functionally, WIF1 is known to act as a secreted antagonist of Wnt signaling, a pathway that plays a central role in cell proliferation and carcinogenesis [37-47]. In addition to WIF1, two other classes of secreted Wnt antagonists have been described: the secreted Frizzled-related protein (sFRP) family [48] and the Dickkopf (Dkk) family [49]. Notably, in our dataset, both SFRP1 and DKK3 were also highly expressed in WIF1+ basal cells (supplementary material, Table S1). The combined high expression of WIF1, SFRP1, and DKK3 in the basal layer of the TZ may establish a localized Wnt signaling gradient, limiting the ability of stromal Wnt ligands to activate epithelial receptors [50].
Furthermore, IPA analyses revealed that inflammation-related pathways were suppressed in WIF1+ basal cells relative to other basal populations. Together, these findings lead us to speculate that WIF1+ basal cells in the TZ help create an epithelial microenvironment characterized by attenuated WNT activation and reduced inflammation, potentially preserving epithelial homeostasis and contributing to the relatively low incidence of prostate cancer initiation in the TZ. This hypothesis warrants further mechanistic investigation.
BPH is a highly prevalent age-associated condition characterized by epithelial and stromal hyperplasia, predominantly in the TZ of the prostate [51]. Analysis of publicly available datasets, combined with CISH staining of BPH tissues from TURP, revealed an enrichment of WIF1+ basal cells in BPH. Furthermore, the gene signature of WIF1+ basal cells was distinctly altered in BPH compared with donor TZ, suggesting that this TZ-enriched population may contribute to BPH pathogenesis.
Among the top differentially expressed genes in WIF1+ basal cells, VCAN, encoding the extracellular matrix (ECM) component versican, points to active involvement in ECM remodeling. Its expression in WIF1+ basal cells was also confirmed by CISH. Versican has been shown to promote fibroblast activation and myofibroblast-like phenotypes [52, 53], potentially driving the fibromuscular expansion characteristic of BPH. Pathway enrichment analysis identified EMT as the most significant hallmark pathway in WIF1+ basal cells. EMT, a process by which epithelial cells acquire mesenchymal features, underlies tissue plasticity, regeneration, and fibrosis [54]. Its activation in WIF1+ basal cells aligns with previous evidence implicating EMT in BPH etiology [12].
NRG1, another gene differentially expressed in WIF1+ basal cells and enriched in BPH, is known to activate ERBB2/3 receptors on neighboring epithelial cells, thereby stimulating proliferation and survival [55]. Its role in promoting epithelial regeneration has been demonstrated in the intestinal stem cell niche [56]. Our cell–cell communication analysis inferred that NRG signaling occurs exclusively between WIF1+ basal cells and other epithelial cells, particularly luminal cells. CISH further confirmed NRG1 expression within WIF1+ basal cells in both prostatectomy and BPH TURP specimens. We propose that WIF1+ basal cells may secrete NRG1 to regulate adjacent luminal epithelium, establishing a paracrine loop that promotes epithelial development in BPH. Interestingly, previous studies have reported fibroblast secretion of NRG1, which then interacts with EGFR and ERBB3 receptors on epithelial cells [4, 6].
Interestingly, our findings suggest that WIF1+ basal cells may exhibit context-dependent functions within the TZ microenvironment. These cells express multiple Wnt antagonists, including WIF1, SFRP1, and DKK3, and display relative suppression of inflammatory pathways, supporting a potential role in epithelial homeostasis. Conversely, WIF1+ basal cells also express factors associated with tissue remodeling and proliferation, including NRG1 and VCAN, and are enriched for EMT, extracellular matrix organization, angiogenesis, and proliferative pathways in BPH. CISH further confirmed co-expression of WIF1, NRG1, and VCAN within the same basal cell population. Together, these findings suggest that WIF1+ basal cells may coordinate both homeostatic and remodeling programs depending on physiological or disease context. Similar context-dependent behavior has been described for androgen receptor signaling in the prostate [57]. Further functional studies will be required to define the relative contribution and temporal dynamics of these pathways in BPH pathogenesis.
Our scRNA-seq data further demonstrated that Wif1 is not expressed by basal cells in the mouse prostate but instead marks a subset of fibroblasts, termed Rorb+ subglandular fibroblasts [26]. This raises the possibility that WIF1+ basal cells exhibit mesenchymal-like characteristics. In a previous study, Alonso-Magdalena et al concluded that BPH stroma can arise from epithelium through EMT, a process in which epithelial cells lose their polarity and basement membrane attachment while acquiring mesenchymal features [12]. Whether WIF1+ basal cells enriched in TZ and BPH represent an intermediate state between basal epithelial and mesenchymal cells warrants further investigation.
The identification of WIF1+ basal cells may also have implications for zone-specific susceptibility. We observed that WIF1+ basal cells were consistently enriched in the TZ across both organ donor samples and BPH TURP specimens, despite differences in patient age between these cohorts. To further address potential age-related confounding, we reanalyzed the bulk RNA-seq dataset from Middleton et al using DESeq2 with and without age adjustment and observed highly concordant results between both analyses. Although we cannot fully exclude the contribution of age-related effects, and it remains possible that the functional activity of WIF1+ basal cells may increase with aging, their preferential localization to the TZ appears to be a robust feature.
Functionally, WIF1+ basal cells in the TZ may contribute to a microenvironment that supports EMT, cellular proliferation, extracellular matrix organization, and angiogenesis. In contrast, the PZ and CZ may lack this WIF1+ basal cell-mediated niche. Together, these findings suggest that the enrichment of WIF1+ basal cells within the TZ may represent a key cellular determinant underlying the preferential development of BPH within this anatomical region.
A key limitation of our study is the absence of direct functional experiments to validate the inferred roles of WIF1+ basal cells in BPH pathogenesis. Although our single-cell transcriptomic analysis, pathway enrichment results, and histological validation collectively support their involvement in EMT activation, extracellular matrix remodeling, cell proliferation, and modulation of WNT signaling, these conclusions remain correlative. Without functional assays, such as lineage tracing, in vitro co-culture systems, or in vivo animal models, it remains uncertain whether WIF1+ basal cells are causal drivers or secondary responders in the observed tissue remodeling. Future studies integrating targeted manipulation of WIF1 expression or depletion of this basal cell population will be essential to establish causality and delineate their precise mechanistic contributions to BPH development. Spatial transcriptomic approaches will also be crucial for mapping their interactions with stromal, immune, and vascular components in situ.
Acknowledgements
We thank the members of the Sidney Kimmel Comprehensive Cancer Center's Experimental and Computational Genomics Core, supported by Cancer Center Support Grant P30CA006973 (WGN, SY), for support with the single-cell sequencing studies and data pre-processing and analysis. This work was supported in part by NIH/NCI grants P50CA058236 (WGN, SY, AMD), U01CA196390 (AMD, SY), P01CA247886 (SY), U54CA274370 (AMD, SY), P50CA180995 (CEP awarded to MKG), and by the Prostate Cancer Foundation (SY), The Allegheny Health Network Johns Hopkins Pilot Project Grant (SY), The Patrick C. Walsh Fund (SY), The Irving Hansen Foundation (SY), The Commonwealth Foundation (SY), and the Maryland Cigarette Restitution Fund (SY).
Author contributions statement
RW, AMD and SY were responsible for conceptualization. RW, QZ, AMD and SY designed and performed the methodology. QZ, AMD and SY performed and analyzed validation experiments. RW, AMD and SY performed data analysis. WGN, AMD and SY provided resources and acquired funding; RW, AG, YZ, KS, JM, AS, DH and SY carried out data curation. RW and SY wrote the original manuscript draft; AMD and SY supervised the study. All authors contributed to editing and approval of the manuscript.
Data availability statement
We additionally processed scRNA-seq data of human normal and BPH tissues by Joseph DB et al [4]. Three datasets of BPH glandular samples (GSM5252126, GSM5252128, GSM5252130), BPH stromal samples (GSM5252127, GSM5252129, GSM5252131), and six datasets of young organ donor samples (GSM5252457, GSM5252459, GSM5252461, GSM5252458, GSM5252460, GSM5252462) were obtained from the GEO database under accession code GSE172357 (https://www.ncbi.nlm.nih.gov/geo/query/acc.cgi?acc=GSE172357). We processed the data using a similar strategy described above to filter low-quality cells, integrate and cluster cells. The cell type was then identified, and differential gene expression analysis was performed among cell types.
We additionally analyzed an independent publicly available single cell RNA-seq dataset of BPH samples stratified by prostate gland volume from Cao et al [35]. Three large BPH samples (GSM7068696, GSM7068697, GSM7068698), and three small BPH samples (GSM7068699, GSM7068700, GSM7068701) were obtained from the GEO database under accession code GSE226237 (https://www.ncbi.nlm.nih.gov/geo/query/acc.cgi?acc=GSE226237). We processed the data using a similar strategy described above to filter low-quality cells, integrate and cluster cells. Cell types were subsequently annotated, followed by differential gene expression analysis across cell types and between the large and small BPH groups.
Bulk RNA-seq dataset of BPH, BPH stromal nodules, and normal prostate from Middleton et al [28] were obtained from the dbGAP database (https://dbgap.ncbi.nlm.nih.gov/home/), with accession number phs001698.v1.p1. Controlled-access data were downloaded following approved dbGaP data access authorization and reanalyzed in this study. DESeq2 with and without age adjustment were applied to identify DEGs between BPH and normal prostate. RCTD [58] was applied to deconvolute cell types in the bulk RNA-seq data using our human prostatectomy single cell RNA-seq dataset as reference.
The mouse prostate data were from Graham MK et al [26], and were deposited in the NCBI GEO database under accession code GSE228945 (https://www.ncbi.nlm.nih.gov/geo/query/acc.cgi?acc=GSE228945).
The human prostatectomy data generated in this study have been deposited in the NCBI dbGaP database under accession code phs003480.v2.p1 (https://dbgap.ncbi.nlm.nih.gov/beta/search/?OBJ=study&TERM=phs003480).
Supporting Information
| Filename | Description |
|---|---|
| path70117-sup-0001-FiguresS1-S13.docxWord 2007 document , 22.2 MB | Figure S1. Expression of canonical marker genes across human prostate cell populations Figure S2. Differentially expressed genes defining prostate basal cell subtypes Figure S3. Enrichment of WIF1+ basal cells in the human prostate transition zone Figure S4. VCAN is expressed in WIF1+ basal cells Figure S5. Wif1 expression is restricted to a subset of mouse prostate fibroblast Figure S6. Ligand-receptor interactions involving WIF1+ basal cells Figure S7. Differentially expressed genes defining basal cell subtypes in benign prostatic hyperplasia (BPH) and organ donor prostate samples Figure S8. WIF1+ basal cells represent a major basal cell subtype in benign prostatic hyperplasia (BPH) stromal nodule sample Figure S9. WIF1+ basal cell is enriched in benign prostatic hyperplasia (BPH) Figure S10. Spatial association between WIF1+ basal cell and inflammation Figure S11. Enrichment of WIF1+ basal cells in benign prostatic hyperplasia (BPH) revealed by bulk RNA-seq deconvolution analysis Figure S12. Differential expression analysis of benign prostatic hyperplasia (BPH) bulk RNA-seq data with and without age adjustment Figure S13. Upregulation of WIF1+ basal cell associated genes in large-volume benign prostatic hyperplasia (BPH) |
| path70117-sup-0002-TablesS1-S5.xlsExcel spreadsheet, 227.5 KB | Table S1. Genes with significantly increased expression in WIF1+ basal versus other basal cell subtypes (p_val_adj < 0.05 and avg_log2FC > 0.5) Table S2. Ingenuity pathway analysis (IPA) of pathways in WIF1+ basal versus other basal cell subtypes (DEGs with p_val_adj < 0.01 and log2FC > 1) Table S3. Ingenuity pathway analysis (IPA) of upstream regulators in WIF1+ basal versus other basal cell subtypes (DEGs with p_val_adj < 0.01 and log2FC > 1) Table S4. Genes with significantly increased expression in WIF1+ basal, BPH versus donor TZ (p_val_adj < 0.05 and avg_log2FC > 0.5) Table S5. Overlapping genes from two comparisons—WIF1+ basal related BPH up-regulated genes |
Please note: The publisher is not responsible for the content or functionality of any supporting information supplied by the authors. Any queries (other than missing content) should be directed to the corresponding author for the article.
References
- 1Sellers J, Horne SNS, de Riese WTW. The origin of BPH and prostate cancer in different prostate zones and the impact on the incidence of prostate cancer: a systematic review and update of the literature for urologists and clinicians. Explor Res Hypothesis Med 2024; 9: 44–51.
10.14218/ERHM.2022.00120Google Scholar
- 2Henry GH, Malewska A, Joseph DB, et al. A cellular anatomy of the normal adult human prostate and prostatic urethra. Cell Rep 2018; 25: 3530–3542.e5.
- 3Yan Q, Wang M, Xia H, et al. Single-cell RNA-sequencing technology demonstrates the heterogeneity between aged prostate peripheral and transitional zone. Clin Transl Med 2022; 12: e1084.
- 4Joseph DB, Henry GH, Malewska A, et al. Single-cell analysis of mouse and human prostate reveals novel fibroblasts with specialized distribution and microenvironment interactions. J Pathol 2021; 255: 141–154.
- 5Vellky JE, Wu Y, Moline D, et al. Single-cell RNA sequencing of human prostate basal epithelial cells reveals zone-specific cellular populations and gene expression signatures. J Pathol 2024; 262: 212–225.
- 6Hu J, Liu F, Zhang J, et al. Spatially resolved transcriptomic analysis of the adult human prostate. Nat Genet 2025; 57: 922–933.
- 7Apostolov E, Roden DL, Holliday H, et al. Profiling of epithelial functional states and fibroblast phenotypes in hormone therapy-naive localised prostate cancer. Cancer Res 2026; 86: 1836–1853.
- 8Bartsch G, Rittmaster RS, Klocker H. Dihydrotestosterone and the concept of 5alpha-reductase inhibition in human benign prostatic hyperplasia. World J Urol 2002; 19: 413–425.
- 9Kramer G, Mitteregger D, Marberger M. Is benign prostatic hyperplasia (BPH) an immune inflammatory disease? Eur Urol 2007; 51: 1202–1216.
- 10Wu Q, Shi J, Chen L, et al. Regulation of proliferation and differentiation of prostatic stromal cells by oestradiol through prostatic epithelial cells in a paracrine manner. BJU Int 2008; 101: 497–502.
- 11Hammarsten J, Damber J-E, Karlsson M, et al. Insulin and free oestradiol are independent risk factors for benign prostatic hyperplasia. Prostate Cancer Prostatic Dis 2009; 12: 160–165.
- 12Alonso-Magdalena P, Brössner C, Reiner A, et al. A role for epithelial-mesenchymal transition in the etiology of benign prostatic hyperplasia. Proc Natl Acad Sci U S A 2009; 106: 2859–2863.
- 13Graham MK, Wang R, Chikarmane R, et al. Convergent alterations in the tumor microenvironment of MYC-driven human and murine prostate cancer. Nat Commun 2024; 15: 7414.
- 14Stuart T, Butler A, Hoffman P, et al. Comprehensive integration of single-cell data. Cell 2019; 177: 1888–1902.e21.
- 15Bhuva D, Smyth G, Garnham A. Msigdb: An ExperimentHub Package for the Molecular Signatures Database (MSigDB). Bioconductor: Boston, MA, 2025.
- 16Xu S, Hu E, Cai Y, et al. Using clusterProfiler to characterize multiomics data. Nat Protoc 2024; 19: 3292–3320.
- 17Krämer A, Green J, Pollard J Jr, et al. Causal analysis approaches in ingenuity pathway analysis. Bioinformatics 2014; 30: 523–530.
- 18Jin S, Guerrero-Juarez CF, Zhang L, et al. Inference and analysis of cell-cell communication using CellChat. Nat Commun 2021; 12: 1088.
- 19De Marzo AM, Marchi VL, Epstein JI, et al. Proliferative inflammatory atrophy of the prostate: implications for prostatic carcinogenesis. Am J Pathol 1999; 155: 1985–1992.
- 20Leenders GJLH, Gage WR, Hicks JL, et al. Intermediate cells in human prostate epithelium are enriched in proliferative inflammatory atrophy. Am J Pathol 2003; 162: 1529–1537.
- 21De Marzo AM, Platz EA, Sutcliffe S, et al. Inflammation in prostate carcinogenesis. Nat Rev Cancer 2007; 7: 256–269.
- 22Porter CM, Haffner MC, Kulac I, et al. Lactoferrin CpG island hypermethylation and decoupling of mRNA and protein expression in the early stages of prostate carcinogenesis. Am J Pathol 2019; 189: 2311–2322.
- 23Garcia FU, Haber MM, Chen X. Prostatic basal cells in the peripheral and transitional zones: zonal variation in morphology and in immunophenotype. Prostate 2007; 67: 1686–1692.
- 24Radyk MD, Spatz LB, Peña BL, et al. ATF3 induces RAB7 to govern autodegradation in paligenosis, a conserved cell plasticity program. EMBO Rep 2021; 22: e51806.
- 25Brown JW, Cho CJ, Mills JC. Paligenosis: cellular remodeling during tissue repair. Annu Rev Physiol 2022; 84: 461–483.
- 26Graham MK, Chikarmane R, Wang R, et al. Single-cell atlas of epithelial and stromal cell heterogeneity by lobe and strain in the mouse prostate. Prostate 2023; 83: 286–303.
- 27Wansbury O, Panchal H, James M, et al. Dynamic expression of Erbb pathway members during early mammary gland morphogenesis. J Invest Dermatol 2008; 128: 1009–1021.
- 28Middleton LW, Shen Z, Varma S, et al. Genomic analysis of benign prostatic hyperplasia implicates cellular re-landscaping in disease pathogenesis. JCI Insight 2019; 5: e129749.
- 29Poggi L, Casarosa S, Carl M. An eye on the Wnt inhibitory factor Wif1. Front Cell Dev Biol 2018; 6: 167.
- 30Islam S, Watanabe H. Versican: a dynamic regulator of the extracellular matrix. J Histochem Cytochem 2020; 68: 763–775.
- 31Liu Q-R, Zhang P-W, Zhen Q, et al. KEPI, a PKC-dependent protein phosphatase 1 inhibitor regulated by morphine. J Biol Chem 2002; 277: 13312–13320.
- 32Schulten H-J. Reviewing the developing significance of the serine protease PRSS23. Front Biosci (Landmark Ed) 2025; 30: 27294.
- 33Cui X, Shi E, Li J, et al. GPR87 promotes renal tubulointerstitial fibrosis by accelerating glycolysis and mitochondrial injury. Free Radic Biol Med 2022; 189: 58–70.
- 34Liu J, Hu S, Xiao J, et al. UCHL3: a crucial deubiquitinase in DNA damage repair and tumor progression. Cancer Cell Int 2025; 25: 276.
- 35Cao T, Xie F, Shi Y, et al. Rapamycin and low-dose IL-2 mediate an immunosuppressive microenvironment to inhibit benign prostatic hyperplasia. Int J Biol Sci 2023; 19: 3441–3455.
- 36Keil KP, Mehta V, Branam AM, et al. Wnt inhibitory factor 1 (Wif1) is regulated by androgens and enhances androgen-dependent prostate development. Endocrinology 2012; 153: 6091–6103.
- 37Wang J, Wynshaw-Boris A. The canonical Wnt pathway in early mammalian embryogenesis and stem cell maintenance/differentiation. Curr Opin Genet Dev 2004; 14: 533–539.
- 38Alicea-Delgado M, García-Arrarás JE. Wnt/β-catenin signaling pathway regulates cell proliferation but not muscle dedifferentiation nor apoptosis during sea cucumber intestinal regeneration. Dev Biol 2021; 480: 105–113.
- 39Luis TC, Ichii M, Brugman MH, et al. Wnt signaling strength regulates normal hematopoiesis and its deregulation is involved in leukemia development. Leukemia 2012; 26: 414–421.
- 40Clevers H, Nusse R. Wnt/β-catenin signaling and disease. Cell 2012; 149: 1192–1205.
- 41Liu J, Xiao Q, Xiao J, et al. Wnt/β-catenin signalling: function, biological mechanisms, and therapeutic opportunities. Signal Transduct Target Ther 2022; 7: 3.
- 42Xue C, Chu Q, Shi Q, et al. Wnt signaling pathways in biology and disease: mechanisms and therapeutic advances. Signal Transduct Target Ther 2025; 10: 106.
- 43Song P, Gao Z, Bao Y, et al. Wnt/β-catenin signaling pathway in carcinogenesis and cancer therapy. J Hematol Oncol 2024; 17: 46.
- 44Murillo-Garzón V, Kypta R. WNT signalling in prostate cancer. Nat Rev Urol 2017; 14: 683–696.
- 45Wang C, Chen Q, Xu H. Wnt/β-catenin signal transduction pathway in prostate cancer and associated drug resistance. Discov Oncol 2021; 12: 40.
- 46Wissmann C, Wild PJ, Kaiser S, et al. WIF1, a component of the Wnt pathway, is down-regulated in prostate, breast, lung, and bladder cancer. J Pathol 2003; 201: 204–212.
- 47Yee DS, Tang Y, Li X, et al. The Wnt inhibitory factor 1 restoration in prostate cancer cells was associated with reduced tumor growth, decreased capacity of cell migration and invasion and a reversal of epithelial to mesenchymal transition. Mol Cancer 2010; 9: 162.
- 48Rattner A, Hsieh JC, Smallwood PM, et al. A family of secreted proteins contains homology to the cysteine-rich ligand-binding domain of frizzled receptors. Proc Natl Acad Sci U S A 1997; 94: 2859–2863.
- 49Niehrs C. Function and biological roles of the Dickkopf family of Wnt modulators. Oncogene 2006; 25: 7469–7481.
- 50Wei X, Zhang L, Zhou Z, et al. Spatially restricted stromal Wnt signaling restrains prostate epithelial progenitor growth through direct and indirect mechanisms. Cell Stem Cell 2019; 24: 753–768.e6.
- 51McNeal JE. Origin and evolution of benign prostatic enlargement. Invest Urol 1978; 15: 340–345.
- 52Carthy JM, Meredith AJ, Boroomand S, et al. Versican V1 overexpression induces a myofibroblast-like phenotype in cultured fibroblasts. PLoS One 2015; 10: e0133056.
- 53Wang J, Lv G, Hou W, et al. STAT5/VCAN/PI3K signaling pathway promotes fibroblast activation and lung fibrosis. Cell Signal 2025; 134: 111970.
- 54Kalluri R, Weinberg RA. The basics of epithelial-mesenchymal transition. J Clin Invest 2009; 119: 1420–1428.
- 55Falls DL. Neuregulins: functions, forms, and signaling strategies. Exp Cell Res 2003; 284: 14–30.
- 56Jardé T, Chan WH, Rossello FJ, et al. Mesenchymal niche-derived neuregulin-1 drives intestinal stem cell proliferation and regeneration of damaged epithelium. Cell Stem Cell 2020; 27: 646–662.e7.
- 57Vander Griend DJ, Litvinov IV, Isaacs JT. Conversion of androgen receptor signaling from a growth suppressor in normal prostate epithelial cells to an oncogene in prostate cancer cells involves a gain of function in c-Myc regulation. Int J Biol Sci 2014; 10: 627–642.
- 58Cable DM, Murray E, Zou LS, et al. Robust decomposition of cell type mixtures in spatial transcriptomics. Nat Biotechnol 2022; 40: 517–526.