- 10 例经过全面分子表征的胶质母细胞瘤常规 FFPE 组织均获得蛋白组与磷酸化组数据,EGFR 扩增与非扩增各 5 例。
- 经蛋白丰度校正,443 个磷酸化位点符合探索性差异标准;激酶–底物富集提示 EGFR 与 SRC 家族相关信号协同变化,同时存在显著肿瘤间异质性。
- 这项概念验证研究提供基因组与表观基因组之外的功能信息;个体报告仅供研究,不能据此推断治疗敏感性。
摘要
基于基因组和 DNA 甲基化的分析能够实现稳健的分子诊断与亚分类,改变了中枢神经系统(CNS)肿瘤的分类。然而,这些方法主要界定肿瘤的身份,并不能直接反映细胞内信号网络的功能状态。蛋白组与磷酸化组分析通过测定蛋白丰度及位点特异性磷酸化,提供互补的分子层面信息。近期方法学进展使福尔马林固定石蜡包埋(FFPE)组织的全面分析日益可行,也提出了功能蛋白组信息如何补充现有分子诊断的问题。本研究采用兼容 FFPE 的流程,对 10 例经过全面表征的胶质母细胞瘤进行蛋白组与磷酸化组分析,其中 EGFR 扩增和非扩增肿瘤各 5 例。质谱在所有病例中均获得了稳健的蛋白组与磷酸化组覆盖。全局蛋白组分析揭示了与分组相关的蛋白丰度和通路差异,包括 EGFR 扩增肿瘤中 EGFR 丰度升高,同时也显示肿瘤间存在显著重叠。经蛋白丰度校正的磷酸化组谱同样表现为组间部分分离,但肿瘤间仍有显著重叠。依据预设的探索性统计标准,对校正后磷酸化组数据的差异分析识别出 443 个磷酸化位点。激酶–底物富集进一步显示 EGFR 与 SRC 家族相关信号的协同变化,且不同肿瘤间变异明显。这些结果说明,常规 FFPE 组织在蛋白丰度和磷酸化信号两个层面保留了生物学上连贯的功能信息,可以结合基因组与表观基因组数据加以解读。因此,磷酸化组提供了一个正交的功能层面,可能补充现有 CNS 肿瘤分子表征。
引言
分子诊断与传统组织病理学的整合改变了 CNS 肿瘤分类[11]。基因组测序、拷贝数分析和全基因组 DNA 甲基化分析显著提高了诊断准确性、细化了肿瘤分类体系,并使仅凭形态难以可靠区分、但生物学上不同的肿瘤类型得以识别[4,11,14]。因此,分子诊断已成为界定肿瘤身份、谱系、复发性驱动改变及基因组结构的核心。
尽管取得上述进展,现有分子检测主要表征肿瘤生物学中相对稳定的层面。基因组和表观基因组分析虽能高精度界定分子身份,却不能直接反映细胞内信号通路的功能状态。这可能是迄今这些更精细的诊断在临床实践中影响有限的原因之一。功能后果方面的信息可能有助于填补这一空缺。蛋白丰度与位点特异性磷酸化反映基因组改变、转录后调控及细胞信号的综合后果,因而提供互补信息。蛋白组与磷酸化组分析由此为连接分子分类与通路活性提供机会[13,23]。
FFPE 组织的广泛使用曾是常规病理蛋白组分析的主要障碍。然而,组织处理、磷酸化肽富集及质谱方法的进展已证实,可以从 FFPE 标本中获取全面的蛋白组与磷酸化组信息[7,22,26]。因此,余下的挑战不仅是技术可行性,还包括如何将这些功能性分子信息整合到现有诊断框架,并在基因组和表观基因组已经界定的肿瘤中加以解读。
胶质母细胞瘤适合用于评价这一概念,因为其常规诊断整合了组织病理、基因组、拷贝数和 DNA 甲基化分析,而 EGFR 扩增又是其最常见且生物学上研究充分的基因组改变之一[11,23]。本项概念验证研究并不试图从小队列中发现新的生物标志物或分子亚类,而是探讨:常规 FFPE 组织的蛋白组与磷酸化组分析能否在现有分子诊断之外提供生物学上连贯的功能信息,能否检出 EGFR 扩增已知的信号后果,以及磷酸化组能否揭示超越二元基因组分类的功能异质性。尽管此处以胶质母细胞瘤示范,该框架可能更广泛地适用于 CNS 肿瘤分子表征。
材料与方法
患者样本
从德国海德堡大学医院神经病理科回顾性选择 10 例 IDH 野生型胶质母细胞瘤患者的存档 FFPE 肿瘤材料。所有病例均经过组织学复核,并在诊断流程中完成整合分子表征。队列包括 EGFR 扩增肿瘤 5 例及非扩增肿瘤 5 例;临床与分子特征汇总于补充表 1。选择依据为 FFPE 材料充足、肿瘤含量合适以及分子资料完整,包括全基因组 DNA 甲基化分析和靶向测序。研究获海德堡大学伦理委员会批准(S-318/2022)。分析前对临床和分子数据进行假名化处理。
核酸提取
根据神经病理复核结果,对 FFPE 组织切片中的肿瘤细胞区域进行富集并提取基因组 DNA。按照厂商说明,在自动化 Maxwell RSC 平台(Promega,美国威斯康星州麦迪逊)使用 Maxwell RSC FFPE Plus DNA Kit 提取 DNA。采用 Qubit dsDNA Broad Range Assay Kit(Thermo Fisher Scientific,美国马萨诸塞州沃尔瑟姆)测定 DNA 浓度。提取的 DNA 随后用于全基因组 DNA 甲基化分析和靶向二代测序。
DNA 甲基化谱与拷贝数分析
按照既往描述的标准方案[4],使用 Illumina Infinium MethylationEPIC BeadChip 芯片进行全基因组 DNA 甲基化分析。原始强度数据(IDAT 文件)通过 R 中实现的计算流程处理。预处理包括背景校正、染料偏倚校正、归一化和质量控制评估[4]。采用线性建模方法校正与芯片类型相关的技术变异。采用既有参考数据集和分类算法[18]进行基于 DNA 甲基化的肿瘤分类(海德堡脑肿瘤分类器,12.8 版)。各肿瘤的甲基化类别及相应校准分类器评分见补充表 1。使用 R 的 conumee 包从甲基化芯片数据推导拷贝数改变谱。通过人工检查 log₂ 比值图评估局灶基因组改变,并与测序结果整合。
靶向 DNA 测序
采用定制的富集型 panel 进行靶向二代测序,覆盖 220 个 CNS 肿瘤相关基因的编码外显子及部分内含子区域[17]。按厂商方案构建测序文库,并在 Illumina NovaSeq 6000 平台测序。使用 Burrows–Wheeler Aligner(BWA)将序列读段比对至人参考基因组 GRCh38(hg38)。变异检出包括单核苷酸变异、小片段插入/缺失及部分结构改变,包括基因融合。等位基因频率低于 5% 的变异不进入后续分析。依据美国医学遗传学与基因组学学会(ACMG)指南进行变异解释和致病性评估。
FFPE 组织处理与蛋白提取
使用下述优化的板式流程处理 FFPE 组织并提取蛋白。组织打孔样本随机分配至 Eppendorf twin.tec® PCR Plate 96 LoBind®(Eppendorf,德国汉堡;货号 0030129512)各孔。每份样本在 100 µL 4%(w/v)十二烷基硫酸钠(SDS)中孵育,使用圆顶排盖封板。在每个含样本孔及其上下左右直接相邻孔内放置小圆柱形 Gyuto Beads 2 × 2(PreOmics,货号 P.0.00154)。采用 BeatBox® 组织匀浆仪(PreOmics,德国)以高力度处理 10 min。仪器内交变磁场驱动磁性破碎元件产生机械冲击与剪切力,促进组织及周围石蜡破碎。不进行常规二甲苯脱蜡。
样本接受 4 轮交替机械组织破碎与热处理。每轮包括 BeatBox 处理 10 min,随后在热循环仪中于 95 °C 孵育 20 min,热盖也设为 95 °C。在机械破碎与加热步骤之间,将板以 800 rpm 离心 60 s,使裂解液与组织材料集中于孔底。上述交替过程共重复 4 轮。第 4 轮后再次离心,将含蛋白的 4% SDS 裂解液转移至新 96 孔板。
蛋白定量与归一化
取各裂解液的等分样本,使用 Pierce™ BCA Protein Assay Kit(Thermo Fisher Scientific)测定蛋白浓度。根据测得浓度,将适量裂解液转移至 Protein LoBind 微量离心管;所选转移量应使其在 50 µL RIPA 缓冲液中重悬后达到 1.5 g/L 的目标蛋白浓度。将所选体积的裂解液在 45 °C 真空浓缩至完全干燥。干燥样本以 50 µL RIPA 缓冲液重悬,使用 Bioruptor 仪器(Diagenode)超声 5 min,按开启 30 s、关闭 30 s 交替循环。
基于 SP3 的自动化蛋白酶解
超声后,将样本转移至透明裙边 PCR 96 SuperPlate(Kisker Biotech,AB-2800;货号 017219),在 Agilent Bravo 液体处理平台上采用自动化单管固相增强样本制备(SP3)流程。每个样本投入 55 µg 蛋白。使用 1:1 混合的 Sera-Mag SpeedBead Magnetic Carboxylate A、B 磁珠(Cytiva)。使用前去除保存液,用 LC–MS 级水洗涤磁珠 3 次以清除残余保存缓冲液。以终浓度分别为 10 mM 和 40 mM 的三(2-羧乙基)膦(TCEP)及 2-氯乙酰胺(CAA)进行蛋白还原和烷基化。加入 100% 乙醇至终浓度 50%,使蛋白结合磁珠。随后用 80% 乙醇洗涤磁珠结合蛋白 2 次,再用 100% 乙腈洗涤 1 次,重悬于 100 mM 三乙基碳酸氢铵(TEAB)。
采用测序级修饰胰蛋白酶(Promega,V5111)在磁珠上酶解蛋白,酶与蛋白比例为 1:10,在 Eppendorf 台式 ThermoMixer 上于 37 °C、500 rpm 振荡 16 h。酶解后将板放置于磁力架,回收含肽上清。取相当于 3 µg 肽的等分样本,转移至 Eppendorf twin.tec® PCR Plate 96 LoBind®(Eppendorf,德国汉堡;货号 0030129512),用于全局蛋白组分析,其余肽材料用于磷酸化肽富集。两部分均在 45 °C 的 SpeedVac 中完全干燥。通过真空干燥终止酶解,此前不进行酸化。
自动化磷酸化肽富集
用于磷酸化组分析的干燥肽样本先以 20 µL 0.1% 三氟乙酸(TFA)水溶液复溶,再加入 80 µL 含 0.1% TFA 的乙腈。涡旋至可见颗粒溶解,以 6,000 × g 离心 5 min,转移至 96 孔 PCR 板。采用 Agilent AssayMAP Bravo 平台的 Phosphopeptide Enrichment v2.1 流程,以 Fe³⁺-NTA 柱富集磷酸化肽。先以含 0.1% TFA 的 50% 乙腈活化柱,再以含 0.1% TFA 的 80% 乙腈平衡。上样、洗涤后,使用约 pH 11 的 1% 氢氧化铵水溶液洗脱结合的磷酸化肽。磷酸化肽洗脱液用于 LC–MS/MS 分析,同时保留相应流穿液。两部分均使用 SpeedVac 在 45 °C 真空离心至完全干燥,储存于 −20 °C。
LC–MS/MS 分析前,将干燥磷酸化肽重悬于 17 µL 含 50 mM 柠檬酸及 0.1% TFA 的水溶液。全局蛋白组样本使用 36 µL 上样缓冲液复溶,其组成为 97.4% 水、2.5% 六氟异丙醇(HFIP)及 0.1% TFA。
质量控制
MCF7 参考样本与肿瘤样本一同经过完整 SP3 酶解及 Fe³⁺-NTA 磷酸化肽富集流程,作为样本制备及磷酸化肽富集的过程对照。定期间隔注入 HeLa 肽标准品(20 ng),约每 14 次 LC–MS 进样一次,以监测仪器性能及测量稳定性。每个生物学肿瘤样本在每种采集流程中仅分析一次,不进行技术重复进样。
LC–MS/MS 分析
使用直接连接 Orbitrap Exploris 480 质谱仪(Thermo Fisher Scientific)的 UltiMate 3000 UHPLC 系统分析全局蛋白组和富集磷酸化肽样本。肽在保持 35 °C 的 nanoEase M/Z Peptide BEH C18 分析柱上分离(孔径 130 Å、粒径 1.7 µm、75 µm × 250 mm;Waters,186,008,795)。磷酸化组分析时,先使用 Acclaim PepMap300 C18 捕集柱(5 µm、300 Å 大孔;Thermo Fisher Scientific),以 0.05% TFA 水溶液按 30 µL/min 流速在线脱盐 3 min。分析分离流速为 300 nL/min,溶剂 A 为 0.1% 甲酸水溶液,溶剂 B 为含 0.1% 甲酸的乙腈。
全局蛋白组分析进样 1 µg 酶解肽,采用 90 min 数据非依赖采集(DIA)方法。LC 梯度条件为 300 nL/min、35 °C。由 2% B 起始并保持至 3 min,4 min 时升至 4% B,随后线性升至 76 min 时的 30% B。77 min 时升至 80% B 并保持至 79 min,80 min 时降至 2% B,再平衡至 90 min。MS1 采用正离子模式,Orbitrap 分辨率 120,000,m/z 范围 350–1,400,归一化 AGC 目标 300%(绝对 AGC 值 3 × 10⁶),最大注入时间 45 ms。DIA MS2 使用 34 个可变隔离窗覆盖约 380–880 m/z 的前体范围。采用高能碰撞解离(HCD),归一化碰撞能量 28%。MS2 的 Orbitrap 分辨率为 30,000,归一化 AGC 目标 1,000%(绝对 AGC 值 1 × 10⁶),最大注入时间自动设置。计算所得 DIA 周期约为 2.3–2.5 s。
磷酸化组分析进样 15 µL,约相当于富集后磷酸化肽样本的 90%,采用 90 min 数据依赖采集(DDA)方法。每份样本后进行 22 min 清洗运行,以尽量减少样本间残留。分析梯度条件为 300 nL/min、35 °C,使用溶剂 A(0.1% 甲酸水溶液)与 B(含 0.1% 甲酸的乙腈)。2% B 起始并保持至 3 min,随后线性升至 76 min 时的 28% B;77 min 时升至 78% B,保持至 79 min,80 min 时降至 2% B,再平衡至 90 min。MS1 采用正离子模式,Orbitrap 分辨率 60,000,m/z 范围 380–1,400,归一化 AGC 目标 200%(绝对 AGC 值 2 × 10⁶),最大注入时间自动设置。DDA 的主扫描间固定周期为 1.5 s。选择电荷态 2–6 的前体离子进行碎裂,排除未确定电荷及单电荷特征。强度阈值为 6 × 10⁴。采用 1.0 m/z 隔离窗和归一化碰撞能量 30% 的 HCD 碎裂。MS2 的 Orbitrap 分辨率为 30,000,归一化 AGC 目标 200%(绝对 AGC 值 2 × 10⁵),最大注入时间 110 ms。动态排除设为 25 s,质量容差 ±10 ppm,并启用同位素排除。
全局蛋白组与磷酸化组数据处理
在具有 128 个物理核心(AMD EPYC 7503 32-Core Processor)及 256 GB 内存的 Linux 系统上处理全局蛋白组 DIA 和磷酸化组 DDA 原始谱图。采用命令行版 MaxQuant(v.2.4.2.0)[19]处理磷酸化组 DDA 数据。肽段–谱图匹配(PSM)及蛋白均按 1% 假发现率(FDR)过滤。无标记定量的最小比值计数设为 1。可变修饰包括氧化(M)、蛋白 N 端乙酰化、脱酰胺(NQ)及磷酸化(STY)。启用跨运行匹配(MBR),根据保留时间对齐与精确质量增加跨样本定量覆盖。
全局蛋白组 DIA 数据采用命令行版 DIA-NN v2.3.1 的默认设置及无谱库模式处理[5]。肽长度范围为 7–30 个氨基酸。碎片离子 m/z 限于 200–1,800,前体 m/z 限于 300–1,800。仅用蛋白特异性肽进行蛋白定量,在前体及蛋白层面应用 q 值 0.05 阈值。启用第二轮搜索选项(“--reanalyze”)。同时启用基于 QuantUMS 的 DIA-NN 归一化以获得全局归一化蛋白强度[6]。
两种处理流程均将原始谱图与 2025 年 1 月 16 日从 UniProt 数据库获取的人类标准蛋白序列进行搜索比对[21],其中包含 20,547 个蛋白及 20,310 个基因。指定胰蛋白酶为酶解酶,最多允许 2 个漏切位点。
全局蛋白组与磷酸化组数据预处理和质量控制
进一步分析使用 R 4.5.2。对 DIA-NN 归一化全局蛋白组强度和磷酸化组强度进行 log₂ 转换。全局蛋白组中,保留映射至唯一基因且 q 值 < 0.01 的蛋白强度用于后续分析;排除检出蛋白少于 5,000 个的样本。磷酸化组中,排除标为污染物或反向匹配以及定位概率低于 75% 的磷酸化位点;排除检出位点少于 3,500 个的样本。
两类数据均在 EGFR 扩增组与非扩增组内分别评估缺失值。若蛋白或磷酸化位点在两个生物学组内的检出样本比例均低于 75%,则不进入进一步分析。磷酸化组强度另经跨样本中位数中心化归一。为控制总蛋白丰度差异,随后从磷酸化位点强度中减去配对全局蛋白组中相应蛋白丰度的 log₂ 值。剩余缺失值采用 R 包 imputeLCMD 中实现的左删失 MinProb 方法插补。
全局蛋白组与磷酸化组下游分析
将归一化并插补的 log₂ 蛋白强度,以及经蛋白丰度校正并插补的磷酸化位点强度用于下游分析,包括主成分分析(PCA)降维、差异丰度分析、基因集富集分析(GSEA)和激酶活性推断。为评价 EGFR 扩增状态是否影响数据变异,对 PC1–10 评分进行单因素方差分析,检验显著关联并估计解释的变异比例(poV)。
使用 R 包 limma[16]评估 EGFR 扩增和非扩增肿瘤间蛋白及磷酸化位点的差异丰度。关注的蛋白/磷酸化位点定义为绝对 log₂ 倍数变化 > 0.58 且名义 P 值 < 0.05。对全局蛋白组进行 GSEA,以进一步评价两组的生物学差异。将差异丰度分析得到的 t 统计量用于快速基因集富集分析(fgsea;https://doi.org/10.18129/B9.bioc.fgsea),进行 10,000 次置换,基因集大小为 5–300。以 MSigDB 的 Hallmark 基因集检验输入数据,按校正后 P 值 < 0.05 选择关注的 Hallmark 集合。
使用 R 包 decoupler 的函数[3]从磷酸化组数据推断激酶活性。从 OmniPath 存档(https://archive.omnipathdb.org)下载最新激酶–底物(KS)数据库(2025 年 8 月 13 日),包含 ProtMapper 的 KS 关系。随后采用“通过富集调控子分析虚拟推断蛋白活性”(VIPER)[2]计算激酶活性。组间比较以差异丰度分析的 t 统计量为输入。按 P 值 < 0.05 筛选激酶,选择评分最高与最低的各 15 个激酶作单样本层面分析;该分析以 log₂ 归一化、蛋白丰度校正并插补后的磷酸化位点强度推断活性。两种分析均仅对至少具有 5 个底物的激酶估计活性评分。
为在单样本层面推断治疗相关通路活性,将 P 值 < 0.05 的激酶输入 R 包 clusterProfiler[25]进行过度代表分析(ORA),基因集大小为 5–300,对 P 值进行 Benjamini–Hochberg 校正。共整理 177 个 Reactome 基因集用于 ORA,并将其归入预定义的治疗相关信号类别[15],包括 EGFR/ERBB、ATR–CHK–WEE1/DNA 损伤、PI3K–AKT–mTOR、RAS–RAF–MEK–ERK/MAPK、VEGF/血管生成、CDK/细胞周期、SRC 家族及 PKC 信号(补充表 2)。激酶按补充表 2 归入相应信号类别。随后按校正后 P 值 < 0.05 选择关注通路。鉴于研究的探索性及样本量有限,通路及激酶层面的分析被视为假设生成。
为示范潜在的病例级报告框架,使用一例代表性肿瘤的磷酸化组结果。报告原型整合分析质量控制指标、Reactome 通路富集及归入信号类别的代表性磷酸化位点。报告所有组成部分均源自该单一样本,无需与队列其他样本比较。该分析属于探索性工作,不用于建立诊断阈值或预测治疗反应。
结果
常规 FFPE 胶质母细胞瘤组织可获得稳健的蛋白组与磷酸化组谱
首先评估诊断存档 FFPE 组织中蛋白组和磷酸化组分析的性能。纳入 10 例具有完整组织学、DNA 甲基化、拷贝数及靶向测序数据的胶质母细胞瘤,包括 EGFR 扩增与非扩增肿瘤各 5 例(图 1a)。所有病例均获得了定量全局蛋白组及磷酸化组数据。
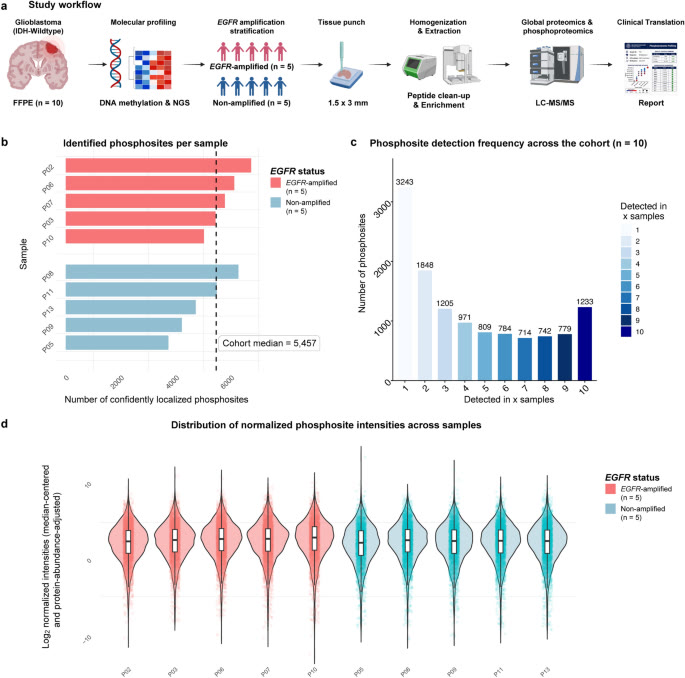
全局蛋白组分析获得广泛且可重复的蛋白覆盖,每个肿瘤检出蛋白中位数为 7,647 个,5,417 个蛋白在全部 10 个样本中检出(补充图 1)。各肿瘤归一化后的蛋白强度分布相近,支持全局蛋白组数据集具有一致的定量性能。经 MaxQuant 处理,磷酸化组分析共识别 13,467 个磷酸化位点;各样本可信定位位点数的队列中位数为 5,457,范围 3,724–6,729(图 1b)。位点检出频率分析表明,相当一部分位点可在多个肿瘤中重复检出,其中 1,233 个位点在全部 10 个样本中检出(图 1c)。中位数中心化及相应蛋白丰度校正后,各肿瘤磷酸化位点强度分布相近(图 1d)。这些质量控制指标共同表明,整个队列的蛋白组与磷酸化组覆盖稳健,定量可比。
全局蛋白组分析揭示与分组相关的蛋白丰度及通路差异
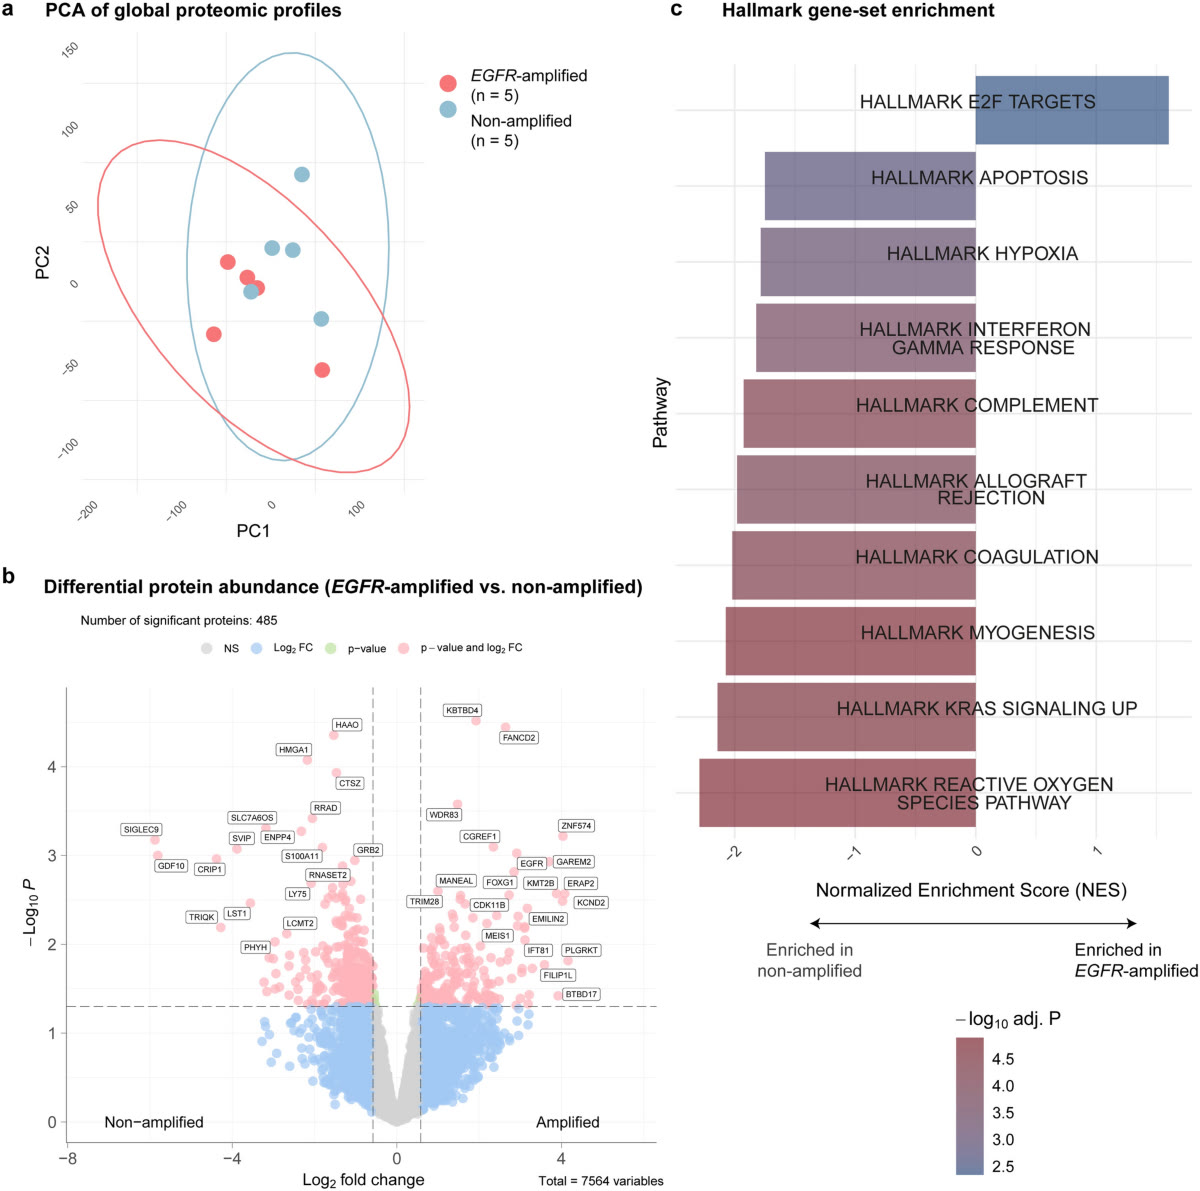
随后考察全局蛋白丰度模式是否与 EGFR 扩增状态相关。无监督 PCA 显示 EGFR 扩增与非扩增肿瘤显著重叠,提示全局蛋白层面存在较大的肿瘤间异质性(图 2a)。在所检验的 7,564 个蛋白中,差异丰度分析识别出符合预设探索性统计标准的 485 个蛋白,其中 EGFR 是扩增肿瘤中富集的蛋白之一(图 2b;补充表 3)。Hallmark 基因集富集分析进一步揭示了与分组相关的生物学程序差异。E2F 靶蛋白在 EGFR 扩增肿瘤中富集;若干应激、免疫与微环境相关程序,包括缺氧、干扰素 γ 反应、补体、活性氧信号及凋亡,则在非扩增肿瘤中富集(图 2c)。这些发现表明,EGFR 扩增状态与更广泛的蛋白组差异相关,但两个分子组内部仍存在显著异质性。
经蛋白丰度校正的磷酸化组谱按 EGFR 扩增状态呈部分分离
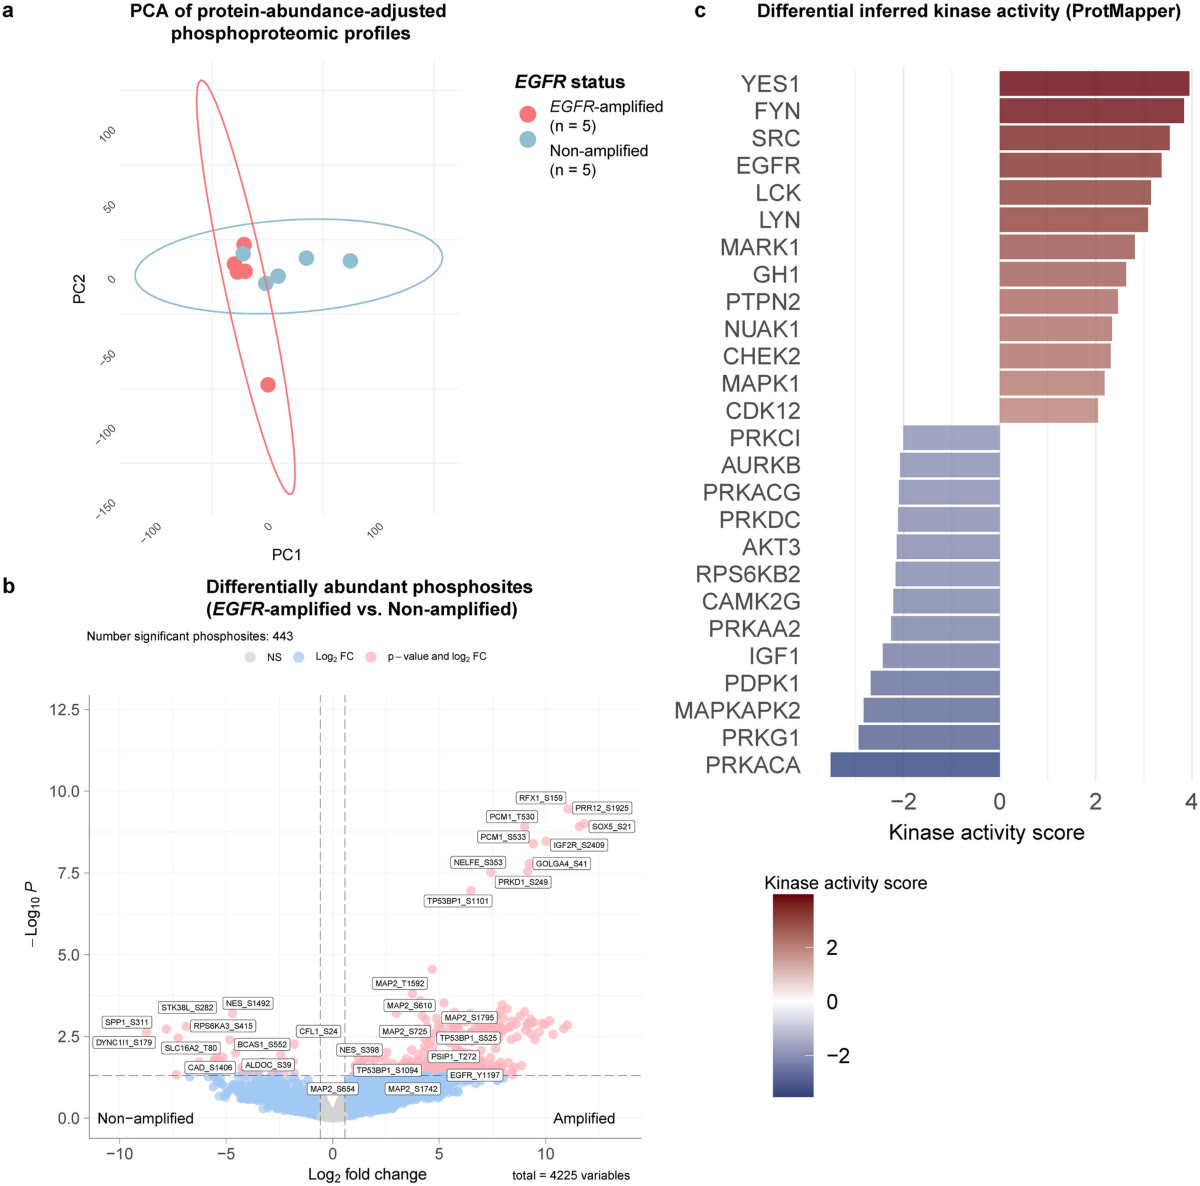
随后探讨位点特异性磷酸化是否提供全局蛋白丰度之外的功能层面信息。采用无监督 PCA 考察蛋白丰度校正后磷酸化组数据集的主要变异来源。两分子组间显著重叠,但仍可见部分分离(图 3a)。PC1 解释该数据集总变异的 29.9%,EGFR 扩增状态与 PC1 评分显著相关(P < 0.05)。因此,EGFR 扩增状态与校正后磷酸化组谱的变化相关,但并不界定一种均一且明确不同的磷酸化组状态。残余重叠及组内离散与显著的肿瘤间异质性一致,也促使研究进一步分析单个位点及信号通路。
磷酸化组分析检出 EGFR 扩增相关信号改变
随后探讨经蛋白丰度校正的磷酸化组谱能否捕捉与一种明确基因组改变相关、具有生物学意义的信号变化。EGFR 扩增与非扩增肿瘤间的差异分析识别出 443 个位点,符合绝对 log₂ 倍数变化 > 0.58、名义 P < 0.05 的预设探索性标准(图 3b;补充表 4)。扩增肿瘤富集的位点包括 TP53BP1 上的多个位点(如 S1101)、MAP2 上的多个位点及其他蛋白位点。值得注意的是,经相应蛋白丰度校正后,EGFR Y1110 和 Y1197 仍在扩增肿瘤中富集。相反,NES S1492 等若干位点在非扩增肿瘤中富集。这些发现说明,蛋白丰度校正后的磷酸化组分析可捕捉与 EGFR 扩增相关且生物学上连贯的磷酸化模式。鉴于队列规模有限及多重检验负担,单个位点应视为用于生成假设,而非候选生物标志物。
激酶–底物富集揭示 EGFR 与 SRC 家族相关信号
为将分析从单个位点扩展至更高层面,基于经过整理的 ProtMapper 注释,通过激酶–底物富集推断差异激酶活性(图 3c;补充表 5)。对校正后的磷酸化组数据分析显示,EGFR 扩增肿瘤中若干激酶的推断活性较高。YES1、FYN、SRC、EGFR 是最强的正向富集激酶信号之一,另有 LCK、LYN,提示 EGFR 与 SRC 家族相关信号协同富集。相反,与非扩增肿瘤相比,扩增肿瘤中 PRKACA、PRKG1、MAPKAPK2 和 PDPK1 等激酶的推断活性较低。由于激酶–底物富集依据注释底物的协同行为推断活性,而非直接测定酶活性,这些发现应作为通路层面推断解读。尽管如此,在相应蛋白丰度校正后,EGFR 与 SRC 家族相关激酶信号仍富集,支持 EGFR 扩增相关的功能信号差异。
病例级磷酸化组分析示范潜在报告框架
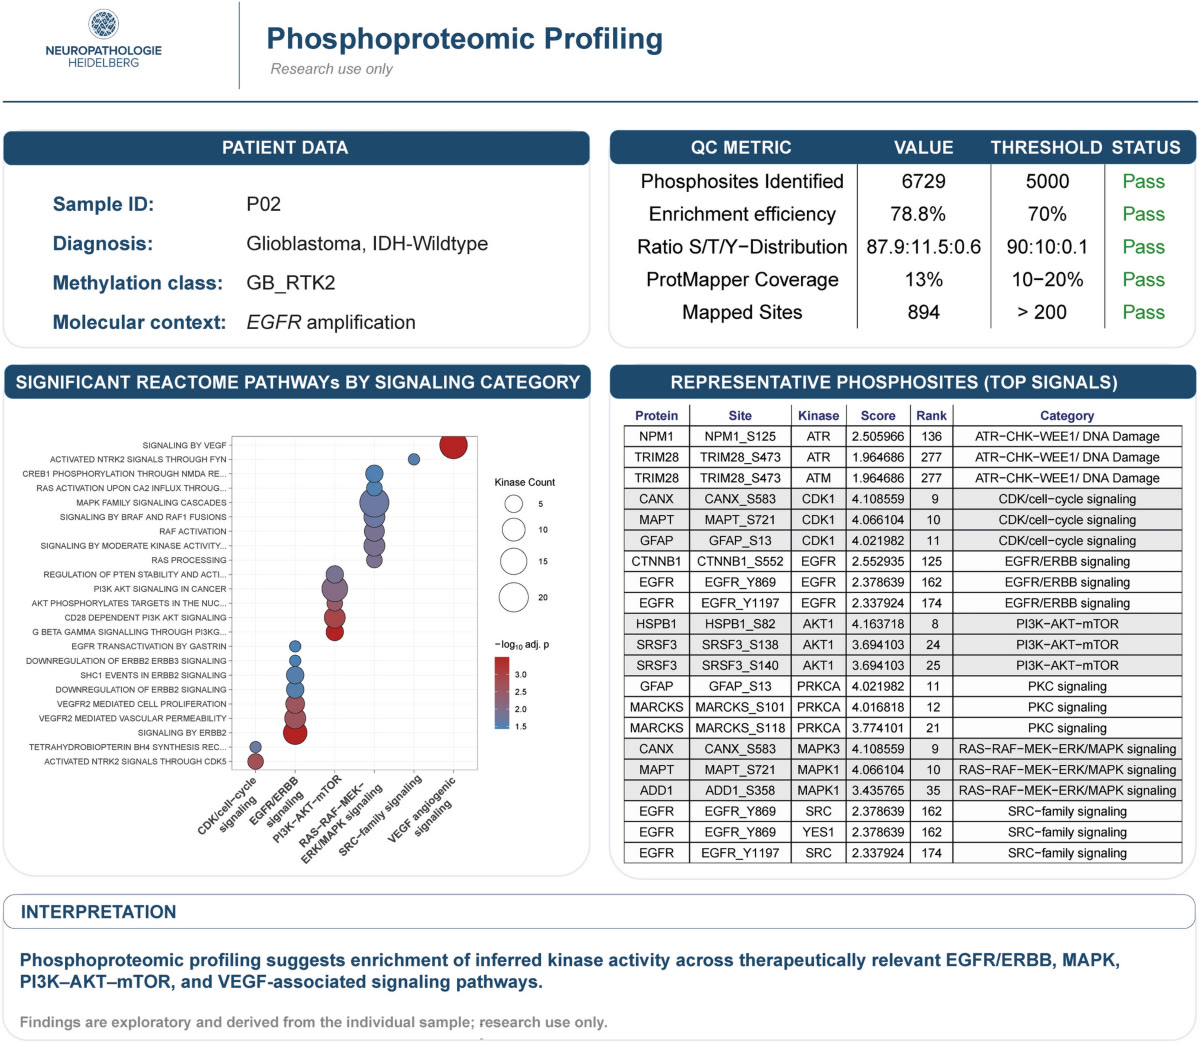
为展示如何在单个肿瘤层面汇总磷酸化组信息,针对一例代表性的 EGFR 扩增胶质母细胞瘤(P02;DNA 甲基化类别 GB_RTK2)生成了仅供研究使用的报告原型(图 4)。该报告直接根据个体肿瘤的磷酸化组谱生成,无需参考队列。报告将分析质量控制指标与通路层面富集及代表性磷酸化位点结果结合(补充表 6)。在此例中,磷酸化组分析提示多个治疗相关信号通路内的推断激酶活性富集,包括 EGFR/ERBB、RAS–RAF–MEK–ERK/MAPK、PI3K–AKT–mTOR 及 VEGF 相关信号。EGFR Y869、Y1197 等多个通路相关位点支持这些通路层面结果。报告旨在展示将磷酸化组信息整合至分子报告的潜在框架,而非提供经过验证的诊断或治疗读出。
讨论
本项概念验证研究表明,常规 FFPE 胶质母细胞瘤组织的蛋白组与磷酸化组分析可以提供生物学上连贯的功能信息,并结合现有基因组与表观基因组诊断加以解读。既往方法学研究已证实 FFPE 组织定量磷酸化组分析的可行性,近期进展进一步显著提高了分析深度与通量[7,22]。在此基础上,本研究将磷酸化组分析应用于全面表征的神经病理标本,以明确的基因组改变作为生物学基准,评价功能信号信息如何补充既有分子诊断。在这一情境下,常规 FFPE 材料获得了稳健的磷酸化组谱,可直接与肿瘤的基因组和表观基因组特征联系。
核心发现之一是在蛋白丰度与磷酸化两个层面检出了 EGFR 扩增所预期的生物学分子变化。全局蛋白组分析显示,扩增肿瘤中 EGFR 蛋白丰度升高,并揭示更广泛的组别相关通路差异。在磷酸化组层面,蛋白丰度校正后的分析发现了多项与扩增相关的磷酸化差异,包括 EGFR Y1110、Y1197 富集,而激酶–底物富集提示 EGFR 与 SRC 家族相关信号的协同变化。
这些发现与既往蛋白基因组学研究一致,即胶质母细胞瘤基因组改变与下游蛋白及磷酸化层面的变化相关。对未经治疗胶质母细胞瘤的大规模蛋白基因组学分析表明,整合基因组、蛋白组及翻译后修饰数据可揭示仅凭基因组信息无法捕捉的基因组改变之通路层面后果[23]。纵向蛋白基因组学分析进一步显示,胶质母细胞瘤在演化过程中,其信号状态可发生显著翻译后重塑,强调功能状态不能仅由基因组改变推断[10]。其他 IDH 野生型胶质母细胞瘤的整合蛋白组与磷酸化组分析同样显示明显分子异质性,并发现了可能具有治疗意义的信号模式[13]。本研究以 EGFR 扩增作为明确的基因组参照,将基因型与信号状态的这种关系扩展至常规处理的 FFPE 材料。
既往蛋白组和磷酸化组研究还表明,胶质母细胞瘤可以分为功能不同的分子亚组。整合分析识别出以不同信号网络与激酶依赖为特征的肿瘤状态,包括亚型相关的 PKCδ 和 DNA-PK 活性[12]。这些结果支持功能蛋白组信息通过区分生物学上不同的信号状态来补充基因组分类的概念。此类功能界定的信号状态能否提供现有分子分类器以外的预后信息,仍需在规模更大、临床注释完整的队列中评价。
EGFR 扩增并不对应均一的磷酸化组表型。经蛋白丰度校正的磷酸化组谱按扩增状态仅部分分离,与显著的肿瘤间异质性一致。这提示磷酸化组可能为分子表征增加价值。基因组改变确立分子驱动因素的存在,蛋白丰度与磷酸化则提供该改变在个体肿瘤内如何功能性表现的信息。具有同一基因组改变的肿瘤,其下游通路利用方式可能显著不同。因此,磷酸化组可以提供补充而非重复基因组分类的正交功能层面。
该方法兼容常规存档 FFPE 材料,并能在位点特异性磷酸化层面分析信号网络,支持其转化意义。近期高通量流程进一步表明,临床 FFPE 标本可获得较深的蛋白组与磷酸化组覆盖[7]。除技术可行性外,新兴精准肿瘤学框架也日益探索蛋白组及功能信号信息如何在分子肿瘤委员会和治疗优先排序中补充基因组结果[8,20]。
胶质母细胞瘤以外肿瘤类型的研究进一步支持磷酸化组分析的转化潜力。在胆管癌中,磷酸化组结合计算分析识别了患者特异的信号模式及候选药物敏感性,预测反应随后获得细胞模型支持[9]。在肝细胞癌中,磷酸化组分析界定了生物学与临床上不同的亚型,并识别候选治疗脆弱点,包括一种随后在细胞系及患者来源异种移植模型中评价的激酶靶向治疗[27]。这些研究共同说明,磷酸化组信息可将分子表征扩展至根据信号通路功能确定优先次序并提出治疗假设。
N²M²/NOA-20 伞式试验提供了一个按功能通路分层、具有临床意义的实例:根据磷酸化 mTOR 评估,筛选具有 mTOR 信号激活的胶质母细胞瘤患者接受替西罗莫司治疗[24]。这说明通路激活评估能够提供基因组改变之外的治疗信息。更定量的磷酸化组方法可能通过同时评估多条信号通路扩展此类策略,但仍需前瞻性验证及临床适用阈值。
目前,质谱磷酸化组的分析复杂性、基础设施需求及成本,很可能将其应用限制在部分临床和转化研究情境。此外,将磷酸化组信息纳入常规神经病理诊断前仍有挑战。激酶–底物富集根据注释位点的协同行为推断活性,而非直接测量酶活性;通路层面的关联需在更大独立队列中验证,并在适当情况下采用正交方法验证。组织处理、分析流程、定量阈值及报告框架的标准化也将是更广泛临床实施的重要条件[1]。
本研究有若干局限。队列仅含 10 个肿瘤,并有意围绕一种表征充分的基因组改变展开。因此,单个差异磷酸化位点及推断激酶活性应视为假设生成结果,而非候选生物标志物。整体组织分析不能区分空间、细胞或亚克隆异质性,而这些在胶质母细胞瘤中尤为重要。由于磷酸化位点丰度同时受总蛋白丰度与磷酸化状态影响,本研究用配对全局蛋白组中测得的相应蛋白丰度校正位点强度。这可减少总蛋白丰度差异对位点变化的贡献,但并非直接测量磷酸化化学计量。最后,仍需扩展至更大队列及其他分子定义的 CNS 肿瘤类型,以判断哪些功能信号特征具有可重复性及诊断或治疗意义。
总之,常规 FFPE 胶质母细胞瘤组织的蛋白组与磷酸化组分析能够检出与明确基因组改变相关、生物学上连贯的分子及信号后果,同时揭示基因组分类之外的功能异质性。磷酸化组并非测序、拷贝数分析或 DNA 甲基化分析的替代,而是补充肿瘤下游功能状态的信息。将这一功能层面与现有分子诊断整合,可能实现连接分子身份与通路活性的、更全面的 CNS 肿瘤表征。
数据可用性
本研究生成的已处理蛋白组与磷酸化组数据,以及用于下游数据处理和统计分析的代码,均公开于 https://github.com/FriedelDennisMNP/Functional_phosphoproteomic_profiling_of_routine_FFPE_CNS_tumor_tissue;支持研究结果的其他数据见补充表。
- Routine FFPE tissue from ten comprehensively characterized glioblastomas yielded proteomic and phosphoproteomic data: five EGFR-amplified and five non-amplified tumors.
- After adjustment for protein abundance, 443 phosphosites met exploratory differential criteria; kinase–substrate enrichment indicated coordinated EGFR- and SRC-family-associated signaling with substantial intertumoral heterogeneity.
- This proof-of-concept study provides functional information alongside genomics and epigenomics; the illustrative individual report is for research use only and does not imply therapeutic sensitivity.
Abstract
Genomic and DNA methylation-based analyses have transformed the classification of central nervous system (CNS) tumors by enabling robust molecular diagnosis and subclassification. However, these approaches primarily define tumor identity and do not directly capture the functional state of intracellular signaling networks. Proteomic and phosphoproteomic profiling provide complementary molecular layers by measuring protein abundance and site-specific phosphorylation. Recent methodological advances have made a comprehensive analysis of formalin-fixed, paraffin-embedded (FFPE) tissue increasingly feasible, raising the question of how functional proteomic information can complement established molecular diagnostics. Here, we applied an FFPE-compatible workflow for proteomic and phosphoproteomic profiling of ten comprehensively characterized glioblastomas, including five EGFR -amplified and five non-amplified tumors. Mass spectrometry generated robust proteomic and phosphoproteomic coverage across all cases. Global proteomic profiling revealed group-associated protein abundance and pathway differences, including increased EGFR abundance in EGFR -amplified tumors, while showing substantial intertumoral overlap. Protein-abundance-adjusted phosphoproteomic profiles similarly showed partial group-level separation with substantial intertumoral overlap. Differential analysis of protein-abundance-adjusted phosphoproteomic data identified 443 phosphosites based on predefined exploratory statistical criteria. Kinase-substrate enrichment further revealed coordinated EGFR- and SRC-family-associated signaling with marked variability across individual tumors. These findings demonstrate that routine FFPE tissue retains biologically coherent functional information at both the protein abundance and phosphosignaling levels that can be interpreted alongside genomic and epigenomic data. Phosphoproteomics therefore represents an orthogonal functional layer that may complement established molecular characterization of CNS tumors.
Introduction
The classification of central nervous system (CNS) tumors has been transformed by the integration of molecular diagnostics with conventional histopathology [ 11 ]. Genomic sequencing, copy number analysis, and genome-wide DNA methylation profiling have substantially improved diagnostic accuracy, refined tumor taxonomy, and enabled the recognition of biologically distinct tumor types that cannot be reliably resolved by morphology alone [ 4 , 11 , 14 ]. Consequently, molecular diagnostics have become central to defining tumor identity, lineage, recurrent driver alterations, and genomic architecture.
Despite these advances, established molecular assays primarily characterize relatively stable layers of tumor biology. Although genomic and epigenomic analyses define molecular identity with high precision, they do not directly capture the functional state of intracellular signaling pathways. This may contribute to the limited impact that these refined diagnoses have had so far in the clinical setting. Information on functional consequences may help address this gap. Protein abundance and site-specific phosphorylation provide complementary information by reflecting the integrated consequences of genomic alterations, post-transcriptional regulation, and cellular signaling. Proteomic and phosphoproteomic profiling therefore offer the opportunity to connect molecular classification with pathway activity [ 13 , 23 ].
The widespread use of formalin-fixed, paraffin-embedded (FFPE) tissue has historically represented a major obstacle to proteomic analysis in routine pathology. However, methodological advances in tissue processing, phosphopeptide enrichment, and mass spectrometry have established that comprehensive proteomic and phosphoproteomic information can be recovered from FFPE specimens [ 7 , 22 , 26 ]. The remaining challenge is therefore not solely technical feasibility, but how such functional molecular information can be integrated with established diagnostic frameworks and interpreted in the context of genomically and epigenomically defined tumors.
Glioblastoma provides a suitable model to evaluate this concept because its diagnosis routinely integrates histopathology with genomic, copy number, and DNA methylation-based analyses, while EGFR amplification represents one of its most frequent and biologically well-characterized genomic alterations [ 11 , 23 ]. Rather than aiming to identify novel biomarkers or molecular subclasses from a small cohort, this proof-of-concept study asked whether proteomic and phosphoproteomic profiling of routine FFPE tissue can provide biologically coherent functional information alongside established molecular diagnostics, whether known signaling consequences of EGFR amplification can be recovered, and whether phosphoproteomics captures functional heterogeneity beyond binary genomic classification. Although demonstrated here in glioblastoma, this framework may be applicable to the molecular characterization of CNS tumors more broadly.
Materials and methods
Patient samples
Archived FFPE tumor material from ten patients with glioblastoma, IDH-wildtype, was retrospectively selected from the Department of Neuropathology, University Hospital Heidelberg, Germany. All cases were reviewed histologically and had undergone integrated molecular characterization as part of the diagnostic workflow. The cohort comprised five tumors with EGFR amplification and five tumors without EGFR amplification; clinical and molecular characteristics are summarized in Supplementary Table 1 . Selection was based on the availability of sufficient FFPE material, adequate tumor content, and complete molecular data, including genome-wide DNA methylation profiling and targeted sequencing. This study was approved by the ethics committee of Heidelberg University (S-318/2022). Clinical and molecular data were pseudonymized before analysis.
Nucleic acid extraction
Genomic DNA was extracted from FFPE tissue sections enriched for tumor cell content based on neuropathological review. DNA extraction was performed using the automated Maxwell RSC platform (Promega, Madison, WI, USA) with the Maxwell RSC FFPE Plus DNA Kit according to the manufacturer's instructions. DNA concentration was quantified using the Qubit dsDNA Broad Range Assay Kit (Thermo Fisher Scientific, Waltham, MA, USA). Extracted DNA was subsequently used for genome-wide DNA methylation profiling and targeted next-generation sequencing.
DNA methylation profiling and copy number analysis
Genome-wide DNA methylation profiling was performed using Illumina Infinium MethylationEPIC BeadChip array according to established protocols, as previously described [ 4 ]. Raw intensity data (IDAT files) were processed using computational pipelines implemented in R. Data preprocessing included background correction, dye-bias correction, normalization, and quality control assessment [ 4 ]. Technical variation associated with array type was corrected using linear modeling approaches. DNA methylation-based tumor classification was performed using established reference datasets and classification algorithms [ 18 ] (Heidelberg Brain Tumor Classifier, version 12.8). The assigned methylation class and the corresponding calibrated classifier score for each individual tumor are provided in Supplementary Table 1 . Copy number alteration profiles were derived from methylation array data using the conumee package in R. Focal genomic alterations were assessed by manual inspection of log2 ratio plots and integrated with sequencing-based findings.
Targeted DNA sequencing
Targeted next-generation sequencing was performed using a custom-designed enrichment-based panel covering coding exons and selected intronic regions of 220 genes associated with central nervous system tumors [ 17 ]. Sequencing libraries were generated according to the manufacturer's protocols and sequenced on Illumina NovaSeq 6000 platforms. Sequence reads were aligned to the human reference genome GRCh38 (hg38) using the Burrows–Wheeler Aligner (BWA). Variant calling included single-nucleotide variants, small insertions/deletions, and selected structural alterations including gene fusions. Variants with an allele frequency below 5% were excluded from further analysis. Variant interpretation and pathogenicity assessment were performed according to American College of Medical Genetics and Genomics (ACMG) guidelines.
FFPE tissue processing and protein extraction
FFPE tissue processing and protein extraction were performed using an optimized plate-based workflow as described below. Tissue punches were transferred to randomized positions in an Eppendorf twin.tec ® PCR Plate 96 LoBind ® (Eppendorf, Hamburg, Germany; cat. no. 0030129512). Each punch was incubated in 100 µL of 4% (w/v) sodium dodecyl sulfate (SDS), and the plate was sealed using domed strip caps. Small cylindrical Gyuto Beads 2 × 2 (PreOmics, art. no. P.0.00154) were placed in each sample-containing well and in the directly adjacent wells above, below, and on either side. The plate was processed using a BeatBox ® tissue homogenizer (PreOmics, Germany) set to high force for 10 min. In the instrument, an alternating magnetic field drives the magnetic disruption elements to generate mechanical impact and shear forces, facilitating disruption of the tissue and surrounding paraffin. No conventional xylene-based deparaffinization was performed.
The samples were subjected to four alternating cycles of mechanical tissue disruption and heat treatment. Each cycle consisted of 10 min of BeatBox processing followed by incubation for 20 min at 95 °C in a thermocycler with the heated lid set to 95 °C. Between the mechanical disruption and heating steps, the plate was centrifuged for 60 s at 800 rpm to collect lysate and tissue material at the bottom of the wells. This alternating procedure was repeated for a total of four cycles. Following the fourth cycle, the plate was centrifuged once more, and the protein-containing lysates in 4% SDS were transferred to a new 96-well plate.
Protein quantification and normalization
An aliquot of each lysate was removed for protein concentration determination using the Pierce™ BCA Protein Assay Kit (Thermo Fisher Scientific). Based on the measured protein concentration, an appropriate volume of lysate was transferred into a Protein LoBind microcentrifuge tube. The transferred amount was selected to achieve a target protein concentration of 1.5 g/L after resuspension in 50 µL RIPA buffer. The selected lysate volume was dried to completeness in a vacuum concentrator at 45 °C. Dried samples were resuspended in 50 µL RIPA buffer and sonicated using a Bioruptor instrument (Diagenode) for 5 min with alternating 30 s ON and 30 s OFF cycles.
Automated SP3-based protein digestion
Following sonication, the samples were transferred to a clear, skirted PCR 96 SuperPlate (Kisker Biotech, AB-2800; art. no. 017219) and processed using an automated single-pot, solid-phase-enhanced sample preparation (SP3) workflow on an Agilent Bravo liquid-handling platform. A protein input of 55 µg per sample was used for the SP3 workflow. A 1:1 mixture of Sera-Mag SpeedBead Magnetic Carboxylate A and B particles (Cytiva) was used. Before use, the beads were removed from the storage solution and washed three times with LC–MS-grade water to remove the residual storage buffer. Proteins were reduced with tris(2-carboxyethyl)phosphine (TCEP) and alkylated with 2-chloroacetamide (CAA) to final concentrations of 10 mM and 40 mM, respectively. Protein binding to the magnetic beads was induced by addition of 100% ethanol to a final concentration of 50%. The bead-bound proteins were subsequently washed twice with 80% ethanol and once with 100% acetonitrile, followed by resuspension in 100 mM triethylammonium bicarbonate (TEAB).
Proteins were digested on-bead with sequencing-grade modified trypsin (Promega, V5111) at an enzyme-to-protein ratio of 1:10 for 16 h at 37 °C with agitation at 500 rpm on an Eppendorf benchtop ThermoMixer. Following digestion, the plate was placed on a magnetic rack and the peptide-containing supernatant was recovered. An aliquot corresponding to 3 µg of peptides was transferred to an Eppendorf twin.tec ® PCR Plate 96 LoBind® (Eppendorf, Hamburg, Germany; cat. no. 0030129512) for global proteome analysis, while the remaining peptide material was retained for phosphopeptide enrichment. Both fractions were dried to completeness in a SpeedVac at 45 °C. The digestion was stopped by vacuum drying without prior acidification.
Automated phosphopeptide enrichment
Dried peptide samples intended for phosphoproteomic analysis were reconstituted in 20 µL of 0.1% trifluoroacetic acid (TFA) in water, followed by addition of 80 µL of 0.1% TFA in acetonitrile. Samples were vortexed until visible particulates were dissolved, centrifuged at 6,000 × g for 5 min, and transferred to a 96-well PCR plate. Phosphopeptides were enriched using Fe 3 ⁺-NTA cartridges on an Agilent AssayMAP Bravo platform with the Phosphopeptide Enrichment v2.1 workflow. The cartridges were primed with 0.1% TFA in 50% acetonitrile and equilibrated with 0.1% TFA in 80% acetonitrile. Following sample loading and washing, bound phosphopeptides were eluted using 1% ammonium hydroxide in water at approximately pH 11. The phosphopeptide eluate was used for LC–MS/MS analysis, while the corresponding flow-through was retained. Both fractions were dried to completeness by vacuum centrifugation using a SpeedVac at 45 °C and stored at −20 °C.
Before LC–MS/MS analysis, the dried phosphopeptides were resuspended in 17 µL of water containing 50 mM citric acid and 0.1% TFA. Global-proteome samples were reconstituted in 36 µL sample buffer containing 97.4% water, 2.5% hexafluoro-2-propanol (HFIP), and 0.1% TFA.
Quality control
An MCF7 reference sample was processed alongside the tumor samples through the complete SP3 digestion and Fe 3 ⁺-NTA phosphopeptide-enrichment workflow and served as a process control for sample preparation and phosphopeptide enrichment. A HeLa peptide standard (20 ng) was injected at regular intervals, approximately every 14 LC–MS injections, to monitor instrument performance and measurement stability. Each biological tumor sample was analyzed once per acquisition workflow without technical replicate injections.
LC–MS/MS analysis
Global-proteome and phosphopeptide-enriched samples were analyzed using an UltiMate 3000 UHPLC system directly coupled to an Orbitrap Exploris 480 mass spectrometer (Thermo Fisher Scientific). Peptides were separated on a nanoEase M/Z Peptide BEH C18 analytical column (130 Å pore size, 1.7 µm particle size, 75 µm × 250 mm; Waters, 186,008,795) maintained at 35 °C. For phosphoproteomic analysis, peptides were online-desalted on an Acclaim PepMap300 C18 trapping cartridge (5 µm, 300 Å wide pore; Thermo Fisher Scientific) for 3 min at a flow rate of 30 µL/min using 0.05% TFA in water. Analytical separation was performed at 300 nL/min using solvent A (0.1% formic acid in water) and solvent B (0.1% formic acid in acetonitrile).
For global proteome analysis, 1 µg of peptide digest was injected and analyzed using a 90 min data-independent acquisition (DIA) method. The LC gradient was run at 300 nL/min and 35 °C. Starting at 2% solvent B, the composition was held at 2% B until 3 min, increased to 4% B at 4 min, and then linearly increased to 30% B by 76 min. Solvent B was increased to 80% at 77 min and held at 80% until 79 min, followed by a decrease to 2% B at 80 min and re-equilibration until 90 min. MS1 spectra were acquired in positive-ion mode at an Orbitrap resolution of 120,000 over an m/z range of 350–1,400, using a normalized AGC target of 300% (absolute AGC value 3 × 10⁶) and a maximum injection time of 45 ms. DIA MS2 acquisition covered the precursor range of approximately 380–880 m/z using 34 variable isolation windows. Precursors were fragmented using higher-energy collisional dissociation (HCD) with a normalized collision energy of 28%. MS2 spectra were recorded at an Orbitrap resolution of 30,000 with a normalized AGC target of 1,000% (absolute AGC value 1 × 10⁶) and automatic maximum injection time. The calculated DIA cycle time was approximately 2.3–2.5 s.
For phosphoproteomic analysis, 15 µL, corresponding to approximately 90% of the phosphopeptide-enriched sample, was injected and analyzed using a 90 min data-dependent acquisition (DDA) method. Each sample was followed by a 22 min wash run to minimize carry-over between samples. The analytical gradient was run at 300 nL/min and 35 °C using solvent A (0.1% formic acid in water) and solvent B (0.1% formic acid in acetonitrile). Starting at 2% B, the composition was held at 2% until 3 min and then linearly increased to 28% B by 76 min. Solvent B was increased to 78% at 77 min and held at 78% until 79 min, followed by a decrease to 2% B at 80 min and re-equilibration until 90 min. MS1 spectra were acquired in positive-ion mode at an Orbitrap resolution of 60,000 over an m/z range of 380–1,400, with a normalized AGC target of 200% (absolute AGC value 2 × 10⁶) and automatic maximum injection time. Data-dependent acquisition was performed using a fixed cycle time of 1.5 s between master scans. Precursor ions with charge states 2–6 were selected for fragmentation; unassigned and singly charged features were excluded. An intensity threshold of 6 × 10 4 was applied. Precursors were isolated using a 1.0 m/z window and fragmented by HCD at a normalized collision energy of 30%. MS2 spectra were acquired at an Orbitrap resolution of 30,000 with a normalized AGC target of 200% (absolute AGC value 2 × 10 5 ) and a maximum injection time of 110 ms. Dynamic exclusion was set to 25 s with a ±10 ppm mass tolerance, and isotope exclusion was enabled.
Processing of global proteome and phosphoproteomic data
Raw spectra from global proteomic DIA and phosphoproteomic DDA acquisitions were processed on a Linux system with 128 physical cores (AMD EPYC 7503 32-Core Processor) and 256 GB of RAM. The command-line version of MaxQuant (v.2.4.2.0) [ 19 ] was used to process phosphoproteomic DDA data. Peptide-spectrum matches (PSMs) and proteins were filtered at a false discovery rate (FDR) of 1%. Label-free quantification was performed with a minimum ratio count of 1. Variable modifications included oxidation (M), protein N-terminal acetylation, deamidation (NQ), and phosphorylation (STY). Match between runs (MBR) was enabled to increase quantification coverage across samples based on retention-time alignment and accurate mass.
Global proteomic DIA data were processed using the command-line version of DIA-NN v2.3.1 with default settings and in library-free mode [ 5 ]. A minimum peptide length of 7 and a maximum peptide length of 30 amino acids were used. Fragment ion m/z values were restricted to 200–1,800, and precursor m/z values to 300–1,800. Only proteotypic peptides were considered for protein quantification, and a q -value threshold of 0.05 was applied at the precursor and protein levels. The second-pass search (“--reanalyze”) option was enabled. In addition, DIA-NN normalization using QuantUMS was enabled to obtain globally normalized protein intensities [ 6 ].
For both processing workflows, raw spectra were searched against canonical human protein sequences obtained from the UniProt database on January 16, 2025 [ 21 ], comprising 20,547 proteins and 20,310 genes. Trypsin was specified as the digestion enzyme, allowing up to two missed cleavages.
Preprocessing and quality control of global proteomic and phosphoproteomic data
Further analyses were performed in R version 4.5.2. DIA-NN-normalized global proteomic intensities and phosphoproteomic intensities were log₂-transformed. For global proteomic data, protein intensities mapping to unique genes and meeting a q -value threshold of < 0.01 were retained for further analysis, and samples with fewer than 5000 identified proteins were excluded. For phosphoproteomic data, phosphosites marked as contaminants or reverse hits, as well as phosphosites with a localization probability below 75%, were excluded. Samples with fewer than 3500 identified phosphosites were excluded from further analysis.
For both datasets, missing values were evaluated separately within EGFR -amplified and non-amplified tumors. Proteins or phosphosites identified in fewer than 75% of samples in both biological groups were excluded from further analysis. Phosphoproteomic intensities were additionally normalized by median centering across samples. To account for differences in total protein abundance, phosphosite intensities were subsequently adjusted by subtracting the log₂-transformed abundance of the corresponding protein measured in the matched global proteome. Remaining missing values were imputed using the left-censored MinProb method implemented in the R package imputeLCMD.
Downstream analysis of global proteome and phosphoproteomic data
Normalized and imputed log₂ protein intensities and protein-abundance-adjusted and imputed phosphosite intensities were used for downstream analyses including dimensional reduction by principal component analysis (PCA), differential abundance analysis, gene set enrichment analysis (GSEA), and kinase activity inference. To evaluate whether EGFR amplification status contributed to data variance, a one-way ANOVA was performed on PC scores 1–10 to test for significant associations and estimate the proportion of variance (poV) explained.
Differential abundance of proteins and phosphosites between EGFR -amplified and non-amplified tumors was assessed using the R-package limma [ 16 ]. Proteins/phosphosites of interest were defined by an absolute log₂ fold change > 0.58 and a nominal P value < 0.05. GSEA was conducted on the global proteome to further evaluate biological differences between the compared groups. Therefore, t-statistics obtained from differential abundance analysis were analyzed by fast gene set enrichment analysis (fgsea; https://doi.org/10.18129/B9.bioc.fgsea ) using 10,000 permutations, with a minimum gene set size of 5 and a maximum of 300. The input was tested against Hallmark gene sets obtained from MSigDB. Hallmarks of interest were selected based on an adjusted P value < 0.05.
Kinase activity inference was conducted on phosphoproteomic data using the functions provided by the R package decoupler [ 3 ]. The latest Kinase–Substrate (KS) databases (13/08/2025), including KS relationships from ProtMapper, were downloaded from the OmniPath archive ( https://archive.omnipathdb.org ). Subsequently, ‘Virtual Inference of Protein activity by Enriched Regulon analysis’ (VIPER) [ 2 ] was used to calculate kinase activities. The t-statistics from the differential abundance analysis were used as input to compare kinase activities between the groups. Kinases were filtered for a P value < 0.05, and the 15 highest- and 15 lowest-scoring kinases were selected for investigation at the single-sample level. Here, log₂-normalized, protein-abundance-adjusted, and imputed phosphosite intensities were used for kinase activity inference at the single-sample level. For both approaches, kinase activity scores were estimated only for kinases with a minimum of 5 substrates.
To infer activity in therapeutically relevant pathways at the single-sample level, kinases with a P value < 0.05 were subjected to overrepresentation analysis (ORA) using the functions provided by the R package clusterProfiler [ 25 ] with a minimum gene set size of 5 and a maximum of 300, with Benjamini–Hochberg correction for P values. In total, 177 Reactome gene sets were curated for ORA and assigned to predefined therapeutically relevant signaling categories [ 15 ], including EGFR/ERBB signaling, ATR−CHK−WEE1/DNA damage signaling, PI3K−AKT−mTOR signaling, RAS−RAF−MEK−ERK/MAPK signaling, VEGF/angiogenic signaling, CDK/cell cycle signaling, SRC-family signaling, and PKC signaling (Supplementary Table 2 ). Kinases were assigned to the corresponding signaling categories as summarized in Supplementary Table 2 . Subsequently, pathways of interest were selected based on an adjusted P value < 0.05. Given the exploratory nature and limited sample size of the study, pathway- and kinase-level analyses were considered hypothesis-generating.
For illustration of a potential case-level reporting framework, phosphoproteomic findings from one representative tumor were used. The prototype report integrated analytical quality-control metrics, Reactome pathway enrichment, and representative phosphosites assigned to signaling categories. All components of the report were derived from the individual sample without requiring comparison with the remaining cohort. This analysis was considered exploratory and was not intended to establish diagnostic thresholds or predict therapeutic response.
Results
Routine FFPE glioblastoma tissue yields robust proteomic and phosphoproteomic profiles
We first assessed the analytical performance of proteomic and phosphoproteomic profiling in diagnostically archived FFPE tissue. Ten glioblastomas with complete histological, DNA methylation, copy number, and targeted sequencing data were included, comprising five EGFR -amplified and five non-amplified tumors (Fig. 1 a). Quantitative global proteomic and phosphoproteomic data were obtained from all cases.
Global proteomic profiling yielded broad and reproducible protein coverage, with a median of 7647 proteins identified per tumor and 5417 proteins detected in all ten samples (Supplementary Figure 1 ). Normalized protein intensity distributions were comparable across individual tumors, supporting consistent quantitative performance of the global proteomic dataset. Phosphoproteomic analysis identified a total of 13,467 phosphosites following MaxQuant processing, with a cohort median of 5457 confidently localized phosphosites per sample and a range of 3724–6729 (Fig. 1 b). Phosphosite detection-frequency analysis showed that a substantial fraction of sites was reproducibly detected across multiple tumors, including 1233 phosphosites identified in all ten samples (Fig. 1 c). Following median centering and adjustment for corresponding protein abundance, phosphosite intensity distributions were comparable across individual tumors (Fig. 1 d). Together, these quality-control metrics demonstrate robust and quantitatively comparable proteomic and phosphoproteomic coverage across the cohort.
Global proteomic profiling reveals group-associated protein abundance and pathway differences
We next examined whether global protein abundance patterns were associated with EGFR-amplification status. Unsupervised principal component analysis showed substantial overlap between EGFR -amplified and non-amplified tumors, indicating considerable intertumoral heterogeneity at the global protein level (Fig. 2 a). Differential protein abundance analysis identified 485 proteins meeting predefined exploratory statistical criteria among 7564 tested proteins, with EGFR among the proteins enriched in EGFR -amplified tumors (Fig. 2 b; Supplementary Table 3 ). Hallmark gene-set enrichment analysis further revealed group-associated differences in biological programs. E2F target proteins were enriched in EGFR -amplified tumors, whereas several stress-, immune-, and microenvironment-associated programs, including hypoxia, interferon-γ response, complement, reactive oxygen species signaling, and apoptosis, were enriched in non-amplified tumors (Fig. 2 c). Together, these findings indicate that EGFR amplification status is associated with broader proteomic differences while substantial heterogeneity remains within both molecular groups.
Protein-abundance-adjusted phosphoproteomic profiles show partial separation according to EGFR amplification status
We next asked whether site-specific phosphorylation provided an additional functional layer beyond global protein abundance. Unsupervised principal component analysis was used to examine the dominant sources of variation in the protein-abundance-adjusted phosphoproteomic dataset. The two molecular groups showed substantial overlap, although partial separation remained evident (Fig. 3 a). PC1 accounted for 29.9% of the total variance in the protein-abundance-adjusted phosphoproteomic dataset, and EGFR amplification status was significantly associated with PC1 scores ( P < 0.05). Thus, EGFR amplification status is associated with variation in the protein-abundance-adjusted phosphoproteomic profiles but does not define a uniformly distinct phosphoproteomic state. The remaining overlap and within-group dispersion are consistent with substantial intertumoral heterogeneity and motivated subsequent analyses of individual phosphosites and signaling pathways.
Phosphoproteomic analysis recovers signaling changes associated with EGFR amplification
We next asked whether protein-abundance-adjusted phosphoproteomic profiles captured biologically meaningful signaling changes associated with a well-established genomic alteration. Differential analysis between EGFR -amplified and non-amplified tumors identified 443 phosphosites meeting the predefined exploratory criteria of an absolute log₂ fold change > 0.58 and nominal P < 0.05 (Fig. 3 b; Supplementary Table 4 ). Among phosphosites enriched in EGFR -amplified tumors were several sites on TP53BP1, including S1101, together with multiple sites on MAP2 and other proteins. Importantly, EGFR Y1110 and Y1197 remained enriched in EGFR -amplified tumors after adjustment for corresponding protein abundance. Conversely, several phosphosites, including NES S1492, were enriched in non-amplified tumors. These findings indicate that protein-abundance-adjusted phosphoproteomic profiling captures biologically coherent phosphorylation patterns associated with EGFR amplification. Given the limited cohort size and multiple-testing burden, individual phosphosites should be considered hypothesis-generating rather than candidate biomarkers.
Kinase-substrate enrichment reveals EGFR- and SRC-family-associated signaling
To extend the analysis beyond individual phosphosites, we inferred differential kinase activity using kinase-substrate enrichment based on curated ProtMapper annotations (Fig. 3 c; Supplementary Table 5 ). Analysis of the protein-abundance-adjusted phosphoproteomic data identified higher inferred activity of several kinases in EGFR -amplified tumors. YES1, FYN, SRC, and EGFR were among the strongest positively enriched kinase signals, together with LCK and LYN, indicating coordinated enrichment of EGFR- and SRC-family-associated signaling. Conversely, several kinases, including PRKACA, PRKG1, MAPKAPK2, and PDPK1, showed lower inferred activity in EGFR -amplified tumors relative to non-amplified tumors. Because kinase-substrate enrichment infers kinase activity from the coordinated behavior of annotated substrates rather than directly measuring enzymatic activity, these findings should be interpreted as pathway-level inferences. Nevertheless, the enrichment of EGFR- and SRC-family-associated kinase signals after adjustment for corresponding protein abundance supports functional signaling differences associated with EGFR amplification.
Case-level phosphoproteomic profiling illustrates a potential reporting framework
To illustrate how phosphoproteomic information could be summarized at the level of an individual tumor, we generated a prototype research-use-only report for one representative EGFR -amplified glioblastoma (P02; DNA methylation class GB_RTK2; Fig. 4 ). Importantly, the report was generated from the phosphoproteomic profile of the individual tumor without requiring a reference cohort. The report combines analytical quality-control metrics with pathway-level enrichment and representative phosphosite findings (Supplementary Table 6 ). In this example, phosphoproteomic profiling suggested enrichment of inferred kinase activity within therapeutically relevant signaling pathways, including EGFR/ERBB, RAS–RAF–MEK–ERK/MAPK, PI3K–AKT–mTOR, and VEGF-associated signaling. Multiple pathway-associated phosphosites, including EGFR Y869 and Y1197, supported these pathway-level findings. The report is intended to illustrate a potential framework for integrating phosphoproteomic information into molecular reporting rather than to provide a validated diagnostic or therapeutic readout.
Discussion
This proof-of-concept study demonstrates that proteomic and phosphoproteomic profiling of routine FFPE glioblastoma tissue can provide biologically coherent functional information that can be interpreted alongside established genomic and epigenomic diagnostics. Previous methodological studies have established that quantitative phosphoproteomic analysis is feasible in FFPE tissue, and recent developments have substantially increased analytical depth and throughput [ 7 , 22 ]. Building on these advances, our study applies phosphoproteomic profiling to comprehensively characterized neuropathological specimens and uses a defined genomic alteration as a biological benchmark to assess how functional signaling information complements established molecular diagnostics. In this setting, routine FFPE material yielded robust phosphoproteomic profiles that could be directly related to genomic and epigenomic tumor characteristics.
A central observation was the recovery of biologically expected molecular changes associated with EGFR amplification across both protein abundance and phosphorylation levels. Global proteomic analysis demonstrated increased EGFR protein abundance in EGFR -amplified tumors and revealed broader group-associated pathway differences. At the phosphoproteomic level, protein-abundance-adjusted analysis identified multiple phosphorylation differences associated with EGFR amplification, including enrichment of EGFR Y1110 and Y1197, while kinase-substrate enrichment indicated coordinated EGFR- and SRC-family-associated signaling.
These findings are consistent with previous proteogenomic studies showing that genomic alterations in glioblastoma are associated with downstream changes at the protein and phosphorylation levels. Large-scale proteogenomic profiling of treatment-naive glioblastomas has demonstrated that integration of genomic, proteomic, and post-translational modification data can reveal pathway-level consequences of genomic alterations that are not captured by genomic information alone [ 23 ]. Longitudinal proteogenomic analyses further demonstrate that glioblastoma signaling states can undergo substantial post-translational remodeling during tumor evolution, emphasizing that functional state cannot be inferred from genomic alterations alone [ 10 ]. Other integrated proteomic and phosphoproteomic analyses of IDH-wildtype glioblastoma have likewise demonstrated substantial molecular heterogeneity and identified signaling patterns with potential therapeutic relevance [ 13 ]. Our findings extend this relationship between genotype and signaling state to routinely processed FFPE material, using EGFR amplification as a defined genomic reference point.
Previous proteomic and phosphoproteomic studies have also demonstrated that glioblastomas can be stratified into functionally distinct molecular subgroups. Integrated proteomic and phosphoproteomic analyses have identified tumor states characterized by distinct signaling networks and kinase dependencies, including subtype-associated PKCδ and DNA-PK activity [ 12 ]. These findings support the concept that functional proteomic information may complement genomic classification by resolving biologically distinct signaling states. Whether such functionally defined signaling states provide prognostic information beyond established molecular classifiers will require evaluation in larger, clinically annotated cohorts.
Importantly, EGFR amplification did not translate into a uniform phosphoproteomic phenotype. Protein-abundance-adjusted phosphoproteomic profiles showed only partial separation according to amplification status, consistent with substantial intertumoral heterogeneity. This observation illustrates the potential added value of phosphoproteomics for molecular characterization. Genomic alterations establish the presence of a molecular driver, whereas protein abundance and phosphorylation provide information on how that alteration is functionally expressed within an individual tumor. Tumors sharing the same genomic alteration may therefore differ substantially in downstream pathway utilization. Phosphoproteomic profiling may consequently provide an orthogonal functional layer that complements, rather than duplicates, genomic classification.
The translational relevance of this approach is supported by its compatibility with routinely archived FFPE material and its ability to interrogate signaling networks at the level of site-specific phosphorylation. Recent high-throughput workflows further demonstrate that substantial proteomic and phosphoproteomic depth can be achieved from clinically derived FFPE specimens [ 7 ]. Beyond technical feasibility, emerging precision-oncology frameworks increasingly explore how proteomic and functional signaling information can complement genomic findings in molecular tumor boards and therapeutic prioritization [ 8 , 20 ].
The translational potential of phosphoproteomic profiling is further supported by studies in tumor entities beyond glioblastoma. In cholangiocarcinoma, phosphoproteomic profiling combined with computational analysis identified patient-specific signaling patterns and candidate drug sensitivities, with predicted responses subsequently supported in cellular models [ 9 ]. In hepatocellular carcinoma, phosphoproteomic profiling defined biologically and clinically distinct subtypes and identified candidate therapeutic vulnerabilities, including a kinase-targeted treatment that was subsequently evaluated in cell-line and patient-derived xenograft models [ 27 ]. Together, these studies illustrate how phosphoproteomic information may extend molecular characterization toward the functional prioritization of signaling pathways and therapeutic hypotheses.
A clinically relevant example of functional pathway-based stratification is provided by the N 2 M 2 /NOA-20 umbrella trial, in which patients with glioblastoma and with activated mTOR signaling, as assessed by phospho-mTOR, were selected for treatment with temsirolimus [ 24 ]. This illustrates how assessment of pathway activation may provide therapeutic information beyond genomic alterations alone. More quantitative phosphoproteomic approaches could potentially extend such strategies by simultaneously assessing multiple signaling pathways, although prospective validation and clinically applicable thresholds will be required.
At present, however, analytical complexity, infrastructure requirements, and costs of mass-spectrometry-based phosphoproteomics are likely to limit its application to selected clinical and translational settings. In addition, several challenges remain before phosphoproteomic information can be incorporated into routine neuropathological diagnostics. Kinase-substrate enrichment infers kinase activity from the coordinated behavior of annotated phosphosites rather than measuring enzymatic activity directly, and pathway-level associations require validation in larger independent cohorts and, where appropriate, by orthogonal approaches. In addition, standardization of tissue processing, analytical pipelines, quantitative thresholds, and reporting frameworks will be important for broader clinical implementation [ 1 ].
Several limitations of the present study should be considered. The cohort comprised only ten tumors and was intentionally centered on a single, well-characterized genomic alteration. Accordingly, individual differential phosphosites and inferred kinase activities should be regarded as hypothesis-generating rather than candidate biomarkers. Bulk tissue analysis also does not resolve spatial, cellular, or subclonal heterogeneity, which is particularly relevant in glioblastoma. Because phosphosite abundance is influenced by both total protein abundance and phosphorylation state, phosphosite intensities were adjusted for the abundance of the corresponding protein measured in the matched global proteome. This adjustment reduces the contribution of differences in total protein abundance to phosphosite-level changes; however, it does not constitute a direct measurement of phosphorylation stoichiometry. Finally, extension to larger cohorts and additional molecularly defined CNS tumor entities will be required to determine which functional signaling features are reproducible and of diagnostic or therapeutic relevance.
In conclusion, proteomic and phosphoproteomic profiling of routine FFPE glioblastoma tissue recovers biologically coherent molecular and signaling consequences associated with a defined genomic alteration while revealing functional heterogeneity beyond genomic classification. Rather than representing an alternative to sequencing, copy number analysis, or DNA methylation profiling, phosphoproteomics provides complementary information on the downstream functional state of the tumor. Integration of this functional layer with established molecular diagnostics may enable a more comprehensive characterization of CNS tumors that connects molecular identity with pathway activity.
Data availability
The processed proteomic and phosphoproteomic data generated in this study and the analysis code used for downstream data processing and statistical analyses are publicly available at https://github.com/FriedelDennisMNP/Functional_phosphoproteomic_profiling_of_routine_FFPE_CNS_tumor_tissue . Additional data supporting the findings of this study are provided in the Supplementary Tables.