- 按临床表型把散发性 ALS 分为 UMN 为主型(UMN-p)、LMN 为主型(LMN-p)及典型表型,在颈、胸、腰髓三个节段比较皮质脊髓侧束的髓鞘脱失、轴索变性、神经炎症与 TDP-43 病理。
- UMN-p 病例皮质脊髓侧束髓鞘脱失明显,各直径段轴索均显著减少且重于 LMN-p;轴索丢失腰髓重于颈髓——呈长度依赖性梯度,支持「逆行性死亡」(dying back)。
- 严重髓鞘与轴索丢失区可见一群泡沫样、炎性小胶质细胞;皮质脊髓侧束与前束 UMN 轴索内 TDP-43 可测量性增加。
- 附 5 幅图、3 个表(病例信息、各节段髓鞘脱失发生率、「逆行性死亡」与「顺行性死亡」概念辨析)。
收录范围:Acta Neuropathologica 开放获取全文(CC BY 4.0)摘要、引言、材料与方法、结果、讨论、结论,5 幅图及 3 个表;缩略语表、参考文献、致谢、基金、作者信息与声明未收录,方括号数字为原文参考文献序号。
摘要
肌萎缩侧索硬化(ALS)中上运动神经元(UMN)变性的标志性神经病理特征,是皮质脊髓侧束(CST)的“硬化”;该束是连接 UMN 与下运动神经元(LMN)的主要轴索通路。然而,自十九世纪 Charcot 最初描述以来,很少有研究将临床 UMN 表型与相应的神经病理发现直接关联。我们检查了 UMN 为主型(UMN-p)表型 ALS 患者颈、胸、腰段脊髓皮质脊髓侧束的病理,并与 LMN 为主型(LMN-p)表型患者的相应病理进行了比较。我们评估了髓鞘脱失、轴索变性、神经炎症及 TDP-43 病理。与 LMN-p 病例及对照相比,UMN-p ALS 病例的脊髓皮质脊髓侧束呈现显著的髓鞘脱失,与临床表型分型一致。定量分析显示,UMN-p ALS 在所有轴索直径范围内均有显著的轴索丢失,且较 LMN-p ALS 更为严重。重要的是,腰髓轴索丢失比颈髓更为明显。我们发现了一群独特的泡沫样炎性小胶质细胞,局限于 UMN-p ALS 中髓鞘和轴索严重丢失的区域。皮质脊髓侧束和皮质脊髓前束的 UMN 轴索中,TDP-43 存在可测量的增加。总之,ALS 的“侧索硬化”与临床推断的 UMN 变性相关。它由髓鞘脱失、远端重于近端的轴索变性、CST 内炎性小胶质细胞活化以及轴索 TDP-43 异常增加共同构成。运动轴索丢失的长度依赖性梯度支持逆行性死亡(“dying back”)过程。讨论部分详细比较了顺行性死亡(“dying forward”)与顺行性死亡。轴索和髓鞘丢失与小胶质细胞异常活动之间的关联,显示了 UMN 轴索变性中的胶质细胞-轴索相互作用,后者为 ALS UMN-p 样本全部三个脊髓节段的 CST(侧索硬化),但并未确立因果关系。
引言
肌萎缩侧索硬化中“侧索硬化”的最初描述来自1860 年代的 Charcot;他注意到,因进行性运动功能恶化而死亡的患者,除前角神经元丢失外,脊髓侧索还出现硬化这一病理改变 [17, 18]。这些侧索随后被确认为皮质脊髓侧束(CST),其中的轴索从运动皮质的上运动神经元(UMN)胞体延伸至脊髓前角的下运动神经元(LMN)[24, 31, 69]。UMN 轴索自皮质下行至颈髓-延髓锥体,其中约 75–90% 在此交叉,形成皮质脊髓侧束,并在外侧索中下行。其余 10–25% 的轴索不交叉,在同侧皮质脊髓前束中下行 [23, 44, 45, 56, 59]。Charcot 最初推测,标志性的侧索硬化是前角细胞变性的主要驱动因素——因此,这种硬化被认为具有致肌萎缩性。这些描述作出时的组织学技术,与现代技术相比尚为粗糙。当今 ALS 领域的大量研究以神经元为中心,关注运动神经元变性和 TDP-43 异常;ALS 的神经病理标志为 TDP-43 从细胞核转位、在细胞质中蓄积并发生磷酸化。直到相对较近的时期,对轴索功能 [19, 54, 60] 以及 TDP-43 轴索运输和蓄积 [3, 10, 11, 43, 49, 57] 的研究才有所增加。研究 ALS 中 UMN 轴索最直接的方式,是从神经病理学角度研究侧索硬化——ALS 生物学与神经病理之间的关系尚不明确,而且 UMN 与 LMN 之间可能存在差异。在本研究中,我们对皮质脊髓侧束中的侧索硬化进行了表征。作为研究起点,我们比较了临床表型谱两端的纤维束——临床功能缺损以 UMN 为主的患者脊髓(UMN-p ALS),以及临床功能缺损以 LMN 为主的患者脊髓(LMN-p ALS)。我们评估了髓鞘脱失、轴索变性、神经炎症及 TDP-43 病理。
材料与方法
ALS 患者群体及组织
所有神经组织均通过符合机构审查委员会(IRB)及《健康保险流通与责任法案》(HIPAA)要求的流程获得。尸检组织的获取及去标识化,经 Benaroya 研究所(2003–2011 年)或加利福尼亚大学圣迭戈分校(2011 年以后)的 IRB 批准,遵循《赫尔辛基宣言》的相关指南和法规。去标识化尸检组织的后续使用遵循标准的联邦政策和法规,不被视为人体受试者研究。来自散发性 ALS(sALS)患者的福尔马林固定、石蜡包埋(FFPE)颈髓、胸髓及腰髓。所有患者生前均由同一名临床神经科医师(JR)依据临床检查及临床体征进行分类。提示 UMN 变性的体征包括精细熟练动作丧失、痉挛状态、反射亢进和病理反射;提示 LMN 变性的体征包括疾病起病时的无力、萎缩和肌束颤动。UMN 和 LMN 变性对总体临床功能缺损的贡献按五级量表记录:UMN ≫ LMN、UMN > LMN、UMN = LMN、UMN < LMN 和 UMN ≪ LMN [2, 31]。大多数病理研究选取两端的病例(UMN ≫ LMN,n = 6;UMN ≪ LMN,n = 7),下文分别称为 UMN-p 和 LMN-p。“典型”ALS 为中间三个等级(UMN > LMN、UMN = LMN 或 UMN < LMN,n = 6),另有无神经系统疾病病理证据的对照患者(n = 13)(表 1)。若非临床病程进展迅速,且有时同时存在某些 LMN 体征,UMN-p 组或可归类为原发性侧索硬化(PLS)。一些临床神经科医师会将 LMN-p 称为进行性肌萎缩(PMA)。为方便查阅,列出了患者的人口学资料(表 1)。
| 编号 | 主要诊断 | 患者尸检编号 | 运动表型:UMN-p 或 LMN-p 临床体征 | 起病部位 | 病程(年) | 年龄 | 性别 | 开展研究的实验室 |
|---|---|---|---|---|---|---|---|---|
| 1 | sALS | 119 | UMN ≫ LMN | 上肢 | 2.5 | 46 | 男 | UIC 和 UCSD |
| 2 | sALS | 25 | UMN ≫ LMN | 上肢 | 0.9 | 53 | 男 | UIC 和 UCSD |
| 3 | sALS | 46 | UMN ≫ LMN | 上肢 | 5 | 51 | 女 | UIC |
| 4 | sALS/C9orf72 | 82 | UMN ≫ LMN | 延髓 | 2 | 56 | 女 | UIC 和 UCSD |
| 5 | sALS/C9orf72 | 117 | UMN ≫ LMN | 延髓 | 1 | 66 | 女 | UIC |
| 6 | sALS | 12 | UMN ≫ LMN | 弥漫性 | 1.25 | 60 | 男 | UIC |
| 7 | sALS | 108 | LMN ≫ UMN | 下肢 | 9 | 69 | 男 | UIC 和 UCSD |
| 8 | sALS | 109 | LMN ≫ UMN | 下肢 | NA | 49 | 男 | UIC |
| 9 | sALS | 112 | LMN ≫ UMN | 下肢 | 4 | 54 | 女 | UIC |
| 10 | sALS | 29 | LMN ≫ UMN | 下肢及足 | 3.0 | 77 | 女 | UIC |
| 11 | sALS | 107 | LMN ≫ UMN | 躯干 | 0.75 | 74 | 男 | UIC 和 UCSD |
| 12 | sALS | 22 | LMN ≫ UMN | 呼吸及手 | 3.25 | 72 | 男 | UIC |
| 13 | sALS | 127 | LMN ≫ UMN | 呼吸及右上肢 | 1.5 | 67 | 男 | UCSD |
| 14 | sALS | 32 | LMN > UMN(典型) | 呼吸及躯干 | 1.5 | 71 | 男 | UCSD |
| 15 | sALS | 33 | LMN = UMN(典型) | 上肢 | 6.5 | 54 | 男 | UCSD |
| 16 | sALS/FTD | 93 | UMN > LMN(典型) | FTD/延髓 | 1.75 | 71 | 男 | UCSD |
| 17 | sALS | 128 | LMN > UMN(典型) | 右足 | 2 | 69 | 女 | UCSD |
| 18 | sALS | 132 | LMN = UNM(典型) | 右上肢 | 12 | 64 | 女 | UCSD |
| 19 | sALS/FTD | 134 | UMN > LMN(典型) | 下肢及延髓 | 1.9 | 78 | 女 | UCSD |
| 20 | 对照 | 20 | NA | NA | NA | 84 | 男 | UIC |
| 21 | 对照 | 40 | NA | NA | NA | 67 | 男 | UIC 和 UCSD |
| 22 | 对照 | 77 | NA | NA | NA | 68 | 男 | UIC 和 UCSD |
| 23 | 对照 | 4 | NA | NA | NA | 75 | 男 | UIC |
| 24 | 对照 | 37 | NA | NA | NA | 57 | 男 | UIC 和 UCSD |
| 25 | 对照 | 65 | NA | NA | NA | 82 | 男 | UIC |
| 26 | 对照 | 115 | NA | NA | NA | 94 | 男 | UIC |
| 27 | 对照 | 76 | NA | NA | NA | 76 | 女 | UIC 和 UCSD |
| 28 | 对照 | 78 | NA | NA | NA | 58 | 女 | UIC |
| 29 | 对照 | 19 | NA | NA | NA | 80 | 女 | UIC |
| 30 | 对照 | 44 | NA | NA | NA | 80 | 女 | UCSD |
| 31 | 对照 | 83 | NA | NA | NA | 63 | 女 | UCSD |
| 32 | 对照 | 103 | NA | NA | NA | 92 | 女 | UCSD |
组织病理学
将 FFPE 人脊髓组织块横向切成 5 µm 厚的切片,用二甲苯脱蜡,再经梯度乙醇溶液水化。随后按照制造商说明,采用劳克坚牢蓝-过碘酸雪夫(LFB-PAS)染色(Poly Scientific,纽约州贝肖尔)显示髓鞘 [62, 63]。使用 Leica DM5500B 显微镜(Leica Microsystems Inc.,德国韦茨拉尔)获取完整脊髓的 20 × 数字图像。
免疫荧光
为检查 ALS 及对照患者的轴索变性和髓鞘形成,使用以下一抗检测脊髓白质中神经丝重链和髓鞘碱性蛋白的表达:抗神经丝重链抗体(1:50,小鼠单克隆;克隆 RT97,DSHB,艾奥瓦州艾奥瓦城)和抗髓鞘碱性蛋白(MBP)抗体(1:200,货号 A0623,兔多克隆,Dako)。随后,将切片与 Alexa-488 标记的山羊抗兔抗体(1:250,编号:111-545-144,Jackson Immuno Inc.)及生物素化山羊抗小鼠抗体(1:250,编号:115-065-062,Jackson Immuno Inc.)孵育 2 h,再与 Alexa-594 偶联的链霉亲和素孵育 1 h(1:500,编号:016-580-084,Jackson Immuno Inc.)。使用抗荧光淬灭封片剂封片(货号 H-1200,Vector Laboratories,加利福尼亚州伯灵格姆)。
分别采用 Iba-1(兔多克隆,1:500,货号 019-19741,Wako Inc.,弗吉尼亚州里士满)和 Neurotracer™ 530/560 红色荧光尼氏染料(1:500,货号 N21482,Fisher Scientific,美国)对组织中的小胶质细胞和运动神经元进行染色。抗原修复(10 mM EDTA,pH6.0)后,用封闭液(含 5% 正常山羊血清、5% BSA 和 0.05% Triton X-100 的 TBS,pH7.4)在室温下封闭非特异性结合位点一小时;用封闭液稀释一抗,将其加至切片上于 4 °C 孵育过夜,随后将切片与山羊抗兔 Alexa Fluor 488(1:500,Invitrogen,加利福尼亚州卡尔斯巴德)孵育。之后用 Neurotracer 530/615(1:500,货号 N21482,Fisher Scientific,美国)复染切片,以 0.3% 苏丹黑处理以尽量减少自发荧光,并用抗荧光淬灭封片剂封片(货号 H-1000,Vector laboratories,加利福尼亚州伯灵格姆)[22]。
为检查轴索 TDP-43,对来自 sALS 及对照患者(表 1,UCSD 中心)的 6 µm 厚 FFPE 胸髓轴位横切片,采用抗磷酸化神经丝重链(pNF-H)(Chemicon #AB5539,1:1000)及抗 TDP-43(ProteinTech #10782-2-AP,1:3000)进行双重免疫标记。此前已验证,pNF-H 抗体可靶向人组织中的有髓及无髓轴索 [7, 30]。采用 AlexaFluor 568 抗兔 IgG(Invitrogen #A10042,1:250)及 488 抗鸡 IgY(Invitrogen #A78948,1:500)显示一抗。使用含 DAPI 的 ProLong Gold 抗荧光淬灭封片剂(Invitrogen #P36935)将盖玻片封于载玻片上,并在 UCSD 显微成像核心平台使用 Olympus VS200 玻片扫描仪,以相同的曝光设置(DAPI:21.067 ms;FITC:355.26 ms,TRITC:227.752 ms)成像。
免疫组织化学
使用人 CD68 特异性抗体(小鼠 IgG1,1:20,目录号 N1577;DAKO,加利福尼亚州卡平特里亚)鉴定小胶质细胞。使用抗人胶质纤维酸性蛋白(GFAP)抗体(兔多克隆,1:100;货号 Z0334,批号 00076541,DAKO)标记星形胶质细胞。一抗用封闭液(含 10% 正常山羊血清、0.05% Triton X-100 的磷酸盐缓冲盐水)稀释,于 4 °C 孵育过夜,随后与山羊抗兔 Alexa Fluor 488(1:100;Invitrogen,加利福尼亚州卡尔斯巴德)孵育。CD68 免疫染色使用生物素偶联的山羊抗小鼠抗体作为二抗;按照制造商说明,采用酪胺信号放大试剂盒(1:250;Invitrogen)放大信号 [62]。
图像定量分析
使用 Leica DM5500B 荧光显微镜(Leica Microsystems Inc.,德国韦茨拉尔)获取完整脊髓的数字图像,并使用 Q(Imaging)制冷 CCD 相机(序列号:Q36526,加拿大)的多通道选项自动扫描。在唯一涉及操作者自主判断的步骤中,先使用对照患者组织设定全部图像参数,包括自动曝光设置、目标强度、像素合并、相机区域、背景扣除、阴影校正、颜色选项卡、特殊选项卡和温度,然后对所有成像样本使用相同设置。所有图像的尺寸相同。使用 Metamorph Software 7.8 进行颜色通道分离,分析皮质脊髓侧束、后索(DC)及前角第 VIII&IX 层区域中特异性荧光标记的分子。
轴索定量
对每位患者的每个脊髓节段,在神经丝(NF,RT97)通道中,从左右两侧皮质脊髓侧束随机选取四个感兴趣区(ROI),或从双侧 DC 随机选取三个 ROI。采用 Metamorph 图像分析软件,在盲法条件下为每个 ROI 确定轴索大小阈值,并以像素面积定量轴索大小。将原始数据导出至 Microsoft Excel,使用 Excel 数据分析工具库进行分析。以 20–500 像素的分箱范围,根据轴索像素面积原始数据生成轴索频数直方图。在每个患者组内评估可重复性(n = 6–10)。
具体而言,使用 Metamorph(Molecular Devices Inc.,美国宾夕法尼亚州唐宁敦)软件中的自定义脚本进行轴索(NF RT97)定量。使用原始单一红色(RT97)图像,消除背景荧光,然后自动将数据导出至 Excel,生成每幅图像阳性轴索密度的相应数据。简而言之,通过 20 个亮目标和暗目标的平均灰度,确定 RT97 阳性染色的亮、暗两个阈值,并将每幅图像的阈值记录在笔记本中。信号高于阈值的像素构成目标轴索。为消除背景噪声,将暗目标定义为总面积介于 20 与 1E+00.8 像素之间、形状因子介于 0.7 与 1 之间、平均灰度介于 0 与 1E+00.7 之间的目标。暗目标是指总面积介于 10 与 1E +00.8 之间、形状因子介于 0.7 与 1 之间、平均灰度介于 0 与 1500 像素之间的目标。将暗目标的图像阈值、综合形态测量分析和日志数据导入 Excel。使用显示图形、填充区域及选择内部区域功能,创建并填充暗目标周围的所有选定区域。为分离暗目标,调整图像阈值以排除亮目标,留下晕环样结构。随后应用平均灰度阈值以去除这些晕环目标。然后,将暗目标的综合形态测量分析和日志数据导入 Excel。最后,合并亮目标和暗目标的列表。
从 Metamorph 软件导出轴索大小原始数据,并以 Excel 格式汇总分析。使用 Excel 内置的“数据分析”工具,从可用选项列表中选择直方图功能进行数据分析。在直方图对话框中,输入轴索大小原始值(像素面积)及预先设定的分箱范围。上述 Excel 文件包含轴索数量、轴索总面积、轴索平均灰度、轴索总灰度及轴索形状因子的数值。使用轴索总面积生成直方图,以显示每幅图像中一定直径范围内轴索的频数。为获得各轴索直径范围的平均轴索频数,计算每位患者脊髓中随机选取的四个区域(皮质脊髓侧束内)或三个区域(DC 内)的轴索频数均值。
采用 20、40、60、80、100、120、140、160、180、200 和 500 像素的像素面积分箱,将轴索大小分布绘制成直方图(图 2A),对应的轴索直径约为 3.2、5.6、6.5、7.2、7.9、8.5、9.1、9.7、10.2 和 16.4 µm,按以下换算公式计算:2 × √((0.642 × 像素面积) / 3.14)(图 2B–D)。分别计算 UMN-p ALS(n = 6)、LMN-p ALS(n = 6)及对照(n = 10)在各分箱范围内的平均轴索像素面积值。针对对照、UMN-p ALS 和 LMN-p ALS 各组,分别为每个脊髓节段(颈、胸及腰段)生成轴索频数直方图。
将各脊髓节段的 ALS 组数值相对于相应对照值进行归一化,并以百分比表示(对照 = 100%)。在生成的 Excel 直方图中,分析各轴索直径的平均归一化值。在 3.2–16.4 µm 的轴索直径范围内,比较归一化后的 UMN-p 与 LMN-p ALS 数值。采用对数(log2)标度,以便比较跨越较大数值范围的数据。计算 UMN-p ALS 脊髓中运动轴索(皮质脊髓侧束)和感觉轴索(DC)的这些数值,在相对于对照患者相应轴索大小归一化后,与 LMN-p ALS 脊髓中相应轴索直径进行比较。
在每个脊髓节段(颈、胸、腰段),分析各脊髓皮质脊髓侧束内随机选取的共 48 个区域(12 名 ALS 患者)及 40 个区域(10 名对照患者)。在每个脊髓节段,分析 DC 内随机选取的共 36 个区域(来自 12 名 ALS 患者)及 30 个区域(来自 10 名对照患者)。
小胶质细胞定量
为定量皮质脊髓侧束中的小胶质细胞,在盲法条件下完成人工计数。在每个脊髓节段的切片上,从左右皮质脊髓侧束内各随机选取一个区域取样。随机选取区域为直径 96 像素的圆形。使用 Metamorph 的“手动目标计数”功能,对每个取样皮质脊髓侧束中的小胶质细胞进行定量。小胶质细胞的判定标准包括呈圆形,形态为环状或实心状,细胞大小不影响判定。计算每位患者每个脊髓节段每侧皮质脊髓侧束(左侧和右侧)的小胶质细胞平均数量。
轴索 TDP-43 定量
在 QuPath-0.6.0-rc4 [5] 和 Fiji 1.54p 上进行图像分析。在每幅图像上估计感兴趣区(ROI)——皮质脊髓侧束、皮质脊髓前束及 DC——的边界,并进行手动标注。为计算这些白质束中轴索 TDP-43 的出现频率,随后人工计数出现在轴浆中的 TDP-43 信号(即与 pNF-H 共定位的信号),并按各 ROI 的面积进行归一化。对于灰质,手动分割中央管后缘腹侧的区域,并定量胞体外的 TDP-43 信号。随后,根据 pNF-H 强度及形态筛选候选信号,以排除与轴索无关的信号。
统计分析
对于轴索定量,采用双因素方差分析(ANOVA)评估三组间的统计学差异,两组 ALS 之间的比较采用 Student t 检验。对于轴索 TDP-43,采用 Kruskal–Wallis 检验或 Mann–Whitney 检验评估统计学显著性。显著性阈值设为 p < 0.05 和 p < 0.001。
结果
具有 UMN-p 症状而非 LMN-p 症状的 ALS 患者脊髓皮质脊髓侧束髓鞘脱失严重
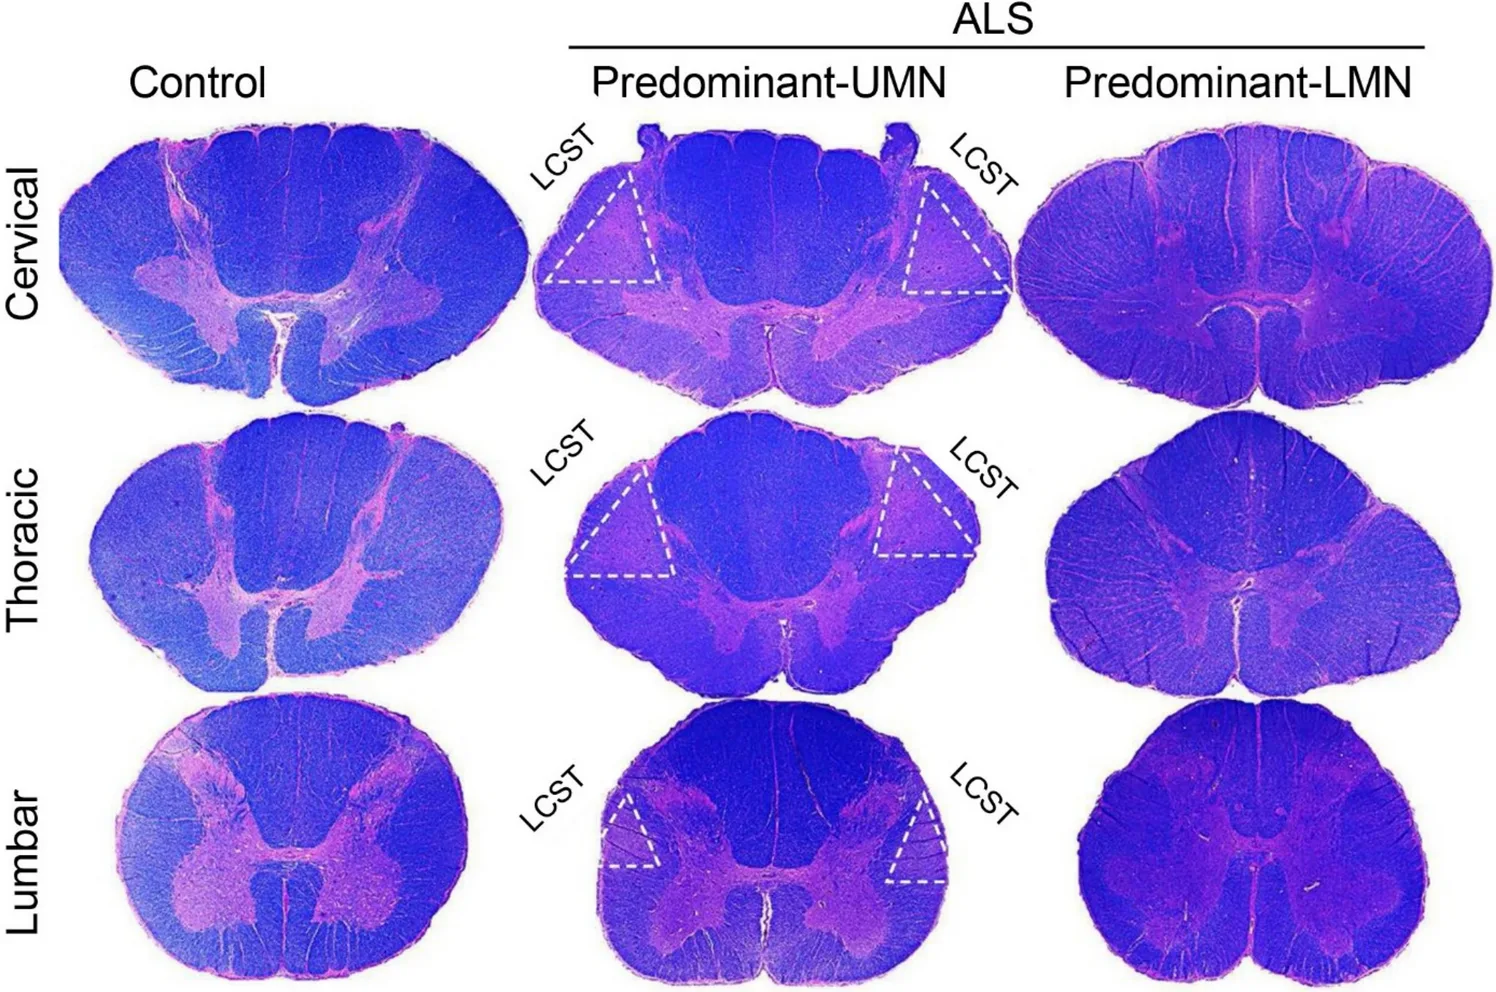
我们首先采用 LFB-PAS 组织染色,研究 CST 在三个节段(颈、胸及腰段)的髓鞘改变与临床特征的关系(图 1)。与 LMN-p ALS 脊髓相比,UMN-p ALS 脊髓的皮质脊髓侧束有明显髓鞘脱失,因此与临床表型分型明确相关,并支持临床对 UMN 变性的推断。我们发现,所有具有 UMN-p 症状的 ALS 患者在全部三个脊髓节段的皮质脊髓侧束中均有严重髓鞘脱失(染为粉红色)(图 1 和表 2)。相比之下,在具有 LMN-p 症状的 ALS 患者中,全部三个脊髓节段的皮质脊髓侧束均呈现与其他白质区域相似的特征,与对照患者中所见相似(图 1 和表 2)。值得注意的是,UMN-p 患者出现髓鞘脱失及病理损伤时,在全部三个脊髓节段呈现“全或无”模式。
| 尸检样本 | 脊髓 | 下行束(运动轴索) | 上行束(感觉轴索) | |
|---|---|---|---|---|
| 皮质脊髓侧束 | 皮质脊髓前束 | 后索 | ||
| 对照(n = 10) | 颈段 | 0/10 | 0/10 | 0/10 |
| 胸段 | 0/10 | 0/10 | 0/10 | |
| 腰段 | 0/10 | 0/10 | 0/10 | |
| UMN-p ALS(n = 6) | 颈段 | 6/6 | 6/6 | 0/6 |
| 胸段 | 6/6 | 6/6 | 0/6 | |
| 腰段 | 6/6 | 6/6 | 0/6 | |
| LMN-p ALS(n = 6) | 颈段 | 0/6 | 0/6 | 0/6 |
| 胸段 | 0/6 | 0/6 | 0/6 | |
| 腰段 | 1/6 | 0/6 | 0/6 | |
皮质脊髓侧束的轴索丢失涉及所有大小的轴索,且远端更为严重
此前已证实,皮质脊髓侧束中的大直径轴索选择性丢失,与 UMN 和 LMN 之间直接单突触连接的选择性变性一致 [39, 51, 64, 70]。我们建立了一种利用轴索频数直方图评估轴索大小分布的定量方法。初步观察表明,UMN-p ALS 的 CST 运动轴索在所有大小范围内均严重丢失,而在腰髓节段,UMN-p ALS、LMN-p ALS 及对照个体的 DC 感觉轴索大小分布仍然相似(图 2a)。随后,我们比较了全部三组在三个脊髓节段的运动轴索频数(图 2b)。我们观察到,与对照组及 LMN-p ALS 组相比,UMN-p ALS 组在颈、胸和腰段均有较小直径 UMN 轴索(3.2–5.6 µm)丢失(图 2b)。尽管 LMN-p ALS 组相对于对照也表现出较小直径 UMN 轴索减少,但其丢失程度不及 UMN-p ALS 组明显(图 2b)。为比较两种 ALS 临床表型,将各脊髓节段 ALS 样本中各直径的运动轴索计数相对于相应对照进行归一化。定量结果显示,在全部三个脊髓节段(颈、胸及腰段),UMN-p ALS 在所有直径范围内的 UMN 轴索丢失均多于 LMN-p ALS(图 2c)。
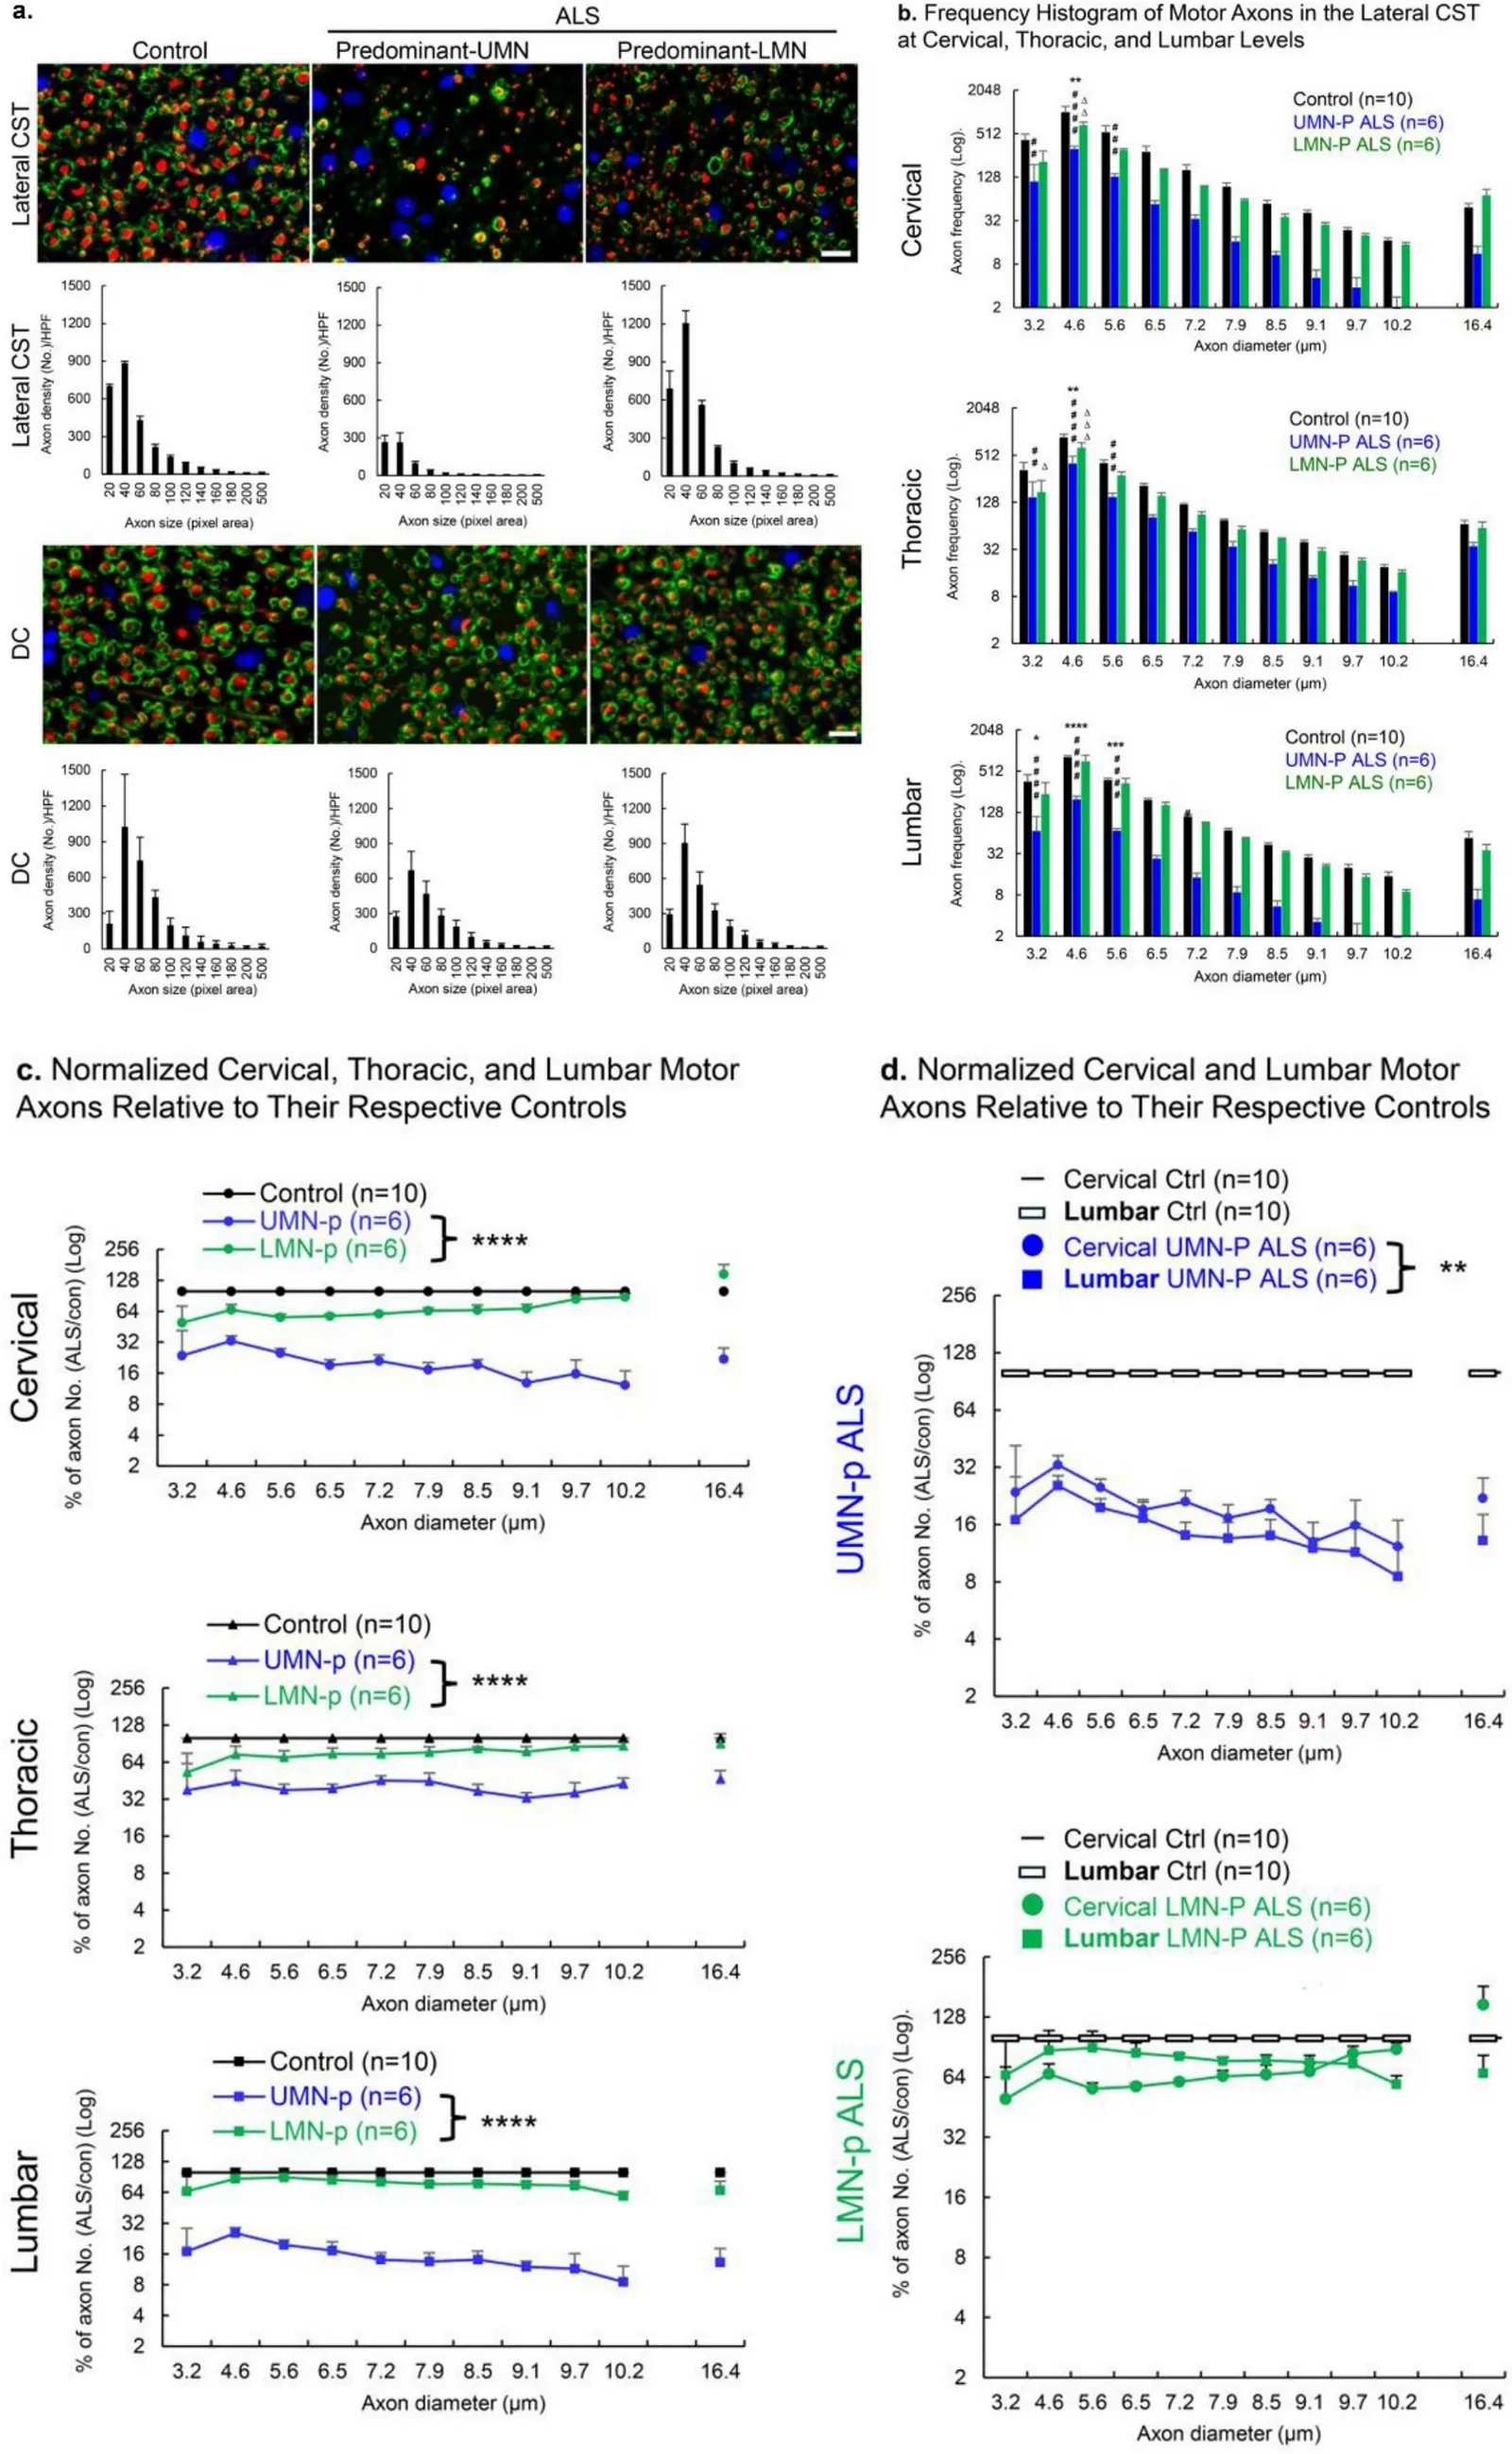
我们比较了颈髓与腰髓节段的 UMN 轴索丢失(图 2d)。在 UMN-p ALS 组中,皮质脊髓侧束内所有 UMN 轴索大小范围均呈现腰段相对于颈段的梯度性丢失(图 2d,上图),而 LMN-p ALS 组未检出这种梯度(图 2d,下图)。因此,这提示 UMN-p ALS 患者的 UMN 轴索丢失在轴索投射的远端更为严重,表明存在远端轴索丢失 [15]。
UMN-p ALS 患者皮质脊髓侧束中增多的泡沫样小胶质细胞与髓鞘和 UMN 轴索丢失共定位
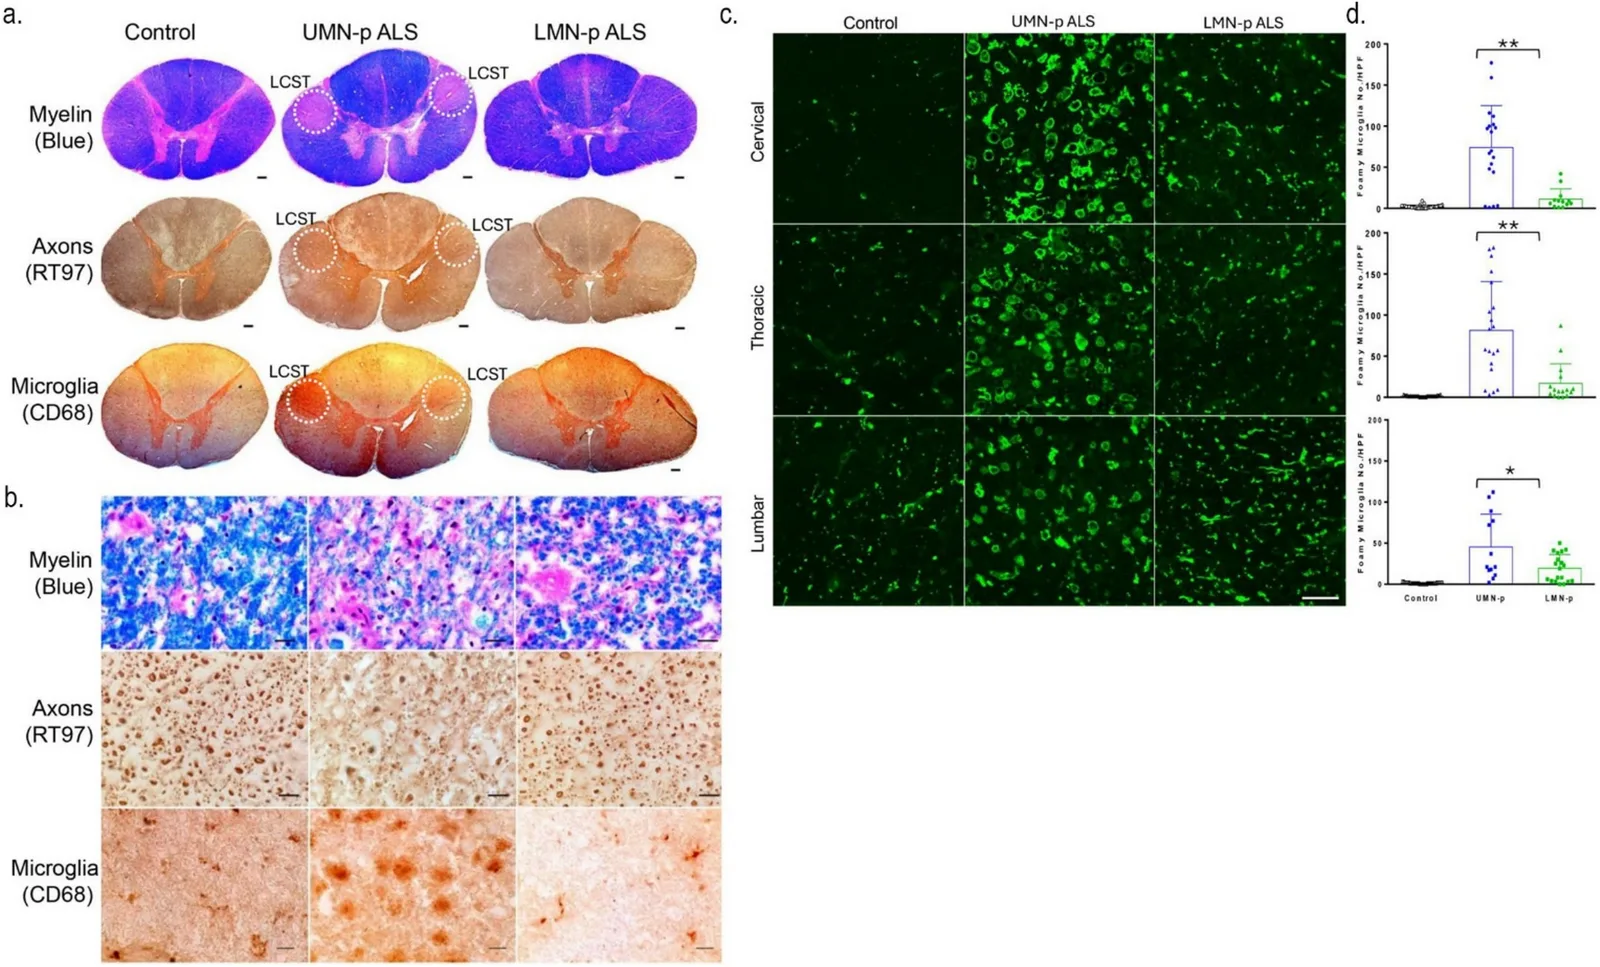
泡沫样小胶质细胞以富含脂质的外观及脂滴蓄积为特征,是 CST 轴索完整性丧失及变性的一部分 [72],促进疾病进展以及运动神经元和轴索丢失。鉴于病程中具有 UMN-p 临床体征的 ALS 患者皮质脊髓侧束存在整体髓鞘脱失(图 1)及所有大小 UMN 轴索减少(图 2),我们检查了这些病变区域内是否发生炎性胶质细胞活化。通过 CD68 和 Iba1 阳性染色(图 3a、c)鉴定出强烈的小胶质细胞/巨噬细胞信号,与 UMN-p ALS 患者皮质脊髓侧束的髓鞘脱失和轴索变性共定位。皮质脊髓侧束的高倍图像(图 3b)显示,髓鞘脱失与不同大小的轴索丢失同时存在,并伴随仅见于 UMN-p ALS 患者的泡沫样小胶质细胞。定量结果显示,与 LMN-p ALS 及对照患者相比,UMN-p ALS 患者在全部三个脊髓节段皮质脊髓侧束内的圆形泡沫样小胶质细胞(Iba1+ 细胞)显著增多(图 3d)。此外,两种 ALS 表型(UMN-p 与 LMN-p)之间,病变区或 DC 内 GFAP 阳性反应性星形胶质细胞未见变化(数据未显示)。这些发现支持泡沫样小胶质细胞参与 ALS 发病机制这一公认认识,将 UMN-p ALS 患者下行 UMN 轴索束中的髓鞘脱失与运动轴索变性及神经炎症联系起来,但未回答这些变化是原发性还是反应性。
皮质脊髓前束中运动轴索丢失的不同程度丢失及 DC 中感觉轴索的不同程度丢失
我们还检查了皮质脊髓前束,这是一条较少受到认识的、承载来自运动皮质轴索的纤维束。尽管观察到髓鞘脱失(图 1 和表 2),但采用相同归一化方法对轴索直径进行定量所得结果存在变异,与 CST 中所见并不一致(数据未显示)。
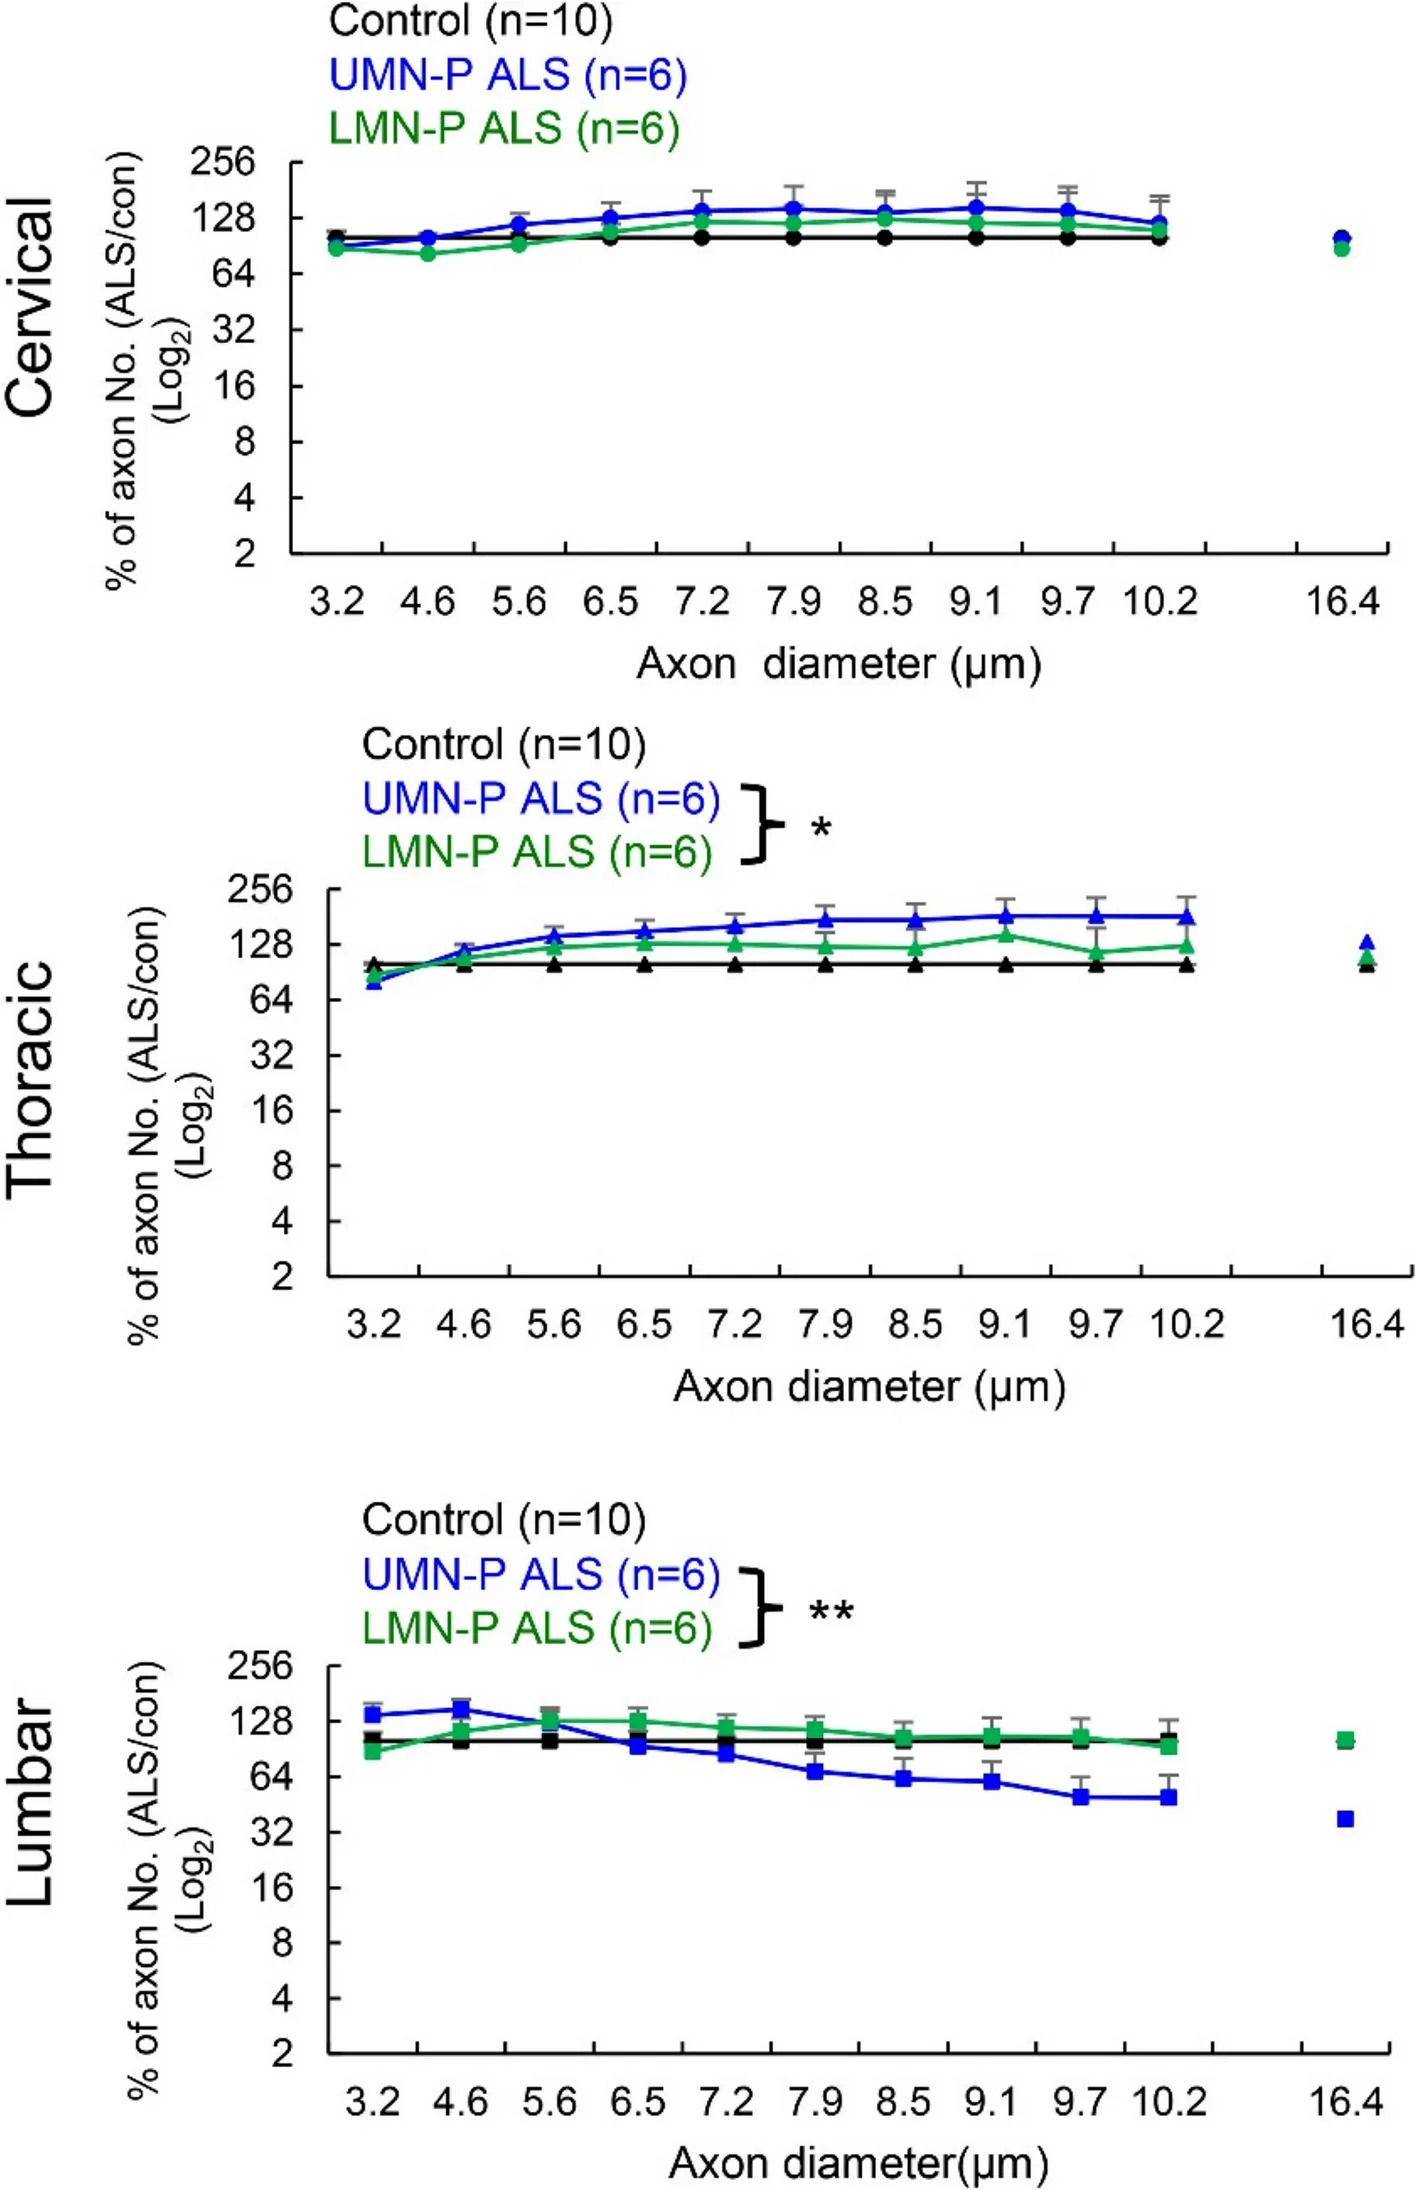
作为对照,我们还检查了 DC 中的感觉轴索,以与皮质脊髓侧束的运动轴索进行比较。有趣的是,对三个脊髓节段 DC 中感觉轴索直径的定量显示,仅 UMN-p ALS 的腰段存在显著的上行轴索丢失(图 4,下图),而 LMN-p ALS 样本在任何节段均未见感觉轴索丢失。值得注意的是,DC 中未见显著髓鞘脱失(图 1 和表 2),且两种 ALS 表型及对照患者的 DC 感觉轴索束中均无泡沫样小胶质细胞(数据未显示)。这一发现提示,感觉轴索丢失可能代表早期阶段,因为组织染色未显示 DC 中有髓鞘脱失或小胶质细胞活化。
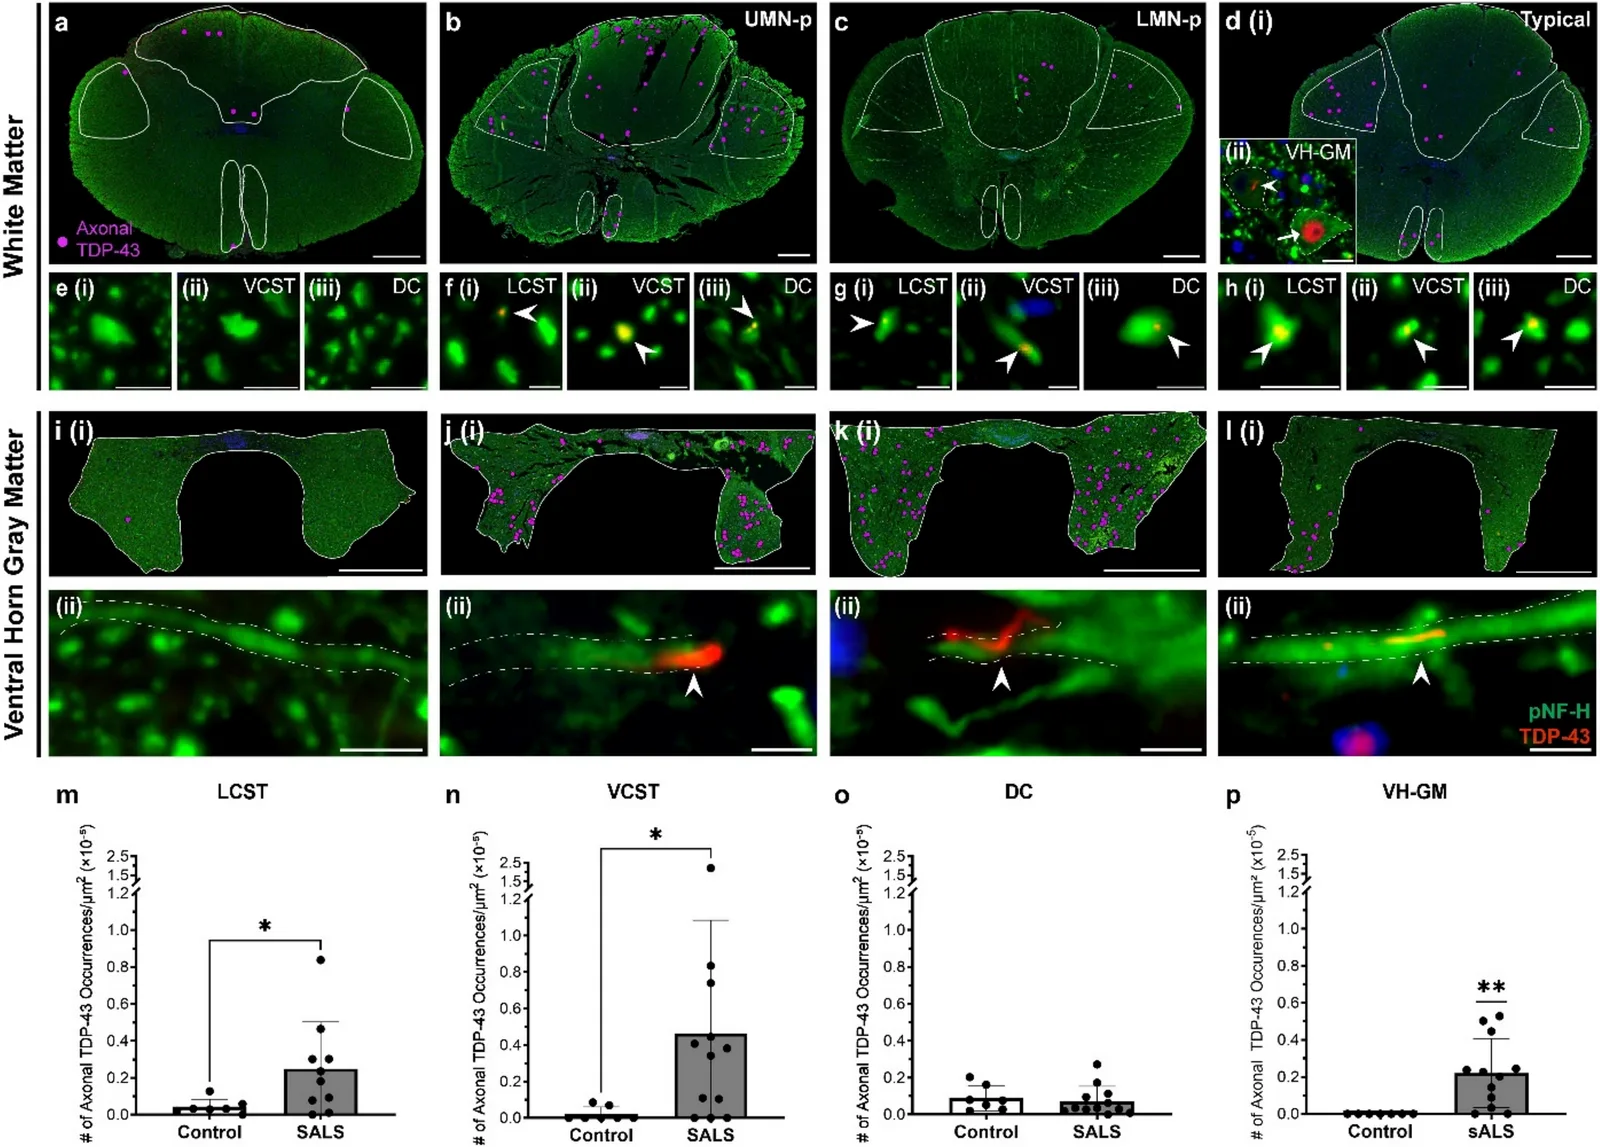
与对照相比,sALS 病例的 CST 及前角灰质中更常观察到轴索 TDP-43
TDP-43 从细胞核错误定位、在细胞质中聚集并发生磷酸化,是胞体中 ALS 神经病理的标志。已在 LMN 轴索中鉴定出磷酸化 TDP-43 聚集 [3, 10, 11, 43, 49, 57]。三个独立实验室(Ravits、Loeb 和 Stokin,数据未显示)一致发现,皮质脊髓侧束中很少观察到磷酸化 TDP-43,而且此前似乎未曾报告 [11]。为进一步研究这一点,我们测量了三种表型 sALS 患者——UMN-p、LMN-p 和典型 ALS——以及对照的胸髓 CST 和前角中的 TDP-43(表 1)。虽然未观察到异常 TDP-43 聚集物,但当我们通过与 pNF-H 共定位的方式测量轴索中的总 TDP-43 时,发现 sALS 脊髓的皮质脊髓侧束(图 5m,p = 0.04)及皮质脊髓前束(图 5n,p = 0.01)中均有定量上的增加。sALS(图 5o(iii),p = 0.54)与对照脊髓(图 5p)之间,DC 感觉轴索中的总 TDP-43 水平未见显著差异。在伴有或不伴有细胞质错误定位的 LMN 细胞核中也检出了总 TDP-43(红色)(图 5d(ii)),证实了该抗体的敏感性,与此前报道一致 [1]。值得注意的是,在 sALS 脊髓前角灰质中观察到轴索 TDP-43 纤丝(图 5j–l),与轴索(pNF-H,绿色)共同标记,而对照中未见(图 5p,p = 0.001),这与其他关于 LMN 的报道一致 [3, 10, 11, 43, 49, 57]。比较 ALS 亚型间 TDP-43 的区域差异时,仅典型 sALS 组灰质中的包涵体显著多于对照。(Kruskal–Wallis,p = 0.02,数据未显示)因此,下行 CST 中的 UMN 轴索内 TDP-43 存在可测量的增加,但其情况可能不同于周围神经系统及前角灰质中的 LMN 轴索,提示 UMN 与 LMN 中 TDP-43 的分子机制可能不同。
讨论
“侧索硬化”:皮质脊髓侧束的髓鞘形成、轴索变性和神经炎症
通过聚焦临床表型的两端,我们得以将 UMN 变性的临床体征与皮质脊髓侧束——UMN 的轴索束——的神经病理变化相关联;这是通过计数运动皮质神经元或定量 TDP-43 神经病理难以做到的。大直径轴索起源于初级运动皮质的 Betz 细胞 [50],构成 CST 中最长的轴索 [50],已知在 ALS 中优先受累 [39, 51, 64, 70]。我们的发现扩展了这些观察,并发现受累也进展至较小的轴索。这支持 UMN 运动束的复杂性 [23, 45, 56],以及 ALS 脑内 M1 纤维的显著丢失,后者此前仅在 NODDI 成像研究中有所报道 [26, 35]。这些发现还表明存在广泛的髓鞘脱失和炎症(图 1)。
我们推测,轴索变性与脱髓鞘/小胶质细胞增生之间的空间差异,可能反映了疾病进展过程中的不同病理过程。早期 UMN 轴索变性可能触发小胶质细胞活化,促进其通过吞噬作用和轴索修剪清除变性轴索及髓鞘碎片。随着变性进展,髓鞘碎片的持续积聚及不断发生的轴索丢失,可能超出小胶质细胞的吞噬能力,导致形成富含脂质的泡沫样小胶质细胞。因此,尽管轴索变性呈现头尾方向的梯度,随着疾病进入终末期,脱髓鞘和小胶质细胞活化可能在整个 CST 中分布得更为均匀。这一解释符合如下观点:小胶质细胞增生和髓鞘脱失代表对慢性轴索变性的下游反应,而非仅仅反映轴索丢失在不同区域的严重程度。
发生远端变性的轴索确实可能已经经历近端髓鞘脱失。然而,本研究仅通过免疫荧光和免疫组织化学评估髓鞘完整性,这些方法的分辨率不足以确定近端脱髓鞘是在远端轴索变性之前、同时还是之后发生。未来需要采用电子显微镜等更高分辨率技术的研究,以明确沿皮质脊髓束的轴索变性与髓鞘脱失之间的时空关系。此类研究还可能有助于阐明近端髓鞘异常是代表早期病理事件,还是继发于持续的轴索变性。
侧索硬化是一种远端轴索病
在本研究中,我们发现了表明 UMN 变性是一种远端轴索病的证据;也就是说,UMN 正在发生“逆行性死亡”。此前其他研究者曾在散发性 ALS [24],以及突变型 SOD1 相关 ALS 的神经病理和实验小鼠模型背景下讨论过这一发现 [21, 26](表 3)。在一项散发性 ALS 的神经病理研究中,C. Davison [24] 观察到,侧索硬化的特征为 UMN 纤维变性,以皮质脊髓束的远端节段最为明显,这一发现最近也被再次提出 [21]。在突变型 SOD 相关 ALS 的神经病理研究中,观察到皮质脊髓束变性,而皮质神经元未见变性;鉴于普遍认为 ALS 中的 SOD1 突变在临床上对 LMN 的影响大于 UMN,这一发现尤其有趣 [37]。在突变型 SOD1 相关 ALS 的实验小鼠模型研究中,通过研究神经肌肉接头、前根及脊髓前角,证实了 LMN 的逆行性死亡 [29]。该研究纳入了一例人体尸检,通过脊髓前角和神经肌肉接头研究 LMN,但未讨论 UMN 的轴索。
| 定义 | UMN | LMN | |
|---|---|---|---|
| 逆行性死亡 | “逆行性死亡”这一术语传统上用于表述一种长度依赖性的轴索丢失模式,推测是由于胞体无法维持其轴索全长所致 | UMN 轴索在皮质脊髓束中下行,长度依赖性轴索丢失(“逆行性死亡”)表现为尾侧重于头侧,导致下肢的临床功能缺损重于上肢例如遗传性痉挛性下肢轻瘫 | LMN 轴索在神经根和周围神经中走行,长度依赖性轴索丢失(“逆行性死亡”)表现为从神经肌肉接头(NMJ)回缩以及肌肉失神经支配,远端肌肉重于近端肌肉例如具有“袜套-手套”模式的周围多发性神经病这与基于脊髓神经元和神经根解剖的节段性模式不同,后者例如脊髓性肌萎缩症、吉兰-巴雷综合征或糖尿病性多发性神经根病 |
| 顺行性死亡 | “顺行性死亡”是专为 ALS 机制创造的短语,推测运动皮质和 UMN 在通过顺行性跨神经元过程驱动 LMN 变性方面具有首要作用特意选用这一术语,是为了与广为人知的“逆行性死亡”术语(见上文)形成对照,不幸的是,这导致“逆行性死亡”有时被误解为运动神经元变性的逆行性跨神经元机制 | 顺行性死亡假说提出,ALS 的功能障碍位于皮质,皮质驱动脑干和脊髓中的 LMN 变性;实际上,是 UMN 在杀死 LMN并未说明“顺行性死亡”机制如何解释 ALS 表型的异质性,尤其是起病躯体部位的差异或 UMN 和 LMN 受累程度的差异 | 在顺行性死亡假说中,LMN 是 UMN 的受害者;LMN 变性继发于 UMN 因素或是其结果 |
| 朊病毒样传播 | “朊病毒样传播”是包括 ALS 在内的神经退行性疾病生物学中的术语,用于推测毒性与蛋白质折叠及模板化等因素在神经元网络中的传播有关,在 ALS 中该网络即运动系统,包括 UMN 和 LMN将其用于 ALS 机制时,与“顺行性死亡”一词的一个重要区别在于,它不预设 UMN 或 LMN 的首要地位 | 毒性因素(如 TDP-43 错误折叠)是一种随机分子事件,其解剖位置随机,在 UMN 与 LMN 之间的分布不定,并通过细胞间传播(连续性传播、跨轴索传播或经脑脊液(CSF)传播)扩散一旦被触发,UMN 和 LMN 变性在解剖上独立传播 | 临床表型模式的异质性可依据正在传播的随机性解剖和分子特征来解释最初的 UMN 和 LMN 临床功能缺损出现在同一躯体区域,这一观察提示,触发因素位于支配该躯体部位的 LMN-UMN 网络内,但两者独立传播 |
“逆行性死亡”轴索病的概念源于对神经疾病的经典神经病理研究;这些研究观察到,变性始于长轴索的远端部分,并向近端的胞体方向进展 [16, 65]。“中枢-周围远端轴索病”这一术语被用于描述一种同时影响周围和中枢投射的统一长度依赖性变性模式 [66]。后续机制研究将这些观察与轴索运输及细胞骨架完整性受损联系起来,为远端轴索的易损性提供了生物学依据 [33]。这些研究共同确立了远端轴索病作为一种基本且可重复观察到的神经变性模式的地位,至今仍是理解神经系统长度依赖性易损性的基石。
长度依赖性逆行性死亡的经典例子是周围多发性神经病,通常表现为袜套-手套样功能缺损。当周围神经病不具有长度依赖性时,常采用神经元病这一术语,将其与轴索病区分开来,其模式通常称为节段性或神经根性。运动系统中此类节段性或神经根性模式的例子包括脊髓性肌萎缩症(脊髓运动神经元的疾病)、吉兰-巴雷综合征(一种引起脱髓鞘、尤其累及运动神经根的疾病),以及一种称为糖尿病性多发性神经根病的罕见糖尿病并发症(其不同于常见的糖尿病性多发性神经病,后者确实具有长度依赖性)。
由于运动系统具有两个层级,逆行性死亡或远端轴索病这一概念在 ALS 中较为复杂,难以表征。(表 3)。UMN 在皮质脊髓束中走行,并与下位运动节段形成突触。其变性产生的长度依赖性临床模式表现为下肢受累重于上肢。相比之下,LMN 经运动神经根及周围神经走行,并与肌纤维形成突触。其变性产生的长度依赖性临床模式表现为同一肢体内(上肢和下肢均如此)远端肌肉受累重于近端肌肉。由于 ALS 可在任何躯体区域局灶起病,且 UMN 和 LMN 变性的受累程度不一,长度依赖性轴索病的临床模式容易被掩盖而难以检出。此外,当考虑轴索属于单突触还是多突触通路时,长度依赖性异常也难以检出。既往研究发现皮质脊髓束中直径最大的轴索受累最重 [51, 64, 70],这一事实与长度依赖性相符——直径最大的轴索属于单突触通路,且正因其为单突触,长度也最长。相比之下,多突触通路中的轴索较短,但其远端末梢基本上是未知的,取决于构成该通路的神经元数量。我们针对临床表型两端进行的定量神经病理研究,揭示了长度依赖性,并显示 UMN 层级的多突触和单突触组成部分均受累。
逆行性死亡、远端轴索病或长度依赖性轴索病理,历来都是描述轴索由远端向近端变性的术语,并无争议。它们似乎很可能由神经元近端、可能是胞体的功能障碍所致,而远端轴索是继发受累。近期有关 TDP-43 功能缺失对 STMN2 [42, 48]、UNC13A [13, 47] 及许多其他转录本 [75] 影响的新证据支持这一点。当 TDP-43 从细胞核错误定位时,受其调控的基因可能通过多聚腺苷酸化或无义介导的降解而减少。STMN2 在轴索维持和再生中发挥重要作用,UNC13A 在神经肌肉接头功能中发挥重要作用。因此,细胞核内 TDP-43 功能丧失会导致远端功能障碍。这主要在 LMN 中进行了研究,而 TDP-43 功能丧失在 UMN 中的作用仍是一个相对盲区,容易被忽视,例如在运动神经元的 iPSC 模型及人脑组织组学研究中。TDP-43 在 UMN 中的功能可能与 LMN 不同。
ALS 文献中的“顺行性死亡”一词借用了逆行性死亡的术语,因此很容易引起混淆。混淆的主要来源是将模式(远端逆行性死亡)与机制(推测性的顺行性死亡)混为一谈。“顺行性死亡”一词首次用于 ALS 是在 2001 年 [27],属于一种假说的多次演变之一;该假说最早于 1992 年提出,认为运动皮质是 ALS 的驱动因素 [26]。根据这一假说,ALS 由毒性因素从运动皮质出发的跨神经元顺行性传递所驱动。选用这一术语,是为了与神经科医师熟知的逆行性死亡模式形成对照。近来,顺行性死亡假说也被称为“离皮质性轴索传播”[9]。这一假说已成为许多与神经兴奋性毒性以及涉及皮质磁刺激的神经生理研究有关的观察性论文的基础,但鲜有实验支持 [71]。这一假说因多种原因受到批评 [38, 40, 52, 68],最近的批评是其无法解释运动表型的异质性 [55]。顺行性死亡是在假设一种机制,逆行性死亡则不是——也就是说,后者并不意味着轴索在杀死神经元(病变神经元会有病变轴索,而且远端会更严重),也不意味着 LMN 在杀死 UMN。认为某一运动层级(如 UMN)在发病机制中比另一层级(如 LMN)更重要,或反过来,都是推测 [4, 25, 27]。
神经炎症参与 ALS 的运动神经元变性及疾病进展,使其成为治疗干预的潜在靶点 [12, 34, 46, 74]。我们 [62] 及其他研究者 [12, 36] 此前报道,以 CD68 和 Iba1 表达显示的小胶质细胞病理,在 ALS 病例的 CST 中明显更为广泛。CST 中小胶质细胞活化和髓鞘脱失的程度,与疾病进展及 UMN 功能缺损的严重程度相关 [12, 36, 62]。在此,我们报告的发现显示,皮质脊髓侧束中髓鞘脱失(图 1)与所有大小轴索的丢失(图 2)同时存在,并伴有一种独特亚型的活化炎性小胶质细胞/巨噬细胞(图 3)。尽管泡沫样吞噬细胞主要在多发性硬化中受到研究 [32, 72],我们的数据提示,它们在 ALS 病理中也发挥重要作用。这些通过免疫组织化学方法表征和分型的泡沫样小胶质细胞,可能通过其吞噬活性及炎性特征促进疾病进展,也可能是清除正在退变轴索的继发性效应。
我们提出,在 UMN-p ALS 患者疾病早期,处于稳态的中枢神经系统(CNS)小胶质细胞,响应皮质脊髓侧束的轴索丢失和髓鞘脱失而转变为炎性泡沫样小胶质细胞。此外,在脊髓前角内运动神经元丢失及胶质增生的区域,经常观察到泡沫样巨噬细胞,提示外周固有免疫细胞也可能与 CST 病理相互作用 [20]。泡沫样小胶质细胞与 CST 中髓鞘和轴索丢失最严重区域之间极为紧密的空间相关性,既可能符合这些细胞作为上游致病驱动因素的情形,也可能符合其代表对既存轴索变性的继发性吞噬和重塑反应的情形。理解这些神经炎症相互作用,可能为开发靶向治疗和生物标志物提供有价值的认识,为更精准的 ALS 治疗铺平道路。
另一方面,临床上,一些具有 UMN-p 体征的 ALS 患者可能表现出较慢的疾病进展和较长的生存期;然而,在本病例系列中,他们呈现最显著的 CST 髓鞘和轴索丢失,并伴有突出的小胶质细胞积聚。可能的解释包括:较长的临床前期,其特征为缓慢但持续不断的 CST 变性;以及在 LMN 相对保留的情况下,CST 能够积累广泛的结构损伤,而不对短期生存产生相应程度的影响。我们在两种特定临床表型中的临床-神经病理发现提示,所有直径轴索的表现均支持 UMN-p ALS 样本侧索硬化中的远端易损性;然而,鉴于每个表型组的样本量较小,目前的数据无法区分原发性“逆行性死亡”过程与疾病终末期纤维束的晚期受累。
此外,在疾病起病时,大多数患者的临床症状表现为左右不对称。然而,随着疾病进展,大多数患者的受累变为弥漫性和对称性;在终末期尸检样本中,我们未观察到 CST 病理存在明确或一致的左右不对称,也未发现病理不对称与最初临床表现之间存在一致的相关性。在终末期尸检样本中(各诊断为 ALS 的个体起病后 0.9–12 年,表 1),两种 ALS 亚型均未观察到临床症状起始部位与神经变性、脱髓鞘或小胶质细胞增生程度之间存在明确或一致的关系。在终末期尸检样本中,我们发现,延髓起病的 ALS 患者在腰髓和颈髓均出现 CST 轴索丢失。这一观察提示,投射至腰髓的 UMN 轴索变性,其进展独立于疾病起病时最初受累的躯体部位。UMN 变性有两个独立维度:一个是起病部位,另一个是相对于 LMN 变性程度的 UMN 变性程度。
此外,经典混合表现型 ALS 病例(临床上同时存在 UMN 和 LMN 受累)未纳入本研究,因为我们最近已在《科学报告》(Scientific Reports)发表的论文中报告了这些病例 [21]。在该研究中,混合表现型 ALS 病例的终末期病理显示,CST 的 UMN 轴索丢失模式与本研究 UMN-p 组中观察到的模式相似。这一发现与混合表现型病例存在显著 UMN 临床受累相一致。
皮质脊髓前束和 DC 中的观察结果
我们的研究阐明了另外两条脊髓纤维束——皮质脊髓前束和 DC——的情况。皮质脊髓前束含有未交叉的纤维,仅占皮质脊髓纤维的约百分之十至百分之二十五 [61, 67]。这些解剖变异可能解释了 UMN-p ALS 脊髓腰段皮质脊髓前束中所见髓鞘和轴索丢失的不一致性(图 1 和表 2)。由于两种归一化方法——最初均为皮质脊髓侧束优化——之间存在变异和不一致,我们无法对皮质脊髓前束的轴索变化得出明确结论,尽管存在皮质脊髓前束轴索丢失充分参与 ALS 病理的趋势 [6, 14, 37, 51, 53, 73]。
有趣的是,我们发现 DC 的感觉轴索丢失主要影响腰段(图 4)。据我们所知,这是首次采用系统定量方法,以对照为参照,比较 UMN-p ALS 与 LMN-p ALS 的三个脊髓节段,并报告腰髓感觉轴索丢失。其他研究已将腰髓 DC 感觉轴索丢失报道为 ALS 更广泛多系统受累的一部分,支持将感觉神经病纳入该病的非运动表现 [8, 41, 58]。虽然感觉受累并非该病的临床特征,但偶尔可见感觉症状。DC 感觉轴索变性(图 4)的机制可能与皮质脊髓侧束运动轴索变性(图 2)不同,因为 DC 中未见髓鞘脱失(图 1 和表 2),也未见泡沫样小胶质细胞(图 3)。进一步理解 ALS 的多系统性质,是未来需要研究的重要领域。
sALS 脊髓 CST 和灰质中轴索 TDP-43 出现频率增加
已在人 ALS 运动皮质和延髓 [11]、ALS 患者来源的诱导多能干细胞(iPSC)运动神经元(MN)[3]、人和小鼠 ALS 周围神经 [57],以及 ALS 转基因小鼠模型 [3] 中观察到轴索 TDP-43。据我们所知,这是首次同时报告 sALS 脊髓 CST 和灰质中的轴索 TDP-43 病理(图 5)。有人提出,沿 CST 的轴索 TDP-43 病理可通过介导疾病在运动皮质与脊髓运动神经元之间的跨轴索传播,参与 ALS 发病机制;然而,在患者中,这主要是推断而非直接证实。我们的发现显示,CST 轴索及 LMN 轴索区域内的总 TDP-43 信号增加,而非经典的磷酸化包涵体;这种轻微增加的功能意义仍属推测。这些观察可被解释为 TDP-43 存在区室特异性调控紊乱的证据,这种紊乱在 UMN 和 LMN 的轴索与胞体之间有所不同,也为未来的机制研究提供了动力。
据我们所知,此前尚未报道人皮质脊髓侧束内的轴索磷酸化 TDP-43 病理。此前大多数研究关注的是神经元胞体及胶质细胞中的磷酸化 TDP-43 聚集物,而非轴索内的聚集物。根据我们的分析,无论采用免疫组织化学还是免疫荧光,皮质脊髓侧束中的磷酸化 TDP-43 免疫反应性都仅极少观察到[或完全未观察到]。这一发现已在三个不同实验室独立证实,但染色出现频率过低且不一致,无法进行有意义的定量分析;因此,这些数据未纳入稿件。尽管蛋白质印迹法原则上可以提供定量信息,而且我们一直在开展这项工作、迄今尚未成功——但对于皮质脊髓侧束,这种方法在技术上具有挑战性,因为它需要从单个尸检脊髓标本中精确显微分离这一相对较小的白质束,组织量有限,并需从可溶性和不溶性组分中纯化蛋白质。我们仍在继续开展这项工作。
结论
我们的发现表明,ALS 的一个关键特征——“侧索硬化”——反映了多种病理变化:UMN 轴索变性、髓鞘脱失、炎性泡沫样小胶质细胞及长度依赖性(“逆行性死亡”)。在 UMN-p 和 LMN-p 两种 ALS 表型的 UMN 轴索中,均观察到总 TDP-43 的存在。这些现象同时出现,提示皮质脊髓侧束内的神经-胶质细胞相互作用是疾病进展的基础,并提示从 LMN 轴索生物学出发研究 UMN 在 ALS 发病机制中作用的重要性 [28]。
- Sporadic ALS cases were grouped by clinical phenotype into UMN-predominant (UMN-p), LMN-predominant (LMN-p) and typical phenotypes; the lateral CST was examined at cervical, thoracic and lumbar levels for myelin loss, axonal degeneration, neuroinflammation and TDP-43 pathology.
- UMN-p cases showed pronounced lateral CST myelin loss and significant axonal loss across all diameters, more severe than LMN-p; axonal loss was greater in lumbar than cervical cord — a length-dependent gradient supporting “dying back”.
- Foamy, inflammatory microglia localized to areas of severe myelin and axonal loss; axonal TDP-43 was measurably increased in UMN axons of the lateral and ventral CSTs.
- Five figures and three tables (cohort, incidence of myelin loss by level, and a clarification of “dying-back” vs “dying-forward”).
Scope: open-access full text (CC BY 4.0) from Acta Neuropathologica — abstract, introduction, materials and methods, results, discussion and conclusions, with 5 figures and 3 tables; abbreviations, references, acknowledgements, funding, author information and declarations are not included. Bracketed numbers are the original reference numbers.
Abstract
The hallmark neuropathological feature of upper motor neuron (UMN) degeneration in amyotrophic lateral sclerosis (ALS) is the “sclerosis” of the lateral corticospinal tract (CST)—the major axonal pathway connecting UMNs to lower motor neurons (LMNs). However, few studies since Charcot’s original descriptions in the nineteenth century have directly correlated clinical UMN phenotypes with corresponding neuropathological findings. We examined the pathology of the lateral CST at the cervical, thoracic, and lumbar levels of the spinal cord from ALS patients with predominantly UMN (UMN-p) phenotypes and compared it with that in patients with predominantly LMN (LMN-p) phenotypes. We assessed myelin loss, axonal degeneration, neuroinflammation, and TDP-43 pathology. Spinal cords from UMN-p ALS cases exhibited pronounced myelin loss in the lateral CST compared to LMN-p cases and controls, consistent with clinical phenotyping. Quantitative analysis revealed significant axonal loss across all axon diameter ranges in UMN-p ALS, which was more severe than in LMN-p ALS. Importantly, axonal loss was more pronounced in the lumbar than in the cervical spinal cord. We identified a distinct population of foamy, inflammatory microglia localized to regions of severe myelin and axonal loss in UMN-p ALS. TDP-43 was measurably increased in the UMN axons of the lateral and ventral CSTs. In summary, “lateral sclerosis” of ALS correlates to clinically imputed UMN degeneration. It consists of a combination of myelin loss, distal greater than proximal axonal degeneration, inflammatory microglial activation within the CSTs, and abnormally increased axonal TDP-43. The length-dependent gradient of motor axonal loss supports a "dying-back" process. A detailed comparison of “dying-forward” and “dying-forward” is provided in the Discussion. The association of loss of axons and myelin with abnormal microglial activity shows glio-axonal interactions in UMN axon degeneration, the latter CST (lateral sclerosis) across all three spinal cord levels in the ALS UMN-p samples but does not establish a causal relationship.
Introduction
The original descriptions of “lateral sclerosis” in amyotrophic lateral sclerosis were by Charcot in the 1860s, who noted sclerosis as a pathological change in the lateral columns of the spinal cords of patients dying from progressive motor deterioration in addition to loss of neurons in the anterior horn [17, 18]. The lateral columns were subsequently recognized to be the lateral corticospinal tracts (CST), which carry axons from upper motor neuron (UMNs) cell bodies in the motor cortex to the lower motor neurons (LMNs) in the anterior horns of the spinal cord [24, 31, 69]. UMN axons descend from the cortex to the cervical-medullary pyramids, where about 75–90% decussate to form the lateral CST, and descend in the lateral funiculus. The remaining 10–25% of axons remain uncrossed and descend ipsilaterally in the ventral CST [23, 44, 45, 56, 59]. Charcot originally postulated that the hallmark lateral sclerosis was the primary driver of ventral horn cell degeneration—hence, the sclerosis was considered amyotrophic. The descriptions were done at a time when the histological techniques were crude compared to modern techniques. Much of the research attention today in the ALS field is neuron-centric, focusing on motor neuron degeneration and TDP-43 abnormalities, the hallmarks of ALS neuropathologically being TDP-43 translocation from the nucleus and cytoplasmic accumulation and phosphorylation. Only relatively recently has research increased in axon functions [19, 54, 60] and to axonal transport and accumulation of TDP-43 [3, 10, 11, 43, 49, 57]. The most direct way to study UMN axons in ALS is to study the lateral sclerosis neuropathologically—the relationship between ALS biology and neuropathology is not yet understood, and it may be different for UMNs than LMNs. In this study, we characterize lateral sclerosis in the lateral CST. As the point of departure, we compared the tracts between two ends of the phenotypic clinical spectrum—spinal cords from patients who displayed predominantly UMN clinical deficits (UMN-p ALS)—and spinal cords from patients who displayed predominantly LMN clinical deficits (LMN-p ALS). We assessed myelin loss, axonal degeneration, neuroinflammation, and TDP-43 pathology.
Materials and methods
ALS patient population and tissues
All nervous tissues were acquired by way of an Institutional Review Board (IRB) and Health Insurance Portability and Accountability Act (HIPAA) compliant process. The acquisition and de-identification of postmortem tissues were approved by either the Benaroya Research Institute (2003–2011) or the University of California, San Diego (after 2011) IRBs, by relevant guidelines and regulations according to the Declaration of Helsinki. Subsequent use of de-identified postmortem tissues was by standard federal policies and regulations and is not considered Human Subjects research. Formalin-fixed and paraffin-embedded (FFPE) cervical, thoracic and lumbar spinal cords from sporadic ALS (sALS) patients. All patients had been classified during life by one clinical neurologist (JR) based on clinical examination and clinical signs. Signs imputing UMN degeneration were loss of fine skilled movements, spasticity, hyperreflexia, and pathological reflexes, and signs imputing LMN degeneration were weakness, atrophy, and fasciculation at disease onset. The contributions of UMN and LMN degenerations to the overall clinical deficits were recorded in a five-point scale: UMN ≫ LMN, UMN > LMN, UMN = LMN, UMN < LMN, and UMN ≪ LMN [2, 31]. The extremes (UMN ≫ LMN, n = 6; UMN ≪ LMN, n = 7) were chosen for most pathological studies and are hereafter referred to as UMN-p and LMN-p, respectively. “Typical” ALS were the three intermediate grades (UMN > LMN, UMN = LMN, or UMN < LMN, n = 6), and control patients (n = 13) with no pathological evidence for neurological disease (Table 1). The UMN-p group could arguably be classified as primary lateral sclerosis (PLS) were it not for the rapid clinical course and sometimes the co-existence of some LMN signs. The LMN-p would be called progressive muscular atrophy (PMA) by some clinical neurologists. Patient demographics are stated for convenience (Table 1).
| No. | Primary diagnosis | Patient autopsy # | Motor phenotype: UMN-p or LMN-p clinical signs | Sites of onset | Disease course (years) | Age | Sex | Laboratories where studied |
|---|---|---|---|---|---|---|---|---|
| 1 | sALS | 119 | UMN ≫ LMN | Arm | 2.5 | 46 | M | UIC and UCSD |
| 2 | sALS | 25 | UMN ≫ LMN | Arm | 0.9 | 53 | M | UIC and UCSD |
| 3 | sALS | 46 | UMN ≫ LMN | Arm | 5 | 51 | F | UIC |
| 4 | sALS/C9orf72 | 82 | UMN ≫ LMN | Bulbar | 2 | 56 | F | UIC and UCSD |
| 5 | sALS/C9orf72 | 117 | UMN ≫ LMN | Bulbar | 1 | 66 | F | UIC |
| 6 | sALS | 12 | UMN ≫ LMN | Diffuse | 1.25 | 60 | M | UIC |
| 7 | sALS | 108 | LMN ≫ UMN | Leg | 9 | 69 | M | UIC and UCSD |
| 8 | sALS | 109 | LMN ≫ UMN | Leg | NA | 49 | M | UIC |
| 9 | sALS | 112 | LMN ≫ UMN | Leg | 4 | 54 | F | UIC |
| 10 | sALS | 29 | LMN ≫ UMN | Leg and foot | 3.0 | 77 | F | UIC |
| 11 | sALS | 107 | LMN ≫ UMN | Trunk | 0.75 | 74 | M | UIC and UCSD |
| 12 | sALS | 22 | LMN ≫ UMN | Respiratory and hand | 3.25 | 72 | M | UIC |
| 13 | sALS | 127 | LMN ≫ UMN | Respiratory and right arm | 1.5 | 67 | M | UCSD |
| 14 | sALS | 32 | LMN > UMN (typical) | Respiratory and trunk | 1.5 | 71 | M | UCSD |
| 15 | sALS | 33 | LMN = UMN (typical) | Arm | 6.5 | 54 | M | UCSD |
| 16 | sALS/FTD | 93 | UMN > LMN (typical) | FTD/bulbar | 1.75 | 71 | M | UCSD |
| 17 | sALS | 128 | LMN > UMN (typical) | Right foot | 2 | 69 | F | UCSD |
| 18 | sALS | 132 | LMN = UNM (typical) | Right arm | 12 | 64 | F | UCSD |
| 19 | sALS/FTD | 134 | UMN > LMN (typical) | Leg and bulbar | 1.9 | 78 | F | UCSD |
| 20 | Ctrl | 20 | NA | NA | NA | 84 | M | UIC |
| 21 | Ctrl | 40 | NA | NA | NA | 67 | M | UIC and UCSD |
| 22 | Ctrl | 77 | NA | NA | NA | 68 | M | UIC and UCSD |
| 23 | Ctrl | 4 | NA | NA | NA | 75 | M | UIC |
| 24 | Ctrl | 37 | NA | NA | NA | 57 | M | UIC and UCSD |
| 25 | Ctrl | 65 | NA | NA | NA | 82 | M | UIC |
| 26 | Ctrl | 115 | NA | NA | NA | 94 | M | UIC |
| 27 | Ctrl | 76 | NA | NA | NA | 76 | F | UIC and UCSD |
| 28 | Ctrl | 78 | NA | NA | NA | 58 | F | UIC |
| 29 | Ctrl | 19 | NA | NA | NA | 80 | F | UIC |
| 30 | Ctrl | 44 | NA | NA | NA | 80 | F | UCSD |
| 31 | Ctrl | 83 | NA | NA | NA | 63 | F | UCSD |
| 32 | Ctrl | 103 | NA | NA | NA | 92 | F | UCSD |
Histopathology
Sections of FFPE human spinal cord blocks were cut transversely at 5 µm thickness, dewaxed with xylene, and hydrated through a graded series of alcohol solutions. The sections were then stained with Luxol Fast Blue-Periodic Acid Schiff (LFB-PAS) (Poly Scientific, Bay Shore, NY) for the presence of myelin according to manufacturer’s instruction [62, 63]. 20 × digital images of intact spinal cords were obtained with a Leica DM5500B microscope (Leica Microsystems Inc., Wetzlar, Germany).
Immunofluorescence
To examine axonal degeneration and myelination in ALS and control patients, the following primary antibodies were used to examine the expression of neurofilament heavy chain and myelin basic protein in the white matter of spinal cords; anti-Neurofilament heavy chains (1:50, mouse monoclonal; clone RT97, DSHB, Iowa City, Iowa) and anti-myelin basic protein (MBP) (1:200, Cat. No. A0623, Rabbit polyclonal, Dako). The sections were then incubated with goat anti-rabbit antibody tagged with Alexa-488 (1:250, Code: 111-545-144, Jackson Immuno Inc.) and biotinylated-goat anti-mouse antibody (1:250, Code: 115-065-062, Jackson Immuno Inc.) for 2 h followed by streptavidin conjugated with Alexa-594 for 1 h (1:500, Code: 016-580-084, Jackson Immuno Inc.). The slides were mounted with antifade mounting medium (Cat. No. H-1200, Vector Laboratories, Burlingame, CA).
Tissue staining for microglia and motor neurons was performed using Iba-1 (rabbit polyclonal 1:500, Cat. No. 019-19741 Wako Inc. Richmond, VA), and Neurotracer™ 530/560 red, fluorescent Nissl stain (1:500, Cat. No. N21482, Fisher Scientific, USA), respectively. After antigen retrieval (10 mM EDTA, pH6.0), nonspecific binding sites were blocked for one hour at room temperature with blocking solution (5% normal goat serum, 5% BSA and 0.05% Triton X-100 in TBS, pH7.4); the primary antibody was diluted in the blocking solution and added onto the sections overnight at 4 °C, and the sections were incubated with goat anti-rabbit Alexa Fluor 488 (1:500, Invitrogen, Carlsbad, CA). The sections were then counterstained with Neurotracer 530/615 (1:500, Cat. No. N21482, Fisher Scientific, USA), treated with 0.3% Sudan Black for minimizing autofluorescence, and mounted with antifade mounting medium (Cat. No. H-1000, Vector laboratories, Burlingame, CA) [22].
To examine axonal TDP-43, 6 µm-thick axial cross-sections of FFPE thoracic spinal cords from sALS and control (Table 1, UCSD site) patients were dual-immunolabeled with anti-phosphorylated Neurofilament Heavy (pNF-H) (Chemicon #AB5539, 1:1000) and anti-TDP-43 (ProteinTech #10782-2-AP, 1:3000). The pNF-H antibody has previously been validated to target myelinated and unmyelinated axons in human tissue [7, 30]. The primary antibodies were visualized with AlexaFluor 568 anti-rabbit IgG (Invitrogen #A10042, 1:250) and 488 anti-chicken IgY (Invitrogen #A78948, 1:500). Coverslips were mounted on the slides using ProLong Gold Antifade Media with DAPI (Invitrogen #P36935) and imaged using identical exposure settings (DAPI: 21.067 ms; FITC: 355.26 ms, TRITC: 227.752 ms) on the Olympus VS200 Slide Scanner at the UCSD Microscopy Core.
Immunohistochemistry
Identification of microglia was performed using antibodies specific to human CD68 (mouse IgG1, 1:20, catalog no. N1577; DAKO, Carpinteria, CA). Astrocytes were labeled with anti-glial fibrillary acidic protein (GFAP) antibodies against human (rabbit polyclonal, 1:100; Cat. No. Z0334, lot 00076541, DAKO). The primary antibodies were diluted in blocking solution (10% normal goat serum, 0.05% Triton X-100 in phosphate-buffered saline) overnight at 4 °C followed by incubation with goat anti-rabbit Alexa Fluor 488 (1:100; Invitrogen, Carlsbad, CA). For CD68 immunostaining, biotin-conjugated goat anti-mouse was used as a secondary antibody; the signal was amplified using a tyramide signal amplification kit (1:250; Invitrogen) following the manufacturer’s instructions [62].
Quantitative image analysis
The digital intact spinal cord images were obtained with a Leica DM5500B fluorescence microscope (Leica Microsystems Inc., Wetzlar, Germany) and scanned automatically with the multiple channel option in a Q (Imaging) cooled CCD camera (SN: Q36526, Canada). In the only step involving operator discretion, all image parameters including auto-expose setting, target intensity, binning, camera area, background subtraction, shading correction, color tab, special tab and temperature were first set using control patient tissue, and the same setting used for all samples imaged. The image size was the same for all images. The specific fluorescent labeled molecules in the lateral CST, dorsal column (DC) and laminae zone VIII&IX of the ventral horns were analyzed with Metamorph Software 7.8 with color channel separation.
Axon quantifications
Four regions of interest (ROIs) were randomly selected from the neurofilament (NF, RT97) channel on both the right and left sides of the lateral CST, or three ROIs from bilateral DC, at each spinal cord level per patient. Axon size thresholds were determined for each blinded ROI using Metamorph image analysis software, and axon sizes were quantified as pixel area. Raw data were exported to Microsoft Excel and analyzed using the Excel Data Analysis ToolPak. Axon frequency histograms were generated from raw axon pixel area data using bin ranges of 20–500 pixels. Repeatability was assessed within each patient group (n = 6–10).
In detail, quantification of axons (NF RT97) was performed in the Metamorph (Molecular Devices Inc. Downington, Pennsylvania, USA) software using a custom script. The original mono red color (RT97) images were used and the background fluorescence eliminated and then exported data automatically to Excel for generating the given data on density of positive axon for each image. Briefly, two thresholds for bright and dark of positive RT97 staining were determined by an average gray through 20 bright and dark objects and recorded in a notebook for each image. Pixels with signals above thresholds constitute axons of interest. To eliminate background noise, dark objects were defined as total area between 20 and 1E+00.8 pixels, shape factor between 0.7 and 1, and average gray between 0 and 1E+00.7. Dark objects are those with total area between 10 and 1E +00.8, shape factors between 0.7 and 1, and average gray between 0 and 1500 pixels. Threshold of the images for dark objects, integration morphometry analysis and log data were imported into Excel. All selected regions around dark objects were created and painted using display-graphic, paint regions, and choice insider regions. To isolate dark objects, the image threshold was adjusted to exclude bright objects, leaving behind halo-like structures. An average gray value threshold was then applied to remove these halo-objects. Then, integrated morphometry analysis for dark objects and log data were imported into Excel. Finally, the lists of bright and dark objects were combined.
Raw axon size data were exported from Metamorph software and collected in Excel format for analysis. The data were analyzed using the “Data Analysis” tool integrated into Excel, selecting the Histogram function from the list of available options. In the histogram dialog box, raw axon size values (pixel area) were entered along with predefined bin ranges. The Excel file above contains values for axon number, total area of axon, average gray of axon, total gray of axon, and shape factor of axon. The histograms were generated using the total area of axon to indicate the frequency of axons within certain diameter ranges for each image. For the average axon frequency in each axon diameter range, the mean of axon frequency from four randomly selected regions (within the lateral CST) or three regions (within the DC) in the spinal cord from each patient was calculated.
Axon size distributions were plotted as histograms using pixel area bins of 20, 40, 60, 80, 100, 120, 140, 160, 180, 200, and 500 pixels (Fig. 2A), corresponding to axon diameters of approximately 3.2, 5.6, 6.5, 7.2, 7.9, 8.5, 9.1, 9.7, 10.2, and16.4 µm, calculated using the conversion formula: 2 × √((0.642 × pixel area) / 3.14) (Fig. 2B–D). Mean axon pixel area values were calculated for each bin range for UMN-p ALS (n = 6), LMN-p ALS (n = 6), and controls (n = 10). Axon frequency histograms were generated separately for each spinal cord level (cervical, thoracic, and lumbar) across control, UMN-p ALS, and LMN-p ALS groups.
ALS group values at each spinal level were normalized to the corresponding control values and expressed as percentages (control = 100%). In the resulting Excel histograms, mean normalized values for each axon diameter were analyzed. Normalized UMN-p and LMN-p ALS values were compared between axon diameter range of 3.2–16.4 µm. Logarithmic (log2) scaling was applied to facilitate comparisons across wide value ranges. These values were calculated for motor axons (lateral CST) and sensory axons (DCs) in the UMN-p ALS spinal cords and compared with corresponding axon diameter in LMN-p ALS spinal cords after normalizing to the respective axon size in control patients.
A total of 48 (12 ALS patients) and 40 (10 control patients) randomly selected regions within the lateral CSTs from each spinal cord were analyzed at each spinal cord level (cervical, thoracic, lumbar). A total of 36 (from 12 ALS patients) and 30 (from 10 control patients) randomly selected regions within the DC at each level of spinal cord were analyzed.
Microglial quantifications
To quantify microglia in the lateral CST, a manual count was completed blindly. A randomly selected region within the left and right lateral CSTs at each level section of the spinal cord was sampled. The size of the randomly selected region was a circle of 96 pixels in diameter. Using the Metamorph ‘manual count object’ function, the microglia were quantified in each sampled lateral CST. Criteria for microglia included being circular and either a ring or filled in shape with the size of microglia not having an impact on the decision. The average number of microglia per lateral CST (left and right sides) was calculated at each level of the spinal cord for each patient.
Axonal TDP-43 quantifications
Image analysis was performed on QuPath-0.6.0-rc4 [5] and Fiji 1.54p. The boundaries of the regions of interest (ROI)—lateral CST, ventral CST, and DC—were approximated and hand-annotated on each image. To calculate the frequency of axonal TDP-43 in these white matter tracts, the number of TDP-43 signals that occurred in the axoplasm (i.e., co-localized with pNF-H) was then manually counted and normalized to the area of each ROI. For the gray matter, the ventral to the posterior edge of the central canal was manually segmented and extrasomatic TDP-43 signals were quantified. The putative signals were then filtered based on their pNF-H intensity and morphology to exclude signals unassociated with axons.
Statistical analysis
For axon quantifications, statistical differences among the three groups were assessed using two-way ANOVA, while comparisons between the two ALS groups were performed using Student’s t test. For axonal TDP-43, statistical significance was assessed using the Kruskal–Wallis test or the Mann–Whitney test. Significance thresholds were set at p < 0.05 and p < 0.001.
Results
Myelin loss is severe in the lateral CST in spinal cords from ALS patients with UMN-p symptoms but not LMN-p symptoms
We first investigated myelin changes in the CST at three levels (cervical, thoracic, and lumbar) in relation to the clinical characterizations using LFB-PAS tissue staining (Fig. 1). There was distinct loss of myelin in the lateral CST in UMN-p ALS spinal cord compared to LMN-p ALS spinal cords, thus clearly correlating with the clinical phenotyping, and supporting the clinical imputations of UMN degeneration. We found severe myelin loss (stained in pink) in the lateral CST at all three spinal cord levels in all ALS patients with UMN-p symptoms (Fig. 1 and Table 2). In contrast, in ALS patients with LMN-p symptoms, the lateral CST exhibited characteristics similar to other white matter regions at all three spinal cord levels, resembling those observed in control patients (Fig. 1 and Table 2). Notably, when myelin loss and pathological lesions occurred in UMN-p patients, they followed an ‘all or none’ pattern at all three spinal cord levels.
| Autopsy samples | Spinal cord | Descending track (motor axons) | Ascending track (sensory axons) | |
|---|---|---|---|---|
| Lateral CST | Ventral CST | Dorsal column | ||
| Controls (n = 10) | Cervical | 0/10 | 0/10 | 0/10 |
| Thoracic | 0/10 | 0/10 | 0/10 | |
| Lumbar | 0/10 | 0/10 | 0/10 | |
| UMN-p ALS (n = 6) | Cervical | 6/6 | 6/6 | 0/6 |
| Thoracic | 6/6 | 6/6 | 0/6 | |
| Lumbar | 6/6 | 6/6 | 0/6 | |
| LMN-p ALS (n = 6) | Cervical | 0/6 | 0/6 | 0/6 |
| Thoracic | 0/6 | 0/6 | 0/6 | |
| Lumbar | 1/6 | 0/6 | 0/6 | |
Axon loss in the lateral CST involves axons of all sizes and is worse distally
It has been previously established that large-diameter axons are selectively lost in the lateral CST, consistent with the selective degeneration of the direct monosynaptic connections between the UMN and LMN [39, 51, 64, 70]. We developed a quantitative method to assess axon size distributions using axon frequency histograms. Initial observations indicated that motor axons in the CST exhibited severe loss across all size ranges in UMN-p ALS, whereas sensory axon size distributions in the DC remained similar among UMN-p ALS, LMN-p ALS, and control individuals at the lumbar spinal cord level (Fig. 2a). We then compared motor axon frequency across three spinal cord levels in all three groups (Fig. 2b). We observed a loss of smaller-diameter UMN axons (3.2–5.6 µm) in the UMN-p ALS group compared with the control and the LMN-p ALS groups across cervical, thoracic, and lumbar levels (Fig. 2b). Although the LMN-p ALS group also showed reductions in smaller-diameter UMN axons relative to controls, this loss was less pronounced than in the UMN-p ALS group (Fig. 2b). To compare the two ALS clinical phenotypes, motor axon counts from each diameter in ALS samples were normalized to their respective controls at each spinal level. The quantification revealed a greater loss of UMN axons across all diameter ranges in UMN-p ALS compared with LMN-p ALS at all three spinal cord levels (cervical, thoracic, and lumbar) (Fig. 2c).
We compared UMN axon loss between the cervical and lumbar spinal cord levels (Fig. 2d). In the UMN-p ALS group, a gradient loss across all UMN axon size ranges was observed in the lumbar relative to the cervical within the lateral CST (Fig. 2d, upper panel), whereas no such gradient was detected in the LMN-p ALS group (Fig. 2d, lower panel). Thus, this suggests that UMN axon loss is worse distally in the axonal projections in UMN-p ALS patients, indicating distal axon loss [15].
Increased foamy microglia co-localization with myelin and UMN axon loss in the lateral CST of UMN-p ALS patients
Foamy microglia, characterized by their lipid-laden appearance and lipid droplet accumulation, are a part of loss of axonal integrity and degeneration in the CST [72], contributing to disease progression and motor neuron and axon loss. Given the overall loss of myelin (Fig. 1) and the reduction of all UMN axon sizes in the lateral CST (Fig. 2) of ALS patients with clinical UMN-p signs during disease, we examined whether inflammatory glial activation occurs within these pathological regions. Strong microglia/macrophage signal identified by using CD68- and Iba1- positive staining (Fig. 3a, c) was observed, co-localizing with myelin loss and axon degeneration in the lateral CST of UMN-p ALS patients. High-magnification images of the lateral CST (Fig. 3b) revealed a combination of myelin loss and axonal loss across different sizes, coinciding with foamy microglia occurring exclusively in UMN-p ALS patients. The quantification revealed a significant increase in round, foamy microglia (Iba1+ cells) within the lateral CST at all three spinal cord levels in UMN-p ALS patients compared to LMN-p ALS and control patients (Fig. 3d). Furthermore, no changes were observed in GFAP-positive reactive astrocytes in the lesioned area or DC between the two ALS phenotypes (UMN-p vs. LMN-p) (data not shown). These findings support the well-recognized involvement of foamy microglia in ALS pathogenesis, linking myelin loss to motor axon degeneration and neuroinflammation in the descending UMN axon tract of UMN-p ALS patients, but do not answer whether these changes are primary or reactive.
Variable loss of motor axon loss in the ventral CST and sensory axons in DC
We also examined the ventral CST, a less well-recognized tract carrying axons from the motor cortex. Although myelin loss was observed (Fig. 1 and Table 2), quantification of axon diameters using the same normalization method yielded variable results that were not consistent with those observed in the CST (data not shown).
In contrast, we also examined sensory axons in the DC for comparison with motor axons in the lateral CST. Interestingly, quantification of sensory axon diameters in the DC across the three spinal cord levels revealed a significant loss of ascending axons only in the lumbar region in UMN-p ALS (Fig. 4, bottom panel), while LMN-p ALS samples showed no sensory axon loss at any level. Notably, no significant myelin loss was observed in the DC (Fig. 1 and Table 2), and foamy microglia were absent in the sensory axon tract of the DC in both ALS phenotypes and control patients (Data not shown). This finding implies that sensory axon loss may represent an early stage, as no myelin loss or microglial activation was observed in the DC by tissue staining.
Axonal TDP-43 was more frequently observed in the CSTs and ventral horn gray matter in sALS cases compared to controls
Mislocalization from the nucleus, cytoplasmic aggregation and phosphorylation of TDP-43 is the hallmark of ALS neuropathology in the cell bodies. Aggregation of phosphorylated TDP-43 has been identified in axons in LMNs [3, 10, 11, 43, 49, 57]. Phosphorylated TDP-43 is rarely observed in the lateral CST consistent across three independent laboratories (Ravits, Loeb and Stokin, data not shown) and it does not appear to have been previously reported [11]. In order to study this further, we measured TDP-43 in the CSTs and the ventral horn in thoracic spinal cords from three phenotypes of sALS patients—UMN-p, LMN-p and typical ALS and in controls (Table 1). While we did not observe abnormal TDP-43 aggregates, when we measured total TDP-43 in axons by colocalizing with pNF-H in this way, it was quantitatively increased in the lateral CST (Fig. 5m, p = 0.04), as well as in the ventral CST (Fig. 5n, p = 0.01) in sALS spinal cords. No significant differences in total TDP-43 levels were observed in sensory axons of the DC between sALS (Fig. 5o(iii), p = 0.54) and control spinal cords (Fig. 5p). Total TDP-43 (red) was also detected in LMN nuclei, with and without cytoplasmic mislocalization (Fig. 5d(ii)), which confirmed the sensitivity of the antibody as previously reported [1]. Notably, axonal TDP-43 fibrils were observed in the ventral horn gray matter in sALS spinal cords (Fig. 5j–l), colabeled with axons (pNF-H, green), and were absent in controls (Fig. 5p, p = 0.001), consistent with other reports in LMNs [3, 10, 11, 43, 49, 57]. When comparing regional TDP-43 differences between the ALS subtypes, only the typical sALS group shows significantly more inclusions in gray matter compared to controls. (Kruskal–Wallis, p = 0.02, data not shown) Thus, TDP-43 is measurably increased in UMN axons in the descending CSTs but may be different in LMN axons in the peripheral nervous system and ventral horn gray matter, suggesting molecular mechanisms of TDP-43 may be different in UMNs compared to LMNs.
Discussion
“Lateral sclerosis”: myelination, axonal degeneration and neuroinflammation in the lateral CST
By focusing on the extremes of clinical phenotypes, we were able to correlate clinical signs of UMN degeneration with the neuropathological changes in the lateral CST, the axon tracts of the UMN, something difficult to do by counting neurons in the motor cortex or quantifying TDP-43 neuropathology. The large-diameter axons originate from Betz cells in the primary motor cortex [50], and form the longest axons in the CST [50], and are known to be preferentially involved in ALS [39, 51, 64, 70]. Our findings extend these observations and find that involvement progresses to smaller axons as well. This supports the complexity of the UMN motor tracts [23, 45, 56] and significant loss of M1 fibers in the ALS brain, as reported only in the NODDI imaging study [26, 35]. The findings also indicate extensive myelin loss and inflammation (Fig. 1).
We speculate that the spatial differences between axon degeneration and demyelination/microgliosis may reflect distinct pathological processes during disease progression. Early UMN axon degeneration likely triggers microglial activation, promoting the clearance of degenerating axons and myelin debris through phagocytosis and axonal pruning. As degeneration progresses, the continued accumulation of myelin debris and ongoing axonal loss may overwhelm the phagocytic capacity of microglia, leading to the formation of lipid-laden, foamy microglia. Consequently, although axon degeneration exhibits a rostro-caudal gradient, demyelination and microglial activation may become more uniformly distributed throughout the CST as the disease reaches its end-stage. This interpretation is consistent with the notion that microgliosis and myelin loss represent downstream responses to chronic axonal degeneration rather than simply mirroring the regional severity of axon loss.
It is certainly possible that axons undergoing distal degeneration have already experienced proximal myelin loss. However, the current study was limited to assessing myelin integrity using immunofluorescence and immunohistochemistry, which do not provide sufficient resolution to determine whether proximal demyelination precedes, accompanies, or follows distal axonal degeneration. Future studies employing higher-resolution techniques, such as electron microscopy, will be necessary to define the temporal and spatial relationship between axonal degeneration and myelin loss along the corticospinal tract. Such studies may also help clarify whether proximal myelin abnormalities represent an early pathological event or develop secondary to ongoing axonal degeneration.
Lateral sclerosis is a distal axonopathy
In our study, we found evidence indicating that degeneration of UMNs is a distal axonopathy; that is, UMNs are “dying back”, a finding previously discussed by others in sporadic ALS [24] and in the context of mutant SOD1-associated ALS neuropathology and experimental mouse models [21, 26] (Table 3). In a neuropathological study of sporadic ALS, C. Davison [24] observed that lateral sclerosis is characterized by degeneration of UMN fibers, most pronounced in the distal segments of the corticospinal tract, a finding also recently re-introduced [21]. In the neuropathological study of mutant SOD-associated ALS, degeneration was observed in the corticospinal tracts but not the cortical neurons, an especially interesting finding in light of the belief that SOD1 mutations in ALS affect LMNs more than UMNs clinically [37]. In the study of the experimental mouse model of mutant SOD1-associated ALS, dying back was established in LMNs, studying the neuromuscular junction, ventral roots, and anterior horn of the spinal cord [29]. This study included one human autopsy in which the LMN was studied by way of the spinal anterior horn and the neuromuscular junction, but the axons of the UMN were not discussed.
| Definition | UMN | LMN | |
|---|---|---|---|
| Dying back | “Dying back” is a term traditionally used to convey a pattern of axon loss that is length-dependent, presumably from the inability of the cell body to maintain the full length of its axon | UMN axons descend in the cortico-spinal tracts, and length-dependent axon loss (“dying back”) manifests as worse caudally than rostrally, causing clinical deficits to be greater in the legs than in the armsAn example is hereditary spastic paraparesis | LMN axons travel in roots and peripheral nerves, and length-dependent axon loss (“dying back”) manifests as retraction from the NMJ and denervation of muscle that is worse in distal muscles than proximal onesExamples are peripheral polyneuropathies, which have a “stocking-glove” patternThis contrasts with segmental patterns, which are based on spinal neuron and root anatomy, such as in spinal muscular atrophy or Guillain-Barré syndrome, or diabetic polyradiculopathies |
| Dying forward | “Dying forward” is a phrase coined specifically for ALS mechanisms, speculating that the motor cortex and UMN have primacy in driving the degeneration of LMNs by an antegrade transneuronal processThe term was deliberately chosen to contrast with the well-recognized “dying back” term (above), unfortunately leading to “dying back” sometimes being misconstrued as a retrograde transneuronal mechanism of motor neuron degeneration | The dying forward hypothesis poses that the failure in ALS is in the cortex, which is driving LMN degeneration in the brainstem and spinal cord; in effect, UMNs are killing LMNsThe explanations for the heterogeneity of ALS phenotypes, especially the variation of somatic sites at onset or variable involvement of UMN and LMN, by a “dying forward” mechanism, are not stated | In the dying forward hypothesis, LMNs are victims of UMNs; LMNs degenerate secondary to or as a consequence of UMN factors |
| Prion-like propagation | “Prion-like propagation” is a term used in neurodegenerative disease biology, including ALS, to speculate that toxicity is linked to factors such as protein folding and templating spreading in neuronal networks, which in ALS is the motor system, both UMNs and LMNsWhen applied to ALS mechanisms, one important distinction with the term “dying forward’ is that it is agnostic about primacy of UMNs or LMNs | Toxic factor (eg, TDP-43 misfolding) is a stochastic molecular event that is randomly located anatomically, variably distributed between UMNs and LMNs, and spread by way of cell-to-cell propagation (contiguously or trans-axonal or in CSF)Once triggered, UMN and LMN degeneration propagate independently anatomically | Heterogeneity of clinical phenotype patterns can be explained based on stochastic anatomic and molecular features that are propagatingThe observation that the initial UMN and LMN clinical deficits appear in the same somatic region suggests that the trigger is within the LMN-UMN network innervating that somatic locus but they propagate independently |
The concept of a “dying back” axonopathy emerged from classic neuropathologic studies of nerve diseases, in which degeneration was observed to begin in the distal portions of long axons and progress proximally toward the cell body [16, 65]. The term “central-peripheral distal axonopathy” was used to describe a unified pattern of length-dependent degeneration affecting both peripheral and central projections [66]. Subsequent mechanistic work linked these observations to impairments in axonal transport and cytoskeletal integrity, providing a biological basis for the vulnerability of distal axons [33]. Collectively, these studies established distal axonopathy as a fundamental and reproducible pattern of neurodegeneration and remain a cornerstone for understanding length-dependent vulnerability in the nervous system.
The classical examples of length-dependent dying back are peripheral polyneuropathies, which typically have a stocking-glove pattern of deficits. When peripheral neuropathies are not length-dependent, the term neuronopathy is often invoked to distinguish this from axonopathy, and the pattern is often referred to as segmental or radicular. Examples of such segmental or radicular patterns in the motor system are spinal muscular atrophy (which is a disease of the spinal motor neurons), Guillain–Barré syndrome (which is a disease causing demyelination especially involving motor nerve roots), and a rare complication of diabetes called diabetic polyradiculopathy (which is distinct from the common diabetic polyneuropathies, which are indeed dependent on length).
This concept of dying back or distal axonopathy is complex and difficult to characterize in ALS because the motor system has two tiers. (Table 3). The UMNs travel in the corticospinal tracts and synapse on lower motor segments. The length-dependent clinical pattern produced by their degeneration affects the legs more than the arms. By contrast, the LMNs travel through the motor roots and peripheral nerves and synapse on muscle fibers. The length-dependent clinical pattern produced by their degeneration affects distal muscles more than proximal ones within the same limb (both arms and legs). Since ALS begins focally in any somatic region, and variably involves UMN and LMN degeneration, clinical patterns of length-dependent axonopathy are easily masked from detection. Further, length-dependent abnormalities are difficult to detect when considering whether the axons are part of a monsynaptic or polysynaptic pathway. The fact that the largest diameter axons in the corticospinal tract display the most involvement in previous studies [51, 64, 70] is consistent with a dependence on length—the largest diameter axons are monosynaptic, and since monosynaptic, also longest. The length of axons in polysynaptic pathways, by contrast, is shorter, but their distal ends are essentially unknown, depending on the number of neurons that comprise the pathway. Our quantitative neuropathological study, which examines the extremes of clinical phenotypes, has unmasked dependence on length and shown involvement of polysynaptic as well as monosynaptic components of the UMN tier.
Dying back, distal axonopathy, or length-dependent axonal pathology, are historically descriptive terms for distal-to-proximal axonal degeneration and are noncontroversial. It seems likely that they are caused by a proximal failure in the neuron, likely in the cell body, and that distal axons are affected secondarily. In favor of this is the recently emerging evidence of TDP-43 loss-of-function in STMN2 [42, 48], UNC13A [13, 47], and many other transcripts [75]. When TDP-43 mislocalizes from the nucleus, genes that are modulated by it may be reduced by way of polyadenylation or nonsense-mediated decay. STMN2 plays an important role in axon maintenance and regeneration, and UNC13A plays an important role in neuromuscular junction function. Thus, loss of TDP-43 function in the nucleus leads to failure distally. This has been mainly studied in LMNs, and the role of TDP-43 loss of function in UMNs remains a relative blind spot and easily overlooked, for example, in iPSC models of motor neurons and omics studies of human brain tissue. TDP-43 may function differently in UMNs than in LMNs.
The term “dying forward” in the ALS literature has parlayed on the terms of dying back and in so doing, can be easily confused. The main source of confusion is mixing patterns (distal dying back) with mechanisms (dying forward, which is speculative). The first use of the term “dying forward” in ALS was in 2001 [27] in one of the many iterations of a hypothesis that first appeared in 1992, positing the motor cortex as the driver of ALS [26]. According to this hypothesis, ALS is driven by transneuronal antegrade transmission of a toxic factor from the motor cortex. The term was chosen to contrast with dying-back, a pattern well known to neurologists. The dying forward hypothesis has more recently been referred to as “corticofugal axonal spread” [9]. This hypothesis has served as a basis for many observational papers related to neuroexcitatory toxicity and neurophysiological studies involving magnetic stimulation of the cortex, but only rarely supported experimentally [71]. The hypothesis has been criticized for many reasons [38, 40, 52, 68], recently, for its inability to explain the heterogeneity of motor phenotypes [55]. While dying forward is hypothesizing a mechanism, dying back is not—that is, it does not mean that the axons are killing the neurons (sick neurons are going to have sick axons, and this is going to be worse distally) or that LMNs are killing UMNs. That one motor tier (eg UMN) is more important in pathogenesis than the other (eg, LMN) or vice versa is specultative [4, 25, 27].
Neuroinflammation contributes to motor neuron degeneration and disease progression in ALS, making it a potential target for therapeutic interventions [12, 34, 46, 74]. We [62] and others [12, 36] previously reported that microglial pathology, as indicated by CD68 and Iba1 expression, is significantly more extensive in the CST of ALS cases. The extent of microglial activation and myelin loss in the CST correlates with disease progression and the severity of UMN deficits [12, 36, 62]. Here, we present findings demonstrating a combined loss of myelin (Fig. 1) and axons of all sizes in the lateral CST (Fig. 2), which coexists with a unique subtype of activated inflammatory microglia/macrophages (Fig. 3). While foamy phagocytes have been primarily studied in multiple sclerosis [32, 72], our data suggest that they also play a significant role in ALS pathology. These foamy microglia characterized and subtyped by immunohistochemical methods, may contribute to disease progression through their phagocytic activity and inflammatory properties, or they may be secondary effects clearing the deteriorating axons.
We propose that homeostatic CNS microglia transform into inflammatory foamy microglia in response to axonal loss and myelin loss in the lateral CST at early disease stages in UMN-p ALS patients. Additionally, foamy macrophages were frequently observed in areas of motor neuron loss and gliosis within the anterior horn of the spinal cord, suggesting that peripheral innate immune cells may also interact with CST pathology [20]. The extremely tight spatial correlation between foamy microglia and regions of the CST with the most severe myelin and axonal loss could be compatible with these cells representing either an upstream pathogenic driver or a secondary phagocytic and remodeling response to preexisting axonal degeneration. Understanding these neuroinflammatory interactions could provide valuable insights into developing targeted therapies and biomarkers, paving the way for more precise ALS treatments.
On the other hand, clinically, some ALS patients with UMN-p signs may exhibit slower disease progression and longer survival; however, in this series, they showed the most dramatic CST myelin and axonal loss, accompanied by prominent microglial accumulation. Possible explanations include a prolonged preclinical period characterized by slow but relentless CST degeneration, and the capacity of the CST to accumulate extensive structural damage without a proportionate impact on short-term survival when LMNs are relatively spared. Our clinical–neuropathological findings in the two specific clinical phenotypes suggest that axons of all calibers support distal vulnerability in lateral sclerosis in UMN-p ALS samples; however, given the small sample sizes in each phenotype group, the current data could not distinguish between a primary “dying-back” process and advanced tract involvement in end-stage disease.
Furthermore, at disease onset, most patients exhibit left-to-right asymmetry in their clinical symptoms. However, as disease progresses most patients become diffuse and symmetrical and, in the end-stage autopsy samples, we did not observe a clear or consistent left-to-right asymmetry in CST pathology, nor did we find a consistent correlation between pathological asymmetry and the initial clinical presentation. At the end stage of the autopsy samples (after individual diagnosed ALS disease onset 0.9–12 years, Table 1), we did not observe a clear or consistent relationship between the site of clinical symptom onset and the extent of neurodegeneration, demyelination, or microgliosis in either ALS subtype. In the end-stage autopsy samples, we found that patients with bulbar-onset ALS exhibited CST axon loss in the lumbar spinal cord and the cervical spinal cord. This observation suggests that degeneration of UMN axons projecting to the lumbar spinal cord progresses independently of the initial site of somatic involvement at disease onset. There are two independent axes of UMN degeneration: one is the site of onset and the other is the degree of UMN degeneration with respect to the degree of LMN degeneration.
In addition, the classical mixed-presentation ALS cases (with both UMN and LMN clinical involvement) were not included in the present study because they have recently been reported in our publication in Scientific Reports [21]. In that study, end-stage pathology of the mixed-presentation ALS cases showed a pattern of CST UMN axon loss that was similar to that observed in the UMN-p group in the current study. This finding is consistent with the presence of significant UMN clinical involvement in mixed-presentation cases.
Observations in the ventral CST and DC
Our studies shed light on two other spinal tracts, the ventral CST and the DC. The ventral CST, which contains uncrossed fibers and only comprises approximately ten to twenty-five percent of corticospinal fibers [61, 67]. These anatomical variations may explain the inconsistency with which myelin and axon loss were observed in the ventral CST in the lumbar spinal cord of UMN-p ALS spinal cord (Fig. 1 and Table 2). Due to variability and inconsistency between the two normalization methods—originally optimized for the lateral CST—we were unable to draw definitive conclusions regarding axon changes in the ventral CST although there is trend that axon loss in the ventral CST fully contributes to ALS pathology [6, 14, 37, 51, 53, 73].
Interestingly, we found that sensory axon loss in DC predominantly affects lumbar regions (Fig. 4). To the best of our knowledge, this is the first report on sensory axon loss in the lumbar spinal cord using systematic quantification methods, comparing three spinal cord levels in UMN-p ALS to LMN-p ALS relative to controls. Other studies have reported sensory axon loss in the DC of the lumbar spinal cord as part of the broader multisystem involvement in ALS, supporting the inclusion of sensory neuropathy among the non-motor manifestations of the disease [8, 41, 58]. While sensory involvement is not a clinical feature of the disease, occasional sensory symptoms are observed. It is possible that the mechanisms of sensory axon degeneration in the DC (Fig. 4) are different from motor axon degeneration in the lateral CST (Fig. 2), as no myelin loss (Fig. 1 and Table 2) and no foamy microglia (Fig. 3) were observed in the DC. Further understanding of the multisystem nature of ALS is an important future area to be studied.
Increased frequency of axonal TDP-43 instances in the CSTs and the gray matter of sALS spinal cords
Axonal TDP-43 has been observed in the human ALS motor cortex and medulla [11], ALS patient-derived induced pluripotent stem-cell (iPSC) MNs [3], human and mouse ALS peripheral nerves [57], and ALS transgenic mouse models [3]. To our knowledge, this is the first reporting of axonal TDP-43 pathology in both the CST and gray matter of the spinal cord in sALS (Fig. 5). Axonal TDP-43 pathology along the CST has been proposed to contribute to ALS pathogenesis by mediating trans-axonal spread of disease between the motor cortex and spinal motor neurons; however, in patients this has largely been inferred rather than directly demonstrated. Our findings demonstrate increased total TDP-43 signal within CST axons and LMN axonal regions, rather than classic phosphorylated inclusions; the functional significance of this subtle increase remains speculative. These observations may be interpreted as evidence of compartment-specific TDP-43 dysregulation that differs between axons and cell bodies of UMNs and LMNs, and as a stimulus for future mechanistic studies.
To our knowledge, axonal phospho-TDP-43 pathology within the human lateral CST has not been previously reported. Most previous studies have focused on phospho-TDP-43 aggregates in neuronal cell bodies and glial cells rather than within axons. Based on our analyses, phospho-TDP-43 immunoreactivity was only rarely observed [OR NOT OBSERVED AT ALL] in the lateral CST by either immunohistochemistry or immunofluorescence. This finding was independently confirmed in three separate laboratories, but the staining was too infrequent and inconsistent to permit meaningful quantitative analysis; therefore, these data were not included in the manuscript. Although Western blotting could, in principle, provide quantitative information, and we have been working on this unsuccessfully thus far—the approach is technically challenging for the lateral CST because it requires precise microdissection of this relatively small white matter tract from individual postmortem spinal cord specimens, limited amount of tissue, and purification of protein from soluble and insoluble fractions. We are continuing to work on this.
Conclusions
Our findings demonstrate that "lateral sclerosis"—a key feature of ALS—reflects multiple pathological changes: UMN axonal degeneration, myelin loss, inflammatory foamy microglia and length-dependence (‘dying back’). The presence of total TDP-43 was observed in UMN axons in both UMN-p and LMN-p ALS phenotypes. This co-occurrence suggests that neuro-glial interactions within the lateral CST underlie disease progression and the importance of studying UMN from LMN axon biology in ALS pathogenesis [28].