- 肿瘤出芽(TB,<5 个细胞)与低分化细胞簇(PDC,≥5 个细胞)以人为的 5 细胞界值区分;作者提出「瘤周恶性细胞灶」(PMCF):浸润前沿由 ≥1 个肿瘤细胞构成的非腺性灶,在热点区 ×20 物镜视野(0.785 mm²)计数,≥3 个为高级别。
- 中国 6 家中心 2611 例内镜或手术切除的 pT1 结直肠癌(训练队列 1108、验证队列 1503):多因素分析中 TB 在两队列均非独立危险因素,PDC 仅在验证队列独立;高级别 PMCF 在两队列均为淋巴结转移独立危险因素(多因素 OR 2.089 与 3.316)。
- 高级别 PMCF 与更多转移淋巴结数相关,与 D3(及跳跃性)淋巴结转移关联强于 D1/D2;观察者间一致性 Kappa 0.700(PDC 0.719,TB 0.563)。
- 基于 PMCF 的预测模型在两队列均优于 JSCCR、ESMO、NCCN 指南,并提供网页计算器。附 6 幅图、7 个表。
收录范围:AJSP 开放获取全文(CC BY-NC-ND 4.0,Ovid/LWW 页面)摘要、引言、材料与方法、结果、讨论与致谢,6 幅图及 7 个表(含表注);参考文献与补充数字内容未收录,上标数字为原文参考文献序号。
摘要
作为在肿瘤浸润前沿以人为设定的5个肿瘤细胞为界值划分的生物标志物,肿瘤出芽(TB)和低分化细胞簇(PDC)被认为是pT1期结直肠癌(CRC)淋巴结转移(LNM)的高危因素。然而,相关研究结果仍不一致。此外,pT1 CRC中肿瘤浸润前沿生物标志物与D3 LNM之间的关联仍不清楚。为确定一种能够涵盖肿瘤浸润前沿完整形态谱、无需此类界值即可预测pT1 CRC中LNM,尤其是D3 LNM的生物标志物,我们将瘤周恶性细胞灶(PMCF)定义为肿瘤浸润前沿由≥1个肿瘤细胞组成的非腺样细胞灶。在纳入中国6家高诊疗量医疗机构的2611例接受内镜或外科切除的pT1 CRC患者后,我们发现,TB和PDC在训练队列与验证队列中均未表现出与LNM一致的独立关联。相比之下,PMCF在两个队列中均为独立危险因素,且具有更优的LNM风险分层能力(P<0.05)。在按年龄、性别、肿瘤部位和BMI分层的亚组分析中,PMCF与LNM的关联仍具有统计学意义(P<0.05)。此外,PMCF与更多的转移淋巴结数目相关,且其与D3 LNM的关联强于与D1和D2 LNM的关联(P<0.05)。总之,PMCF不仅提示pT1 CRC患者在内镜切除后需要追加根治性手术,还可能提示需要D3淋巴结清扫。PMCF为优化pT1 CRC的外科决策提供了循证依据。
引言
肿瘤出芽(TB)和低分化细胞簇(PDC)是肿瘤浸润前沿的典型生物标志物。由于仅10%至15%的pT1期结直肠癌(CRC)患者发生淋巴结转移(LNM),1现行指南将高级别TB视为LNM的危险因素,并建议在内镜切除(ER)后追加根治性手术(RS),以实现pT1 CRC的LNM风险分层。2–4然而,新近证据提示,在校正PDC后,TB与LNM的关联不再存在。5,6尽管PDC显示出预测pT1 CRC中LNM的潜力,6,7但将PDC与TB人为分开的5个肿瘤细胞界值,无法反映肿瘤浸润前沿连续的形态谱及生物学连续性,并阻碍了二者的临床应用。8,9由于二者的分子特征广泛重叠,10,11在CRC中联合评估TB和PDC将比单独评估任一指标具有更好的预后预测效能。12,13Haddad等8报道,以≤5个细胞作为界定肿瘤细胞簇大小的阈值,可对I至III期CRC患者的无病生存进行最佳分层。8因此,全面评估肿瘤浸润前沿的形态学特征至关重要。然而,对于能够涵盖肿瘤浸润前沿完整形态谱、用于预测pT1 CRC中LNM并指导追加RS的生物标志物,相关研究仍然有限。
大量研究表明,主淋巴结转移(D3 LNM)是CRC预后不良的指标。14,15因此,准确识别D3 LNM对于确定pT1 CRC患者的淋巴结清扫范围具有重要意义。然而,pT1 CRC中D3 LNM的危险因素仍大多不明,尤其是肿瘤浸润前沿生物标志物与D3 LNM之间的关联。尽管pT1 CRC中D3 LNM的发生率为0.3%,2部分患者可能并无D3淋巴结清扫的指征。因此,这些关键认知空白使外科医生缺乏充分证据来确定D3淋巴结清扫的必要性,以及识别最可能从D3清扫中获益的pT1 CRC患者。因此,完善pT1 CRC外科决策的循证依据十分迫切。
为解决这些临床困境和认知空白,我们提出瘤周恶性细胞灶(PMCF),并将其定义为肿瘤浸润前沿由≥1个肿瘤细胞组成的非腺样细胞灶。因此,我们旨在评估PMCF对pT1 CRC中LNM的预测效能,并探索其与D3 LNM的关联。
材料与方法
研究队列
从中国6家高诊疗量医疗机构收集pT1 CRC患者的临床资料。纳入经病理确诊为pT1 CRC、仅接受ER、初始RS或ER后追加RS的患者。对于仅接受ER及ER后追加RS的患者,使用内镜标本和手术标本进行病理评估。对于接受初始RS的患者,使用手术标本进行病理评估。根据日本大肠癌研究会(JSCCR)指南,2对于具有以下一项或多项危险因素的患者,建议在ER后追加RS及淋巴结清扫:(1)脉管侵犯(LVI)阳性;(2)低分化腺癌、印戒细胞癌或黏液癌;(3)TB分级为BD 2/3;(4)黏膜下浸润深度≥1000 µm;(5)垂直切缘阳性。由于身体状况及个人意愿,部分患者拒绝追加RS。排除具有以下情况的患者:(1)同时性或异时性CRC;(2)炎症性肠病;(3)家族性腺瘤性息肉病或Peutz–Jeghers综合征;(4)其他器官恶性肿瘤;(5)新辅助化疗或放疗;(6)诊断时有远处转移;(7)仅接受ER后随访<5年;(8)临床资料缺失。共纳入2611例患者。来自中山大学附属第六医院的1108例pT1 CRC患者(2010年2月至2025年5月)作为训练队列。共纳入1503例患者作为验证队列,其中包括中山大学肿瘤防治中心473例(2015年4月至2024年8月)、韶关市粤北人民医院111例(2014年1月至2024年11月)、吉林大学白求恩第三医院270例(2017年7月至2025年5月)、哈尔滨医科大学附属第二医院263例(2018年4月至2025年5月)以及深圳市人民医院208例(2014年1月至2024年11月)。此外,按照相同标准,从中山大学附属第六医院前瞻性纳入的178例患者(2025年6月至2026年1月)也被纳入验证队列。本项纯观察性研究遵循《赫尔辛基宣言》,并获得中山大学附属第六医院机构伦理委员会(编号2025ZSLYEC-299)及其他参与中心的批准。每位参与者均在入院时签署书面知情同意书。
样本量计算
研究开始前,采用每变量事件数(EPV)方法估算样本量。16基于经典且广泛采用的EPV为10,17假设LNM阳性率为10%至15%,1并有22个候选变量,所需样本量范围计算如下:
样本量范围
=
EPV
×
变量数
发生率
=
10
×
22
0.10
~
0.15
=
1
,
467
~
2200
总队列的2611例患者显著超过这一范围,确保了分析所需的充足样本量。
组织学评估与临床资料收集
从各机构病理档案中调取所有苏木精-伊红(H&E)染色及免疫组织化学(IHC)染色的肿瘤切片。所有组织学参数均采用包括最深浸润部位在内的全肿瘤纵切面进行评估。为确保病理评估的严谨性,由2名经验丰富的胃肠病理医师(X.L.和Q.Z.)在不知晓临床结局的情况下,独立复核所有肿瘤切片(n=2611,共13,881张切片)。初次复核意见不一致时,经第3名病理医师(C.W.)复核并共同讨论达成共识。
TB和PDC
TB定义为肿瘤浸润前沿孤立的单个肿瘤细胞,或由<5个肿瘤细胞组成且无腺样结构的细胞簇。18简言之,低倍镜下扫描所有肿瘤切片的浸润前沿,以确定TB密度最高的区域。确定热点区域后,在×20物镜下(0.785 mm2)计数出芽数目。根据国际肿瘤出芽共识会议(ITBCC)的建议,将TB分为1级(0至4个出芽)、2级(5至9个出芽)或3级(≥10个出芽)。19根据JSCCR指南,2将1级归为低级别(图1A),将2级和3级归为高级别(图1B)。
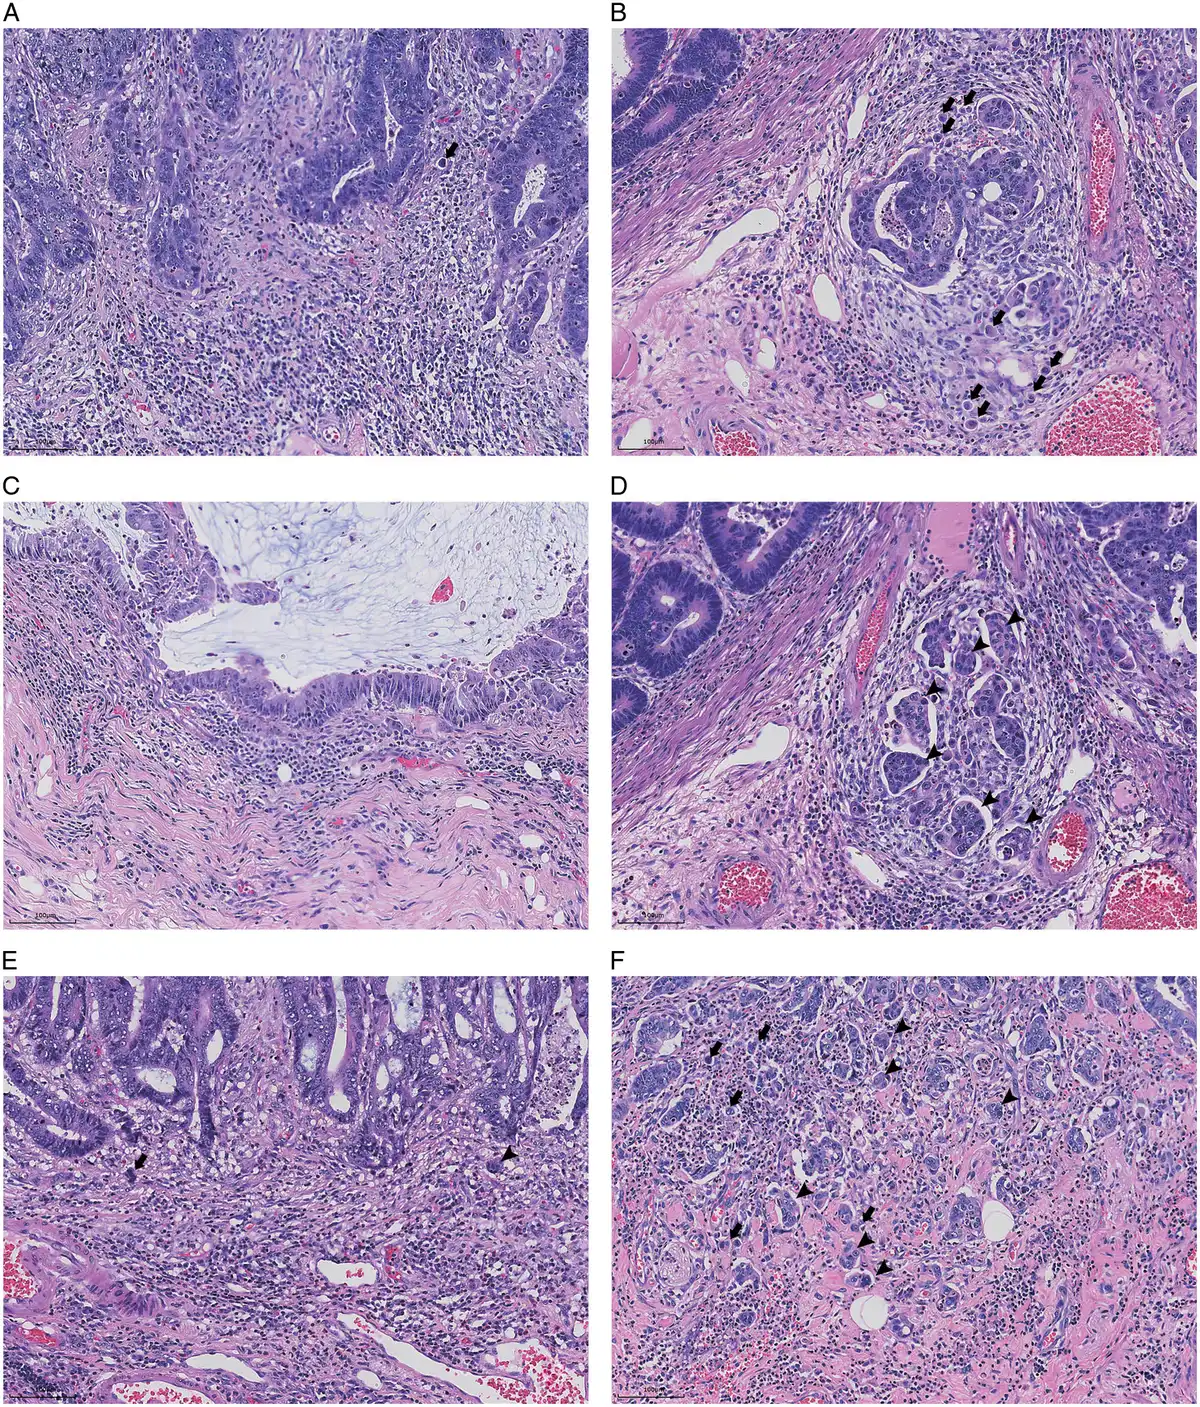
PDC定义为肿瘤浸润前沿由≥5个肿瘤细胞组成、无腺样分化证据的细胞簇。20同样,仔细扫描所有肿瘤切片的浸润前沿,以确定PDC密度最高的区域。定位热点区域后,对PDC进行计数,并根据其是否存在分为阴性(图1C)或阳性(图1D),评估采用×20物镜(0.785 mm2).7
瘤周恶性细胞灶
我们将PMCF定义为肿瘤浸润前沿由≥1个肿瘤细胞组成的非腺样细胞灶。首先,评估所有肿瘤切片的肿瘤浸润边缘,以确定PMCF密度最高的区域。在×20物镜下,于热点区域(0.785 mm2)进行PMCF计数。由于PMCF在训练队列和验证队列中均被确定为LNM的独立危险因素(补充表S1,补充数字内容1,补充数字内容1,https://links.lww.com/PAS/C439),因此根据训练队列的约登指数,将最佳界值确定为3(补充图S1,补充数字内容2,补充数字内容1,https://links.lww.com/PAS/C439)。PMCF<3个的肿瘤归为低级别(图1E),PMCF≥3个的肿瘤归为高级别(图1F)。具体而言,任何被定义为PMCF的细胞灶也被计为TB或PDC。
其他临床资料与组织学参数
从电子病历系统中提取临床及人口学信息,包括年龄、性别、体质指数(BMI)、肿瘤部位、肿瘤大小、CRC家族史、术前增强CT报告、结肠镜图像及血清肿瘤标志物报告。
根据WHO标准,肿瘤分级(TG)分为高分化、中分化、低分化腺癌、黏液癌和印戒细胞癌。21对于含有一种以上成分的肿瘤,根据分化最差的成分确定分级。通过IHC染色,以染色阳性的肿瘤细胞百分比评估Ki-67表达。由于Ki-67和术前癌胚抗原(pre-CEA)等连续变量在训练队列和验证队列中也均被确定为LNM的独立危险因素(补充表S1,补充数字内容1,https://links.lww.com/PAS/C439),因此通过训练队列中的ROC,将其最佳界值分别确定为75%和4.90(补充图S1,补充数字内容2,补充数字内容1,https://links.lww.com/PAS/C439)。LVI定义为淋巴管或血管内存在肿瘤细胞。22根据NCCN指南3,4和美国多学会工作组指南,23当H&E染色中LVI不明确时,采用抗D2-40抗体和抗CD34抗体进行IHC染色。神经侵犯(PNI)定义为神经鞘被肿瘤细胞包绕。24根据JSCCR指南测量黏膜下浸润深度。2简言之,在能够辨认或推定黏膜肌层(MM)时,从其下缘测量至最深浸润处,作为浸润深度。当无法辨认或推定MM时,从肿瘤表面测量至最深浸润前沿,作为浸润深度。对于MM纠结的有蒂病变,以肿瘤头部与颈部交界处(Haggitt第2水平)作为参考线。局限于头部的浸润记录为0 μm(头部浸润),超出头部的浸润(蒂部浸润)则从参考线测量至最深浸润前沿。借助抗结蛋白抗体评估MM状态:肌纤维仍可辨认时归为1级,肌纤维严重碎裂或完全缺失时归为2级。25背景腺瘤(BGA)定义为与癌相连续的腺瘤成分。26根据美国临床肿瘤学会(ASCO)指南评估HER-2的IHC染色结果。27,28采用IHC染色确定错配修复(MMR)蛋白(MLH1、PSM2、MSH2和MSH6)的表达。所有MMR蛋白染色均完整的标本归为MMR功能完整(pMMR)。缺乏完整MMR蛋白表达的肿瘤归为MMR功能缺陷(dMMR)。D2-40、CD34、HER2、Ki67和MMR的IHC技术规格列于补充数字内容3,补充数字内容1,https://links.lww.com/PAS/C439.
肿瘤部位分为右半结肠(盲肠、升结肠和横结肠)以及左半结肠和直肠(降结肠、乙状结肠和直肠)。福尔马林固定后测量肿瘤最大直径。根据巴黎内镜分型评估肿瘤形态,29并将其分为凹陷型(IIc、III、Is+IIc、IIa+IIc或IIc+IIa)和非凹陷型(Ip、Isp、Is、IIa或IIb)。BMI分为非超重(BMI <24 kg/m²)和超重(BMI ≥24 kg/m²)。50岁前确诊CRC的患者归为早发性(EOCRC),50岁及以上者归为晚发性(LOCRC)。
研究结局评估
对于接受初始或追加RS的患者,通过对切除的淋巴结标本进行病理检查确定LNM。对于仅接受ER的患者,根据JSCCR指南,需要随访≥5年。2通过增强CT扫描评估LNM。30,31如果增强CT扫描结果显示5年或更长时间内未出现区域淋巴结(LN)复发,则将患者定义为LNM阴性;如果在随访期间任何时间出现区域LN复发的影像学证据,则归为LNM阳性。
采用增强CT诊断区域LN复发依据以下标准:(1)最大短轴直径>5 mm;(2)淋巴结密度或强化异常;(3)淋巴结坏死或边界不清;(4)淋巴结成团或与邻近器官或血管融合。出现上述任一特征的病灶均定义为LN复发阳性。所有参与机构均采用相同标准。
按照《日本大肠癌分类》划分区域LN站。32简言之,第一站LN(D1)定义为结肠旁/直肠旁淋巴结,第二站LN(D2)为中间淋巴结,第三站LN(D3)为主淋巴结。跳跃性转移定义为远端区域淋巴结站存在肿瘤转移,而近端站未受累。否则定义为非跳跃性转移。
建立LNM预测模型
在训练队列中,采用双向逐步回归筛选20个候选变量,变量选择中排除TB和PDC。最终保留14个关键预测因子以构建逻辑回归(LR)模型:LVI(阳性与阴性)、PNI(阳性与阴性)、Pre-CEA(ng/mL)、BGA(存在与缺如)、PMCF(低级别与高级别)、肿瘤形态(凹陷型与非凹陷型)、TG(高/中分化与低分化/印戒细胞癌/黏液癌)、HER-2(−/1+与2+/3+)、Ki-67(%)、CRC家族史(有与无)、肿瘤部位(右半结肠与左半结肠/直肠)、MM状态(1级与2级)、肿瘤大小(mm)以及CT检查(阳性与阴性)。
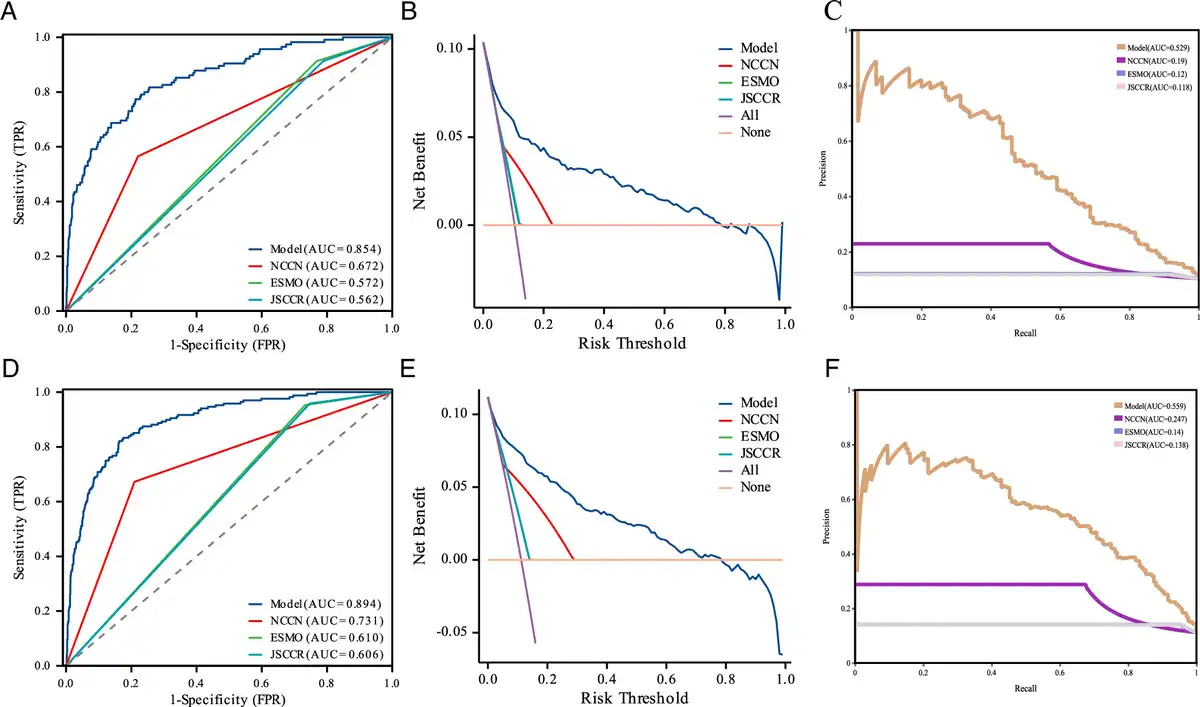
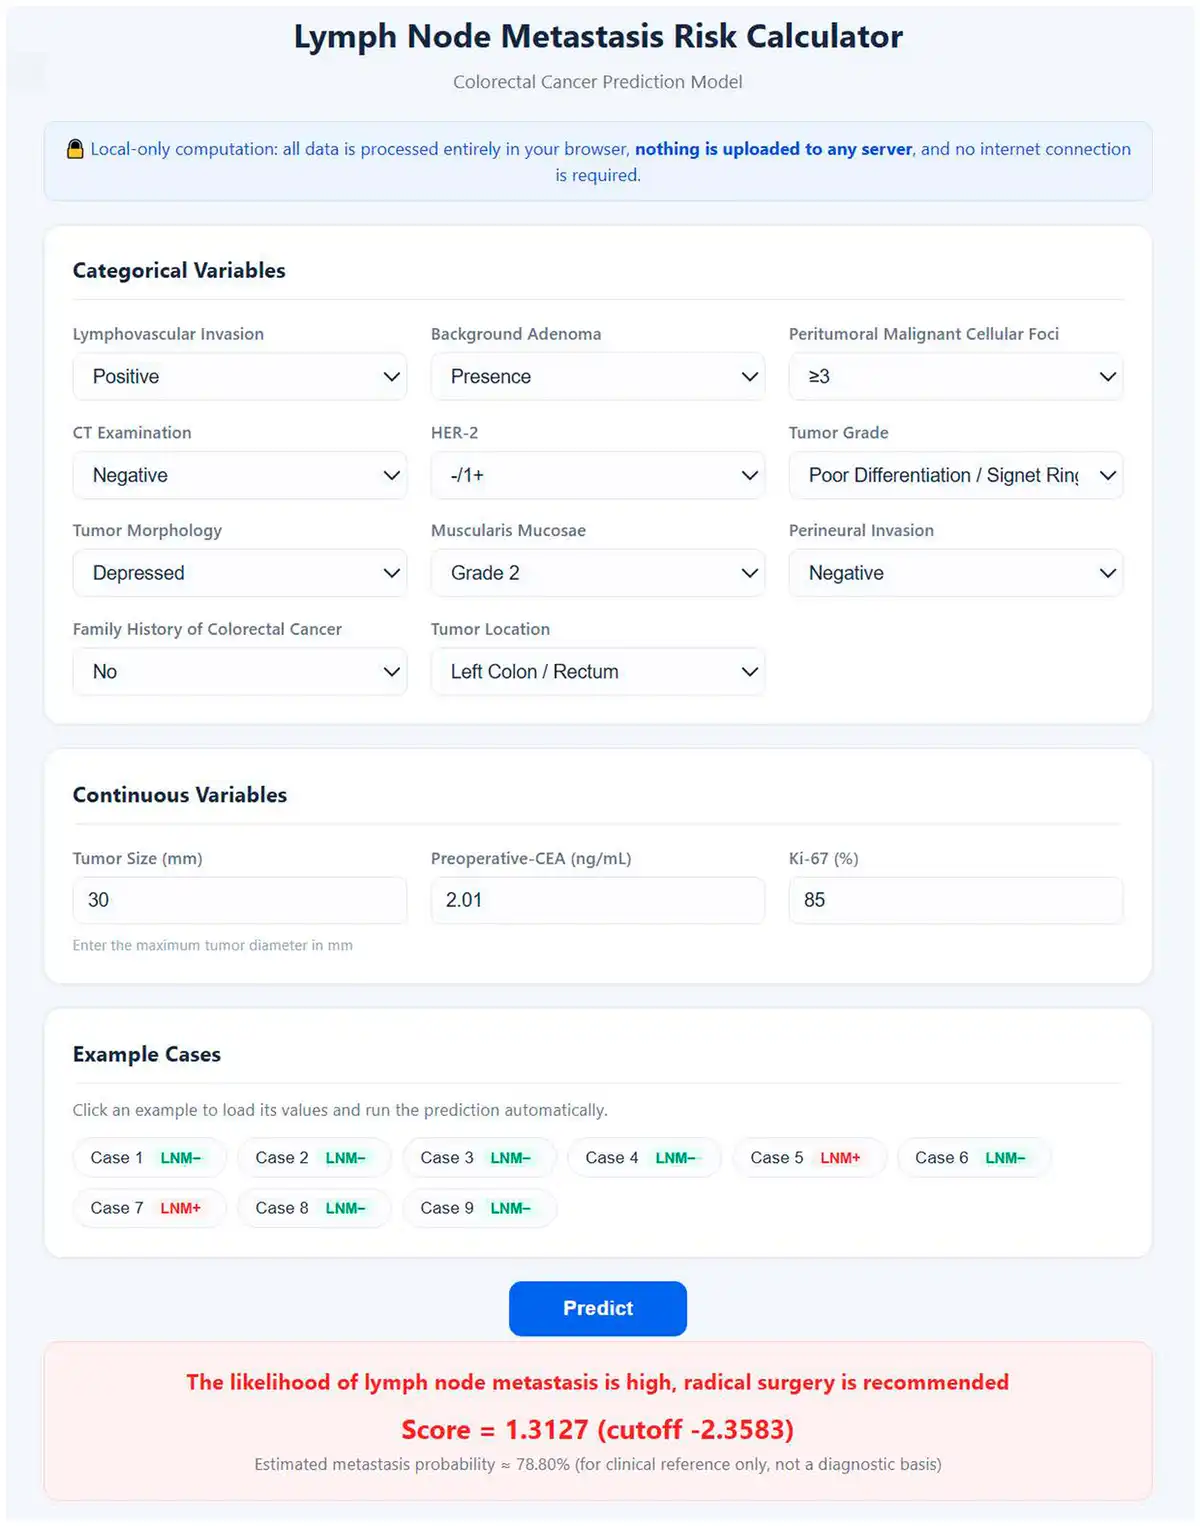
采用以下公式计算风险评分:−5.6218+1.75374*LVI +0.14447*Pre-CEA +0.02534*Ki-67-0.85757*BGA +0.80265*PMCF +0.75279*CT检查+1.11027*HER-2+1.1447*TG+0.81415*肿瘤形态+0.70308*MM状态 +1.62325*PNI −1.20887*CRC家族史+0.59778*肿瘤部位-0.01561*肿瘤大小。通过约登指数确定最佳界值为−2.3583。随后将相同公式及界值应用于验证队列。在训练队列和验证队列中,采用受试者工作特征(ROC)、精确率-召回率曲线(PR)及决策曲线分析(DCA),全面比较模型与现行指南的预测效能。为便于临床应用,我们开发了一个网页计算器。
根据JSCCR指南,2具有以下一项或多项危险因素的患者被定义为LNM高风险,并建议追加RS:(1)LVI阳性;(2)低分化腺癌、印戒细胞癌或黏液癌;(3)TB分级为BD 2/3;(4)黏膜下浸润深度≥1000 µm。ESMO指南未包含高级别TB这一危险因素,33,34而NCCN指南未纳入浸润深度。3,4
观察者间一致性
我们随机选取此前由上述2名病理医师(X.L.和Q.Z.)独立复核的50例病例的原始记录,评估TB、PDC和PMCF的观察者间一致性。
统计学分析
连续变量以均值±SD表示,并根据其分布采用t检验或Wilcoxon检验进行比较。分类变量以频数和百分比表示。采用多变量LR识别独立危险因素。为评估危险因素的效应是否在按年龄、性别、肿瘤部位和BMI分层的各亚组间存在显著差异,进行了交互作用检验(交互作用P)。在多项LR中,采用自由度为1的似然比检验(异质性P)评估各LNM亚组间危险因素效应的异质性。简言之,该检验比较了两种模型:一种允许危险因素与LNM的关联因转移亚型而异,另一种则假设存在共同关联。35采用ROC结合DeLong检验及PR评估预测效能。通过DCA量化一系列阈值概率下的净获益。计算Cohen Kappa系数以量化观察者间一致性。双侧P值<0.05视为具有统计学意义。所有统计分析均使用R(4.4.0版)完成。
结果
基线临床信息
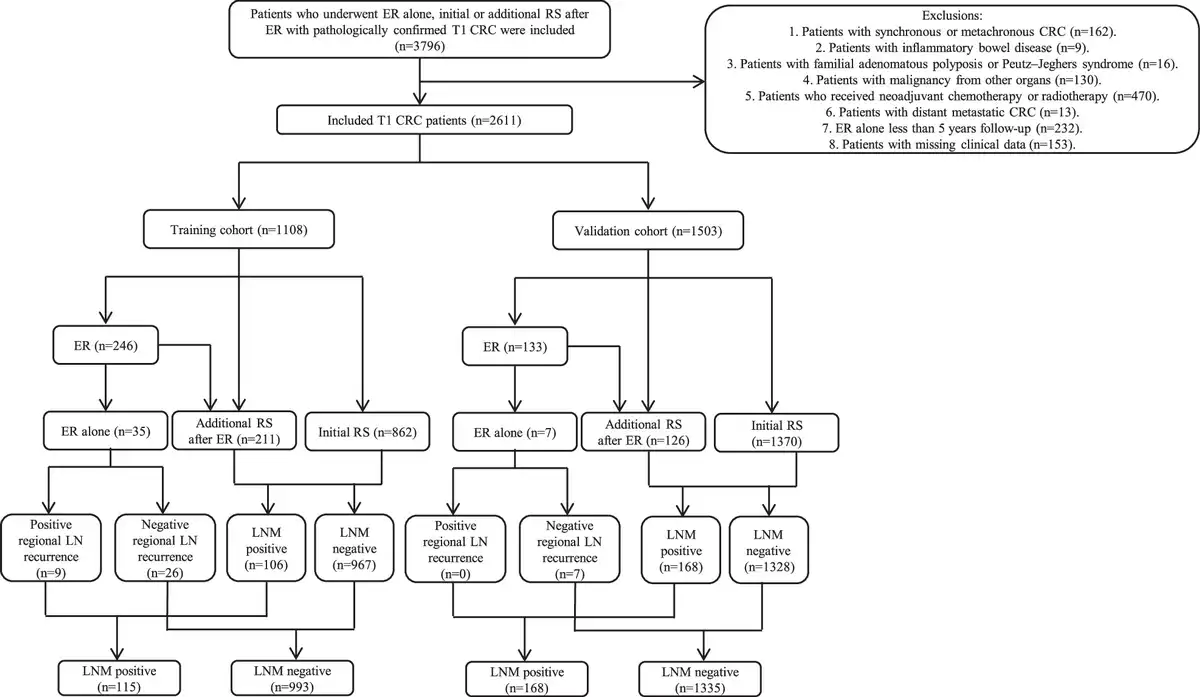
训练队列中115例(10.4%)患者为LNM阳性,验证队列中168例(11.2%)患者为LNM阳性。总体LNM阳性率为10.8%。所有患者的人口学及临床特征汇总于表1。患者流程图见图2。
| 特征 | 训练队列(n=1108) | 验证队列(n=1503) | P |
|---|---|---|---|
| 性别(%) | |||
| 男性 | 629 (56.8) | 819 (54.5) | 0.247 |
| 女性 | 479 (43.2) | 684 (45.5) | |
| 年龄(岁) | 58.9±11.8 | 60.5±10.4 | 0.001 |
| BMI (kg/m2) | 23.2±3.1 | 23.4±3.2 | 0.441 |
| 肿瘤部位(%) | |||
| 右半结肠 | 155 (14.0) | 266 (17.7) | 0.011 |
| 左半结肠和直肠 | 953 (86.0) | 1237 (82.3) | |
| LVI (%) | |||
| 阴性 | 1011 (91.2) | 1348 (89.7) | 0.183 |
| 阳性 | 97 (8.8) | 155 (10.3) | |
| PNI (%) | |||
| 阴性 | 1100 (99.3) | 1460 (97.1) | <0.001 |
| 阳性 | 8 (0.7) | 43 (2.9) | |
| 肿瘤分级(%) | |||
| 高分化/中分化 | 1034 (93.3) | 1329 (88.4) | <0.001 |
| 低分化/Sig/Muc | 74 (6.7) | 174 (11.6) | |
| 肿瘤大小(mm) | 23.2±12.3 | 24.1±12.9 | 0.073 |
| 浸润深度(µm)(%) | |||
| <1000 | 263 (23.7) | 426 (28.3) | 0.008 |
| ≥1000 | 845 (76.3) | 1077 (71.7) | |
| 形态(%) | |||
| 非凹陷型 | 955 (86.2) | 1335 (88.8) | 0.043 |
| 凹陷型 | 153 (13.8) | 168 (11.2) | |
| TB (%) | |||
| 1级 | 942 (85.0) | 1325 (88.2) | 0.190 |
| 2/3级 | 166 (15.0) | 178 (11.8) | |
| PDC (%) | |||
| 阴性 | 809 (73.0) | 959 (63.8) | <0.001 |
| 阳性 | 299 (27.0) | 544 (36.2) | |
| PMCF (%) | |||
| 低级别 | 755 (68.1) | 1053 (70.1) | 0.294 |
| 高级别 | 353 (31.9) | 450 (29.9) | |
| 黏膜肌层(%) | |||
| 1级 | 328 (29.6) | 290 (19.3) | <0.001 |
| 2级 | 780 (70.4) | 1213 (80.7) | |
| BGA (%) | |||
| 缺如 | 363 (32.8) | 245 (16.3) | <0.001 |
| 存在 | 745 (67.2) | 1258 (83.7) | |
| CRC家族史(%) | |||
| 无 | 1071 (96.7) | 1468 (97.7) | 0.119 |
| 有 | 37 (3.3) | 35 (2.3) | |
| MMR (%) | |||
| pMMR | 1052 (94.9) | 1445 (96.1) | 0.140 |
| dMMR | 56 (5.1) | 58 (3.9) | |
| HER-2 (%) | |||
| −/1+ | 1022 (92.2) | 1393 (92.7) | 0.671 |
| 2+/3+ | 86 (7.8) | 110 (7.3) | |
| Ki-67 (%) | |||
| <75% | 886 (80.0) | 938 (62.4) | <0.001 |
| ≥75% | 222 (20.0) | 565 (37.6) | |
| Pre-CEA (ng/mL) (%) | |||
| <4.90 | 973 (87.8) | 1360 (90.5) | 0.029 |
| ≥4.90 | 135 (12.2) | 143 (9.5) | |
| Pre-CA199 (U/mL) | 10.4±39.5 | 12.4±17.4 | <0.001 |
| CT检查(%) | |||
| 阴性 | 869 (78.4) | 1212 (80.6) | 0.165 |
| 阳性 | 239 (21.6) | 291 (19.4) | |
| LNM (%) | |||
| 阴性 | 993 (89.6) | 1335 (88.8) | 0.516 |
| 阳性 | 115 (10.4) | 168 (11.2) | |
| 清扫的LN数目 | 16.8±9.7 | 14.4±7.3 | <0.001 |
BGA表示背景腺瘤; BMI, 体质指数; CRC, 结直肠癌; dMMR, 错配修复功能缺陷; LN, 淋巴结; LNM, 淋巴结转移; LVI, 脉管侵犯; MMR, 错配修复; Muc, 黏液癌; PDC, 低分化细胞簇; PMCF, 瘤周恶性细胞灶; pMMR, 错配修复功能完整; PNI, 神经侵犯; Pre-CA199, 术前CA199; Pre-CEA, 术前癌胚抗原; Sig, 印戒细胞癌; TB, 肿瘤出芽.
高级别PMCF是LNM的独立危险因素,具有更优的风险分层能力
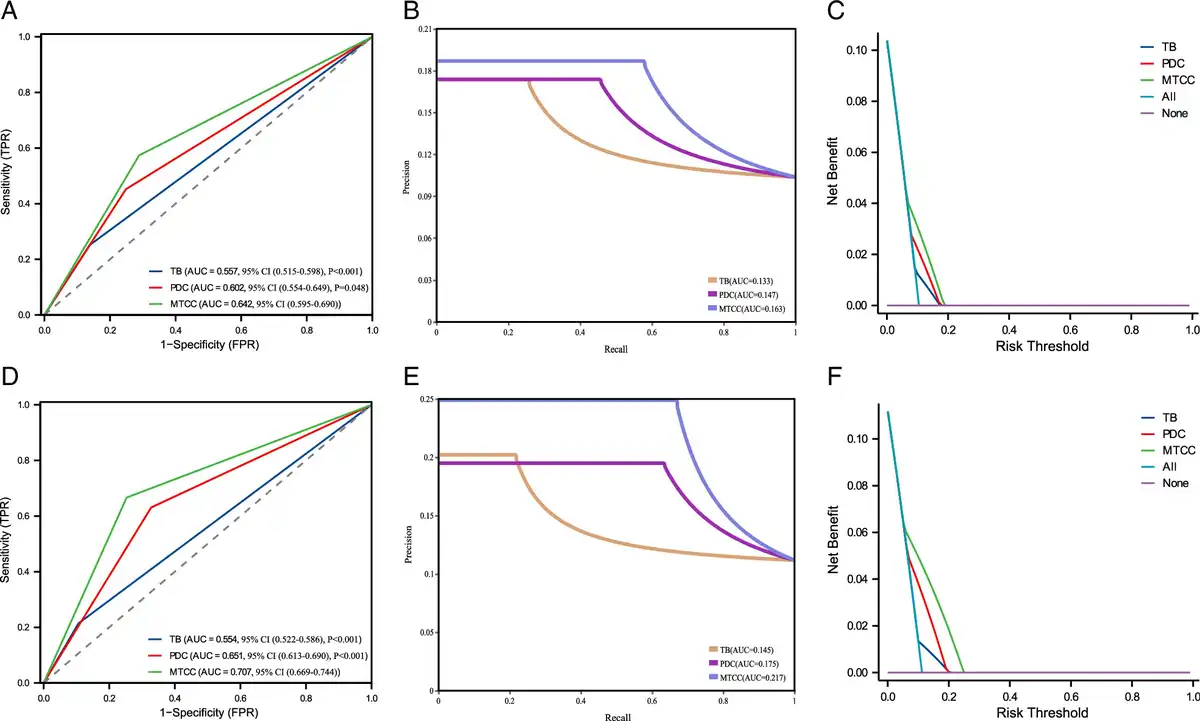
我们系统比较了TB、PDC和PMCF对pT1 CRC中LNM的风险分层预测效能。值得注意的是,2/3级TB在训练队列和验证队列中均不是独立高危因素(P>0.05,表2)。虽然PDC阳性在验证队列中被确定为独立危险因素(P<0.05),但在训练队列中并非如此(P>0.05,表2)。相比之下,高级别PMCF在两个队列中均被确定为独立危险因素(P<0.05,表2,补充表S2,补充数字内容4,补充数字内容1,https://links.lww.com/PAS/C439)。此外,如图3所示,PMCF在训练队列和验证队列中均表现出最强的LNM风险分层能力(P<0.05)。
| 单变量分析 | 多变量分析 | ||||
|---|---|---|---|---|---|
| 特征 | OR (95% CI) | P | OR (95% CI) | P | |
| 训练队列 | TB* | ||||
| 1级 | 参照 | 参照 | |||
| 2/3级 | 2.089 (1.322-3.302) | 0.002 | 0.824 (0.426-1.595) | 0.566 | |
| PDC* | |||||
| 阴性 | 参照 | 参照 | |||
| 阳性 | 2.493 (1.680-3.698) | <0.001 | 1.525 (0.886-2.625) | 0.128 | |
| PMCF† | |||||
| 低级别 | 参照 | 参照 | |||
| 高级别 | 3.313 (2.234-4.915) | <0.001 | 2.089 (1.275-3.421) | 0.003 | |
| 验证队列 | TB* | ||||
| 1级 | 参照 | 参照 | |||
| 2/3级 | 2.291 (1.524-3.444) | <0.001 | 0.684 (0.370-1.263) | 0.225 | |
| PDC* | |||||
| 阴性 | 参照 | 参照 | |||
| 阳性 | 3.501 (2.508-4.888) | <0.001 | 2.197 (1.372-3.518) | 0.001 | |
| PMCF† | |||||
| 低级别 | 参照 | 参照 | |||
| 高级别 | 5.899 (4.184-8.319) | <0.001 | 3.316 (2.103-5.229) | <0.001 | |
*连续变量包括 年龄, pre-CA199, BMI, 肿瘤大小,分类变量包括 性别(男性/女性), 肿瘤部位(右半结肠/左半结肠和直肠), LVI (阴性/阳性), PNI (阴性/阳性), TG (高分化和中分化/低分化和黏液癌及印戒细胞癌), 浸润深度 (<1000 µm/≥1000 µm), 形态(非凹陷型/凹陷型), 肿瘤出芽 (1级/2级和3级), PDC (阴性/阳性), MM (1级/2级), BGA (存在/缺如), CRC家族史(有/无), MMR (dMMR/pMMR), HER-2 (-和1+/2+和3+), Ki-67 (<75%/≥75%), Pre-CEA (<4.90/≥4.90), CT检查 (阴性/阳性),均在多变量逻辑回归中进行校正。
†连续变量包括 年龄, pre-CA199, BMI, 肿瘤大小,分类变量包括 性别(男性/女性), 肿瘤部位(右半结肠/左半结肠和直肠), LVI (阴性/阳性), PNI (阴性/阳性), TG (高分化和中分化/低分化和黏液癌及印戒细胞癌), 浸润深度 (<1000 µm/≥1000 µm), 形态(非凹陷型/凹陷型), PMCF (低级别/高级别), MM (1级/2级), BGA (存在/缺如), CRC家族史(有/无), MMR (dMMR/pMMR), HER-2 (-和1+/2+和3+), Ki-67 (<75%/≥75%), Pre-CEA (<4.90/≥4.90), CT检查 (阴性/阳性),均在多变量逻辑回归中进行校正。
BGA表示背景腺瘤; BMI, 体质指数; CEA, 癌胚抗原; CRC, 结直肠癌; dMMR, 错配修复功能缺陷; LNM, 淋巴结转移; LVI, 脉管侵犯; MMR, 错配修复; Muc, 黏液癌; PDC, 低分化细胞簇; PMCF, 瘤周恶性细胞灶; pMMR, 错配修复功能完整; PNI, 神经侵犯; Sig, 印戒细胞癌; TB, 肿瘤出芽.
高级别PMCF在各亚组中均是LNM的稳健预测因子
为进一步比较TB、PDC和PMCF在按年龄、性别、肿瘤部位和BMI分层的各亚组中对LNM的预测效能,进行了亚组分析及交互作用检验。高级别PMCF在所有亚组中均被确定为LNM的独立危险因素(P<0.05,表3)。此外,与左半结肠及直肠肿瘤相比,高级别PMCF在右半结肠肿瘤中与显著更高的LNM风险相关(P交互作用<0.05,表3)。相比之下,2/3级TB在任何亚组分析中均未表现出与LNM的独立关联(P>0.05,表3)。亚组分析显示,PDC阳性在以下亚组中是LNM的独立危险因素:LOCRC、右侧CRC、左侧CRC、男性患者、正常体重患者及超重患者(P<0.05,表3)。亚组分析的详细信息列于补充表S3-S6(补充数字内容5-8,补充数字内容1,https://links.lww.com/PAS/C439).
| 亚组 | TB*(以1级为参照) | PDC*(以阴性为参照) | PMCF†(以低级别为参照) |
|---|---|---|---|
| EOCRC (n=424) | |||
| OR (95% CI) | 1.190 (0.366-3.869) | 1.988 (0.801-4.936) | 4.044 (1.619-10.098) |
| P | 0.773 | 0.138 | 0.002 |
| LOCRC (n=2187) | |||
| OR (95% CI) | 0.694 (0.429-1.125) | 1.767 (1.213-2.572) | 2.404 (1.685-3.428) |
| P | 0.138 | 0.003 | <0.001 |
| 交互作用P | 0.465 | 0.582 | 0.408 |
| 男性(n=1448) | |||
| OR (95% CI) | 0.774 (0.417-1.438) | 2.195 (1.351-3.565) | 3.012 (1.901-4.774) |
| P | 0.418 | 0.001 | <0.001 |
| 女性(n=1163) | |||
| OR (95% CI) | 0.623 (0.318-1.222) | 1.413 (0.844-2.364) | 2.100 (1.294-3.407) |
| P | 0.169 | 0.188 | 0.002 |
| 交互作用P | 0.556 | 0.200 | 0.332 |
| 右半结肠(n=421) | |||
| OR (95% CI) | 1.129 (0.297-4.289) | 3.138 (1.044-9.433) | 8.979 (2.949-27.337) |
| P | 0.858 | 0.042 | <0.001 |
| 左半结肠和直肠(n=2190) | |||
| OR (95% CI) | 0.693 (0.431-1.113) | 1.713 (1.186-2.473) | 2.197 (1.554-3.106) |
| P | 0.129 | 0.004 | <0.001 |
| 交互作用P | 0.376 | 0.296 | 0.021 |
| 非超重(n=1564) | |||
| OR (95% CI) | 0.716 (0.405-1.269) | 1.589 (1.019-2.478) | 2.500 (1.650-3.785) |
| P | 0.253 | 0.041 | <0.001 |
| 超重(n=1047) | |||
| OR (95% CI) | 0.717 (0.345-1.491) | 2.239 (1.269-3.948) | 2.656 (1.541-4.578) |
| P | 0.373 | 0.005 | <0.001 |
| 交互作用P | 0.459 | 0.230 | 0.782 |
*OR和P值由多变量逻辑回归得出。连续变量包括 年龄, pre-CA199, BMI, 肿瘤大小,分类变量包括 性别(男性/女性), 肿瘤部位(右半结肠/左半结肠和直肠), LVI (阴性/阳性), PNI (阴性/阳性), TG (高分化和中分化/低分化和黏液癌及印戒细胞癌), 浸润深度 (<1000 µm/≥1000 µm), 形态(非凹陷型/凹陷型), 肿瘤出芽 (1级/2级和3级), PDC (阴性/阳性), MM (1级/2级), BGA (存在/缺如), CRC家族史(有/无), MMR (dMMR/pMMR), HER-2 (-&1+/2+&3+), Ki-67 (<75%/≥75%), pre-CEA (<4.90/≥4.90), CT检查 (阴性/阳性),均在多变量逻辑回归中进行校正。 交互作用P通过交互作用检验计算。
†OR和P值由多变量逻辑回归得出。连续变量包括 年龄, pre-CA199, 肿瘤大小, BMI,分类变量包括 性别(男性/女性), 肿瘤部位(右半结肠/左半结肠和直肠), LVI (阴性/阳性), PNI (阴性/阳性), TG (高分化和中分化/低分化和黏液癌及印戒细胞癌), 浸润深度 (<1000 µm/≥1000 µm), 形态(非凹陷型/凹陷型), PMCF (低级别/高级别), MM (1级/2级), BGA (存在/缺如), CRC家族史(有/无), MMR (dMMR/pMMR), HER-2 (-&1+/2+&3+), Ki-67 (<75%/≥75%), pre-CEA (<4.90/≥4.90), CT检查 (阴性/阳性),均在多变量逻辑回归中进行校正。 交互作用P通过交互作用检验计算。
BGA表示背景腺瘤; BMI, 体质指数; CEA, 癌胚抗原; CRC, 结直肠癌; dMMR, 错配修复功能缺陷; EOCRC, 早发性结直肠癌; LNM, 淋巴结转移; LOCRC, 晚发性结直肠癌; LVI, 脉管侵犯; MMR, 错配修复; Muc, 黏液癌; PDC, 低分化细胞簇; PMCF, 瘤周恶性细胞灶; pMMR, 错配修复功能完整; PNI, 神经侵犯; Sig, 印戒细胞癌; TB, 肿瘤出芽.
高级别PMCF与更多的转移淋巴结数目相关
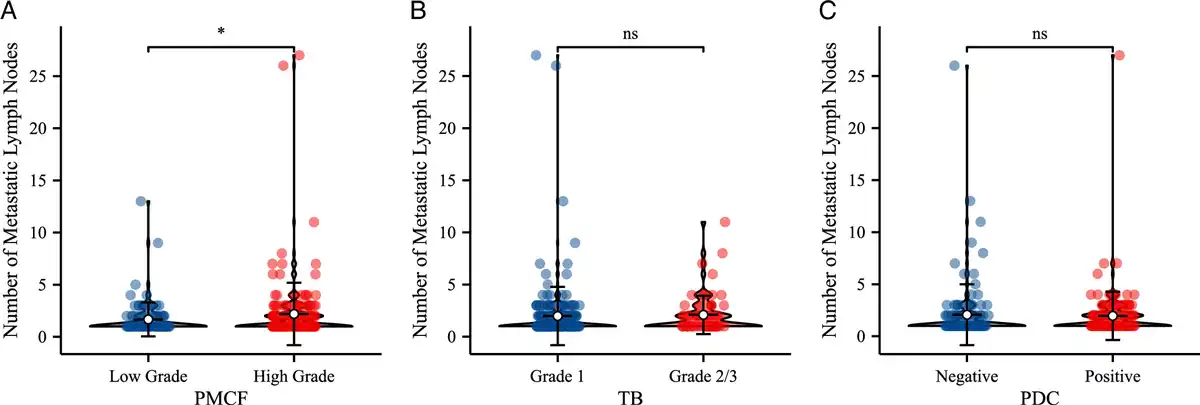
排除42例仅接受ER的患者后,其余总队列中有274例LNM阳性患者。我们发现,高级别PMCF与显著更多的转移淋巴结数目相关(P<0.05,图4A)。然而,2/3级TB和PDC阳性均与转移淋巴结数目无关(P>0.05,图4B-C)。此外,作为训练队列和验证队列中共同的独立危险因素(补充表S2,补充数字内容4,补充数字内容1,https://links.lww.com/PAS/C439),BGA缺如、CT检查阳性、HER-2为2+/3+、Ki-67 ≥75%及LVI阳性也与更多的转移淋巴结数目相关(P<0.05,补充图S2,补充数字内容9,补充数字内容1,https://links.lww.com/PAS/C439)。在这274例LNM阳性患者中,上述各组织学参数所分组别之间的检出淋巴结数目相当(P>0.05,补充图S3,补充数字内容10,补充数字内容1,https://links.lww.com/PAS/C439).
高级别PMCF是D3 LNM的独立危险因素
为研究PMCF对D3 LNM的预测效能,我们从总队列中排除了仅接受ER的患者以及未明确淋巴结站的LNM阳性病例。随后对剩余2485例患者进行多项LR及异质性检验。如表4所示,高级别PMCF是D3 LNM的独立危险因素(P<0.05)。此外,其与D3 LNM的关联远强于与D1和D2 LNM的关联(P异质性<0.05)。同样,高级别PMCF被确定为跳跃性转移的独立危险因素(P<0.05,表5)。此外,PDC阳性被确定为D1和D2 LNM以及非跳跃性转移的独立危险因素(P<0.05,表4和表5)。然而,TB和PDC均不是D3及跳跃性转移的独立危险因素(P>0.05,表4和表5)。
| D1和D2 LNM(7.04%) | D3 LNM (0.60%) | |||
|---|---|---|---|---|
| 特征 | OR (95% CI) | P | OR (95% CI) | P |
| TB† | ||||
| 1级 | 参照 | 参照 | ||
| 2/3级 | 0.862 (0.512-1.450) | 0.575 | 0.150 (0.017-1.350) | 0.091 |
| 异质性P | 0.197 | |||
| PDC† | ||||
| 阴性 | 参照 | 参照 | ||
| 阳性 | 1.613 (1.065-2.444) | 0.024 | 1.994 (0.421-9.447) | 0.385 |
| 异质性P | 0.932 | |||
| PMCF‡ | ||||
| 低级别 | 参照 | 参照 | ||
| 高级别 | 2.615 (1.768-3.867) | <0.001 | 17.796 (4.004-79.087) | <0.001 |
| 异质性P | 0.027 | |||
*从总队列中排除了仅接受ER的pT1 CRC患者以及未明确淋巴结站的LNM阳性病例。
†OR和P值由多变量逻辑回归得出。连续变量包括 年龄, pre-CA199, BMI, 肿瘤大小,分类变量包括 性别(男性/女性), 肿瘤部位(右半结肠/左半结肠和直肠), LVI (阴性/阳性), PNI (阴性/阳性), TG (高分化和中分化/低分化和黏液癌及印戒细胞癌), 浸润深度 (<1000 µm/≥1000 µm), 形态(非凹陷型/凹陷型), 肿瘤出芽 (1级/2级和3级), PDC (阴性/阳性), MM (1级/2级), BGA (存在/缺如), CRC家族史(有/无), MMR (dMMR/pMMR), HER-2 (-&1+/2+&3+), Ki-67 (<75%/≥75%), Pre-CEA (<4.90/≥4.90), CT检查 (阴性/阳性),均在多变量逻辑回归中进行校正。 异质性P通过自由度为1的似然比检验计算。
‡OR和P值由多变量逻辑回归得出。连续变量包括 年龄, pre-CA199, 肿瘤大小, BMI,分类变量包括 性别(男性/女性), 肿瘤部位(右半结肠/左半结肠和直肠), LVI (阴性/阳性), PNI (阴性/阳性), TG (高分化和中分化/低分化和黏液癌及印戒细胞癌), 浸润深度 (<1000 µm/≥1000 µm), 形态(非凹陷型/凹陷型), PMCF (低级别/高级别), MM (1级/2级), BGA (存在/缺如), CRC家族史(有/无), MMR (dMMR/pMMR), HER-2 (-&1+/2+&3+), Ki-67 (<75%/≥75%), pre-CEA (<4.90/≥4.90),以及CT检查 (阴性/阳性),均在多变量逻辑回归中进行校正。 异质性P通过自由度为1的似然比检验计算。
BGA表示背景腺瘤; BMI, 体质指数; CEA, 癌胚抗原; CRC, 结直肠癌; D1, 结肠旁/直肠旁淋巴结; D2, 中间淋巴结; D3, 主淋巴结; dMMR, 错配修复功能缺陷; LNM, 淋巴结转移; LVI, 脉管侵犯; MMR, 错配修复; Muc, 黏液癌; PDC, 低分化细胞簇; PMCF, 瘤周恶性细胞灶; pMMR, 错配修复功能完整; PNI, 神经侵犯; Sig, 印戒细胞癌; TB, 肿瘤出芽.
| 非跳跃性转移(5.55%) | 跳跃性转移(2.09%) | |||
|---|---|---|---|---|
| 特征 | OR (95% CI) | P | OR (95% CI) | P |
| TB† | ||||
| 1级 | 参照 | 参照 | ||
| 2/3级 | 0.853 (0.491-1.482) | 0.573 | 0.613 (0.244-1.541) | 0.298 |
| 异质性P | 0.568 | |||
| PDC† | ||||
| 阴性 | 参照 | 参照 | ||
| 阳性 | 1.840 (1.173-2.884) | 0.008 | 1.215 (0.595-2.484) | 0.593 |
| 异质性P | 0.283 | |||
| PMCF‡ | ||||
| 低级别 | 参照 | 参照 | ||
| 高级别 | 3.099 (2.013-4.771) | <0.001 | 3.733 (2.137-6.522) | <0.001 |
| 异质性P | 0.248 | |||
*从总队列中排除了仅接受ER的pT1 CRC患者以及未明确淋巴结站的LNM阳性病例。
†OR和P值由多变量逻辑回归得出。连续变量包括 年龄, pre-CA199, BMI, 肿瘤大小,分类变量包括 性别(男性/女性), 肿瘤部位(右半结肠/左半结肠和直肠), LVI (阴性/阳性), PNI (阴性/阳性), TG (高分化和中分化/低分化和黏液癌及印戒细胞癌), 浸润深度 (<1000 µm/≥1000 µm), 形态(非凹陷型/凹陷型), 肿瘤出芽 (1级/2级和3级), PDC (阴性/阳性), MM (1级/2级), BGA (存在/缺如), CRC家族史(有/无), MMR (dMMR/pMMR), HER-2 (-&1+/2+&3+), Ki-67 (<75%/≥75%), Pre-CEA (<4.90/≥4.90), CT检查 (阴性/阳性),均在多变量逻辑回归中进行校正。 异质性P通过自由度为1的似然比检验计算。
‡OR和P值由多变量逻辑回归得出。连续变量包括 年龄, pre-CA199, 肿瘤大小, BMI,分类变量包括 性别(男性/女性), 肿瘤部位(右半结肠/左半结肠和直肠), LVI (阴性/阳性), PNI (阴性/阳性), TG (高分化和中分化/低分化和黏液癌及印戒细胞癌), 浸润深度 (<1000 µm/≥1000 µm), 形态(非凹陷型/凹陷型), PMCF (低级别/高级别), MM (1级/2级), BGA (存在/缺如), CRC家族史(有/无), MMR (dMMR/pMMR), HER-2 (-&1+/2+&3+), Ki-67 (<75%/≥75%), Pre-CEA (<4.90/≥4.90), CT检查 (阴性/阳性),均在多变量逻辑回归中进行校正。 异质性P通过自由度为1的似然比检验计算。
BGA表示背景腺瘤; BMI, 体质指数; CEA, 癌胚抗原; CRC, 结直肠癌; dMMR, 错配修复功能缺陷; LNM, 淋巴结转移; LVI, 脉管侵犯; MMR, 错配修复; Muc, 黏液癌; PDC, 低分化细胞簇; PMCF, 瘤周恶性细胞灶; pMMR, 错配修复功能完整; PNI, 神经侵犯; Sig, 印戒细胞癌; TB, 肿瘤出芽.
此外,异质性检验显示,LVI阳性、肿瘤凹陷型形态、BGA缺如和Ki-67 ≥75%与D3 LNM的关联更强(P异质性<0.05,补充表S7,补充数字内容11,补充数字内容1,https://links.lww.com/PAS/C439)。然而,跳跃性转移与非跳跃性转移之间未见统计学显著差异(P异质性>0.05,补充表S8,补充数字内容12,补充数字内容1,https://links.lww.com/PAS/C439).
PMCF与其他组织学参数的关联
如表6所示,高级别PMCF与LVI阳性、PNI阳性、肿瘤分化差、肿瘤较小、黏膜下浸润深度更深、肿瘤凹陷型形态、MM严重或完全缺失、BGA缺如、Ki-67表达升高及pre-CEA表达显著相关(P<0.05)。
| 特征 | 低级别PMCF(n=1808) | 高级别PMCF(n=803) | P |
|---|---|---|---|
| 性别(%) | |||
| 男性 | 1018 (56.3) | 430 (53.5) | |
| 女性 | 790 (43.7) | 373 (46.5) | 0.191 |
| 年龄(岁) | 59.7±11.0 | 59.9±11.0 | 0.547 |
| BMI (kg/m2) | 23.3±3.3 | 23.3±3.0 | 0.386 |
| 肿瘤部位 | |||
| 右半结肠 | 301 (16.6) | 120 (14.9) | |
| 左半结肠和直肠 | 1507 (83.4) | 683 (85.1) | 0.274 |
| LVI | |||
| 阴性 | 1712 (94.7) | 647 (80.6) | |
| 阳性 | 96 (5.3) | 156 (19.4) | <0.001 |
| PNI | |||
| 阴性 | 1788 (98.9) | 772 (96.1) | |
| 阳性 | 20 (1.1) | 31 (3.9) | <0.001 |
| 肿瘤分级 | |||
| 高分化/中分化 | 1682 (93.0) | 681 (84.8) | |
| 低分化/Sig/Muc | 126 (7.0) | 122 (15.2) | <0.001 |
| 肿瘤大小(mm) | 24.2±13.1 | 22.6±11.4 | 0.013 |
| 浸润深度(µm) | |||
| <1000 | 545 (30.1) | 144 (17.9) | |
| ≥1000 | 1263 (69.9) | 659 (82.1) | <0.001 |
| 形态 | |||
| 非凹陷型 | 1627 (90.0) | 663 (82.6) | |
| 凹陷型 | 181 (10.0) | 140 (17.4) | <0.001 |
| 黏膜肌层 | |||
| 1级 | 528 (29.2) | 90 (11.2) | |
| 2级 | 1280 (70.8) | 713 (88.8) | <0.001 |
| BGA | |||
| 缺如 | 363 (20.1) | 245 (30.5) | |
| 存在 | 1445 (79.9) | 558 (69.5) | <0.001 |
| CRC家族史 | |||
| 无 | 1752 (96.9) | 787 (98.0) | |
| 有 | 56 (3.1) | 16 (2.0) | 0.112 |
| MMR | |||
| pMMR | 1721 (95.2) | 776 (96.6) | |
| dMMR | 87 (4.8) | 27 (3.4) | 0.094 |
| HER-2 | |||
| −/1+ | 1684 (93.4) | 731 (91.0) | |
| 2+/3+ | 124 (6.6) | 72 (9.0) | 0.059 |
| Ki-67 (%) | |||
| <75% | 1312 (72.6) | 512 (63.8) | |
| ≥75% | 496 (27.4) | 291 (36.2) | <0.001 |
| Pre-CEA (ng/mL) | |||
| <4.90 | 1636 (90.5) | 697 (86.8) | |
| ≥4.90 | 172 (9.5) | 106 (13.2) | 0.005 |
| Pre-CA199 (U/mL) | 11.3±32.5 | 12.0±18.6 | 0.535 |
BGA表示背景腺瘤; BMI, 体质指数; CRC, 结直肠癌; dMMR, 错配修复功能缺陷; LVI, 脉管侵犯; MMR, 错配修复; Muc, 黏液癌; PMCF, 瘤周恶性细胞灶; pMMR, 错配修复功能完整; PNI, 神经侵犯; Pre-CA199, 术前CA199; Pre-CEA, 术前癌胚抗原; Sig, 印戒细胞癌.
建立基于PMCF的LNM预测模型
采用LR算法构建了基于PMCF的LNM预测模型。如图5所示,该模型在训练队列和验证队列中的预测效能均显著优于现行临床指南(P<0.05)。因此,基于PMCF的LNM预测模型有望用于指导追加RS。此外,为便于该模型的临床应用,我们构建了一个网页计算器(图6,补充数字内容13,补充数字内容1,https://links.lww.com/PAS/C439).
观察者间一致性
PMCF具有较高的观察者间一致性(Cohen Kappa=0.700,P<0.05),与PDC的Kappa值0.719相近,且远高于TB(Cohen Kappa=0.563,表7)。
| 特征 | PMCF(低级别与高级别) | PDC(阴性与阳性) | TB(1级与2/3级) |
|---|---|---|---|
| Kappa系数 | 0.700 | 0.719 | 0.563 |
| P | < 0.001 | < 0.001 | < 0.001 |
PDC表示低分化细胞簇; PMCF, 瘤周恶性细胞灶; TB, 肿瘤出芽.
讨论
本研究发现,在pT1 CRC中,PMCF较TB或PDC均具有更好的LNM风险分层能力。在按年龄、性别、肿瘤部位及BMI分层的亚组分析中,PMCF与LNM的关联仍具有统计学意义。此外,高级别PMCF与显著更多的转移淋巴结数目相关。进一步而言,作为D3 LNM的一项新兴危险因素,高级别PMCF与D3 LNM的关联显著强于与D1和D2 LNM的关联。
现行指南建议,发现2/3级TB时应追加RS。2–4然而,在我们的结果中,校正PDC后,TB不再是独立危险因素。这一发现与既往研究一致,5,6这些研究同样表明,校正PDC后,TB不再是独立预测因子。尽管PDC尚未被纳入任何临床指南,新近证据提示其具有作为预测标志物的潜力。6,7值得注意的是,在我们的结果中,校正TB后,PDC并非稳健的独立危险因素。我们推测,TB和PDC对pT1 CRC中LNM的预测效能受到二者相互作用的显著影响。研究者发现,TB和PDC在分子特征及临床用途方面存在大量重叠。与背景肿瘤相比,TB和PDC均表现出核β-连环蛋白表达升高及E-钙黏蛋白表达降低。10高级别TB和PDC中KRAS突变均更常见。36TB和PDC参与动态的上皮-间质转化(EMT)。37,38一项近期研究发现,MYC下调和RUNX2上调有助于获得伴有TB和PDC的浸润性表型。39此外,联合TB和PDC可在CRC中提供更优的预后分层。40根据我们的发现及既往研究,TB和PDC很可能作为一个病理实体,代表具有共同生物学特征的连续浸润谱。无论浸润前沿每个肿瘤细胞簇内的细胞数量如何,更多的细胞簇均与更具侵袭性的LNM进展相关。因此,单独评估TB或PDC可能无法全面反映pT1 CRC LNM的生物学连续性。这引出了几个关键问题:5个肿瘤细胞的阈值是否为合理界值?能否将TB和PDC视为一个整合的病理实体?多项研究探讨了联合TB和PDC预测pT1 CRC中LNM。Backes等5提出,存在2/3级TB或2/3级PDC(1级:0-4个PDC;2级:5-9个PDC;3级:≥10个PDC)均可有效预测LNM。Martínez等41表明,联合TB2/3和高级别PDC(PDC阳性,与本研究采用的定义一致)可使pT1 CRC中不必要的手术减少41.5%至45%。然而,在这些研究中,按照标准分级标准,TB和PDC仍被视为不同的病理实体。从本质上看,这些研究未能用单一病理参数涵盖肿瘤浸润前沿的完整形态谱。为解决这些局限,我们在此首次将PMCF定义为肿瘤浸润前沿由≥1个肿瘤细胞组成的非腺样恶性细胞灶。作为统一的生物标志物,高级别PMCF被发现是具有更优预测效能的独立危险因素。此外,PMCF作为整体性生物标志物还具有数项实践优势:有效消除了4细胞簇与5细胞簇之间困难且带有一定人为性的区分;提供比TB或PDC更强的LNM风险分层能力,并具有较高的可重复性;涵盖肿瘤浸润前沿的完整形态谱,且很可能代表其生物学连续性。然而,应考虑以下几个实践问题:1. 对于难以与巨噬细胞、成纤维细胞、炎细胞或坏死区等间质成分区分的小恶性细胞灶,应加以辨别,以避免高估PMCF。2. 大黏液池内的恶性细胞灶不应归为PMCF。3. 存在大量PMCF时,应仔细鉴别低分化腺癌或微乳头状腺癌。
LNM危险因素与转移淋巴结数目之间的关联尚未得到探索。在本研究中,高级别PMCF、BGA缺如、CT检查阳性、HER-2为2+/3+、Ki-67 ≥75%及LVI阳性与更多的转移淋巴结数目表现出更强关联。因此,具有这些危险因素的患者可能不仅需要在ER后追加RS,还需要更广泛的淋巴结清扫,以降低肿瘤残留风险。
迄今为止,仅JSCCR就pT1 CRC的淋巴结清扫范围提出了建议。2对于临床LNM阴性(cN(−))患者,建议进行D2淋巴结清扫;对于cN(+)患者,则建议进行D3清扫。然而,对于诊断为cN(+)的pT1 CRC患者,是否确实需要D3清扫仍不清楚。此外,哪些患者可从D3清扫中获益尚未明确界定。我们认为,尽管pT1 CRC中D3 LNM发生率极低,常规D3清扫并不适用于所有LNM阳性病例。鉴于适当的淋巴结清扫范围可显著降低围手术期并发症风险,42,43探索D3 LNM的危险因素具有重要意义。我们的结果显示,高级别PMCF、LVI阳性、肿瘤凹陷型形态、Ki-67 ≥75%和BGA缺如与D3 LNM风险升高显著相关。这些发现提示,对于具有上述危险因素的患者,应密切警惕潜在的D3 LNM。在术前影像学评估和术中检查中均应更严格地评估D3 LNM,以便确定淋巴结清扫范围。
本研究存在若干需要承认的局限性。首先,本研究从单中心前瞻性纳入的患者数量相对有限。因此,需要更大的多中心前瞻性队列验证PMCF的病理及临床价值。其次,D3转移的事件数可能不足以构建稳定的多变量模型来识别D3 LNM的高危因素。因此,必须谨慎解读这些发现。未来研究有必要扩大D3 LNM患者的样本量。第三,本研究仅纳入中国队列。因此,未来有必要在国际队列中验证PMCF的实用性。
总之,高级别PMCF不仅提示pT1 CRC患者在ER后需要追加RS,还可能提示需要D3淋巴结清扫。作为更好的LNM病理预测因子,PMCF为优化pT1 CRC的外科决策提供了循证依据。
致谢
作者感谢所有参与中心病理科工作人员提供病理切片。
- TB (<5 cells) and PDC (≥5 cells) are separated by an arbitrary 5-cell cutoff; the authors define peritumoral malignant cellular foci (PMCF) as nonglandular foci of ≥1 tumor cell at the invasive front, counted in the hotspot under a ×20 objective (0.785 mm²), with ≥3 as high grade.
- 2611 endoscopically or surgically resected pT1 CRCs from 6 Chinese centres (training 1108, validation 1503): on multivariate analysis TB was not independent in either cohort and PDC only in validation, whereas high-grade PMCF was an independent LNM risk factor in both (multivariate OR 2.089 and 3.316).
- High-grade PMCF was associated with more metastatic nodes and more strongly with D3 (and skip) metastasis than D1/D2; interobserver kappa 0.700 (PDC 0.719, TB 0.563).
- A PMCF-based model outperformed JSCCR, ESMO and NCCN guidelines in both cohorts, with a web calculator. Six figures and seven tables.
Scope: open-access full text (CC BY-NC-ND 4.0, Ovid/LWW) — abstract, introduction, materials and methods, results, discussion and acknowledgments, with 6 figures and 7 tables (including footnotes); references and supplemental digital content are not included. Superscript numbers are the original reference numbers.
Abstract
As biomarkers separated by the arbitrary 5-tumor-cell cutoff at the tumor invasive front, tumor budding (TB) and poorly differentiated clusters (PDC) are recognized as high-risk factors for lymph node metastasis (LNM) in pT1 colorectal cancer (CRC). Nonetheless, relevant findings remain inconsistent. Furthermore, the association between the tumor invasive front biomarker and D3 LNM in pT1 CRC remains unknown. To identify a biomarker that captures the full morphologic spectrum and eliminates the need for such cutoffs at the tumor invasive front for predicting LNM, particularly D3 LNM, in pT1 CRC, we defined peritumoral malignant cellular foci (PMCF) as nonglandular foci composed of ≥1 tumor cell at the tumor invasive front. After enrolling 2611 endoscopically or surgically resected pT1 CRC patients from 6 high-volume Chinese institutions, we found that neither TB nor PDC exhibited a consistent independent association with LNM across the training and validation cohorts. In contrast, PMCF emerged as an independent risk factor with superior risk stratification of LNM in both cohorts (P<0.05). The association between PMCF and LNM remained significant in subgroup analyses stratified by age, sex, tumor location, and BMI (P<0.05). Moreover, PMCF correlated with a greater number of metastatic lymph nodes and exhibited a stronger association with D3 LNM than with D1 and D2 LNM (P<0.05). In conclusion, PMCF not only suggests additional radical surgery after endoscopic resection in pT1 CRC, but may also indicate D3 lymph node dissection. PMCF provides an evidence-based rationale to optimize surgical decision-making in pT1 CRC.
Introduction
Tumor budding (TB) and poorly differentiated cluster (PDC) are typical biomarkers at the tumor invasive front. Since lymph node metastasis (LNM) occurs in only 10% to 15% of patients with pT1 colorectal cancer (CRC),1 current guidelines recognize high-grade TB as a risk factor for LNM and recommend additional radical surgery (RS) after endoscopic resection (ER) to achieve risk stratification of LNM in pT1 CRC.2–4 However, emerging evidence suggested that TB lost its association with LNM after adjustment for PDC.5,6 Although PDC showed potential for predicting LNM in pT1 CRC,6,7 the 5-tumor-cell cutoff that artificially separates PDC and TB fails to reflect the continuous morphologic spectrum as well as the biological continuum of the tumor invasive front and impedes their clinical application.8,9 Due to their extensive overlapping molecular characteristics10,11 combined assessment of TB and PDC in CRC would yield better prognostic performance than either alone.12,13 Haddad et al8 reported that a threshold of ≤5 cells for defining tumor-cluster size yielded the optimal stratification for disease-free survival in stage I to III CRC patients.8 Comprehensive evaluation of the morphologic features at the tumor invasive front is therefore essential. However, studies on a biomarker that captures the full morphologic spectrum of the tumor invasive front for predicting LNM and guiding additional RS in pT1 CRC still remain limited.
Numerous studies have demonstrated that the main LNM (D3 LNM) is an indicator of poor prognosis in CRC.14,15 Accurate identification of D3 LNM is therefore significant for determining the extent of lymph node dissection in pT1 CRC patients. However, risk factors for D3 LNM in pT1 CRC remain largely unknown, particularly the association between the tumor invasive front biomarker and D3 LNM. Although the incidence of D3 LNM in pT1 CRC is 0.3%,2 D3 lymph node dissections might not be indicated for a proportion of patients. Consequently, these critical knowledge gaps have left surgeons without sufficient evidence to determine the necessity of D3 lymph node dissection and identify pT1 CRC patients most likely to benefit from D3 dissection. Thus, refining the evidence-based rationale for surgical decision-making in pT1 CRC is critically imperative.
To address these clinical dilemmas and knowledge gaps, we proposed and defined the peritumoral malignant cellular foci (PMCF) as nonglandular foci composed of ≥1 tumor cell at the tumor invasive front. We therefore aimed to evaluate the predictive performance of PMCF for LNM in pT1 CRC and explore its association with D3 LNM.
Materials and Methods
Study Cohort
Clinical data of pT1 CRC patients were collected from 6 high-volume Chinese institutions. Patients who underwent ER alone, initial or additional RS after ER with pathologically confirmed pT1 CRC were included. For patients treated with ER alone and additional RS after ER, endoscopic specimens and surgical specimens were used for pathologic assessment. For patients treated with initial RS, surgical specimens were used for pathologic assessment. According to the Japanese Society for Cancer of the Colon and Rectum (JSCCR) guidelines,2 patients who had one or more risk factors outlined below were recommended for additional RS with lymph nodes dissection after ER: (1) positive lymphovascular invasion (LVI); (2) poorly differentiated adenocarcinoma, signet ring cell carcinoma or mucinous carcinoma; (3) TB grade of BD 2/3; (4) depth of submucosal invasion ≥1000 µm; and (5) positive vertical margin. Due to physical condition and personal preference, some of the patients refused additional RS. Patients who had (1) synchronous or metachronous CRC, (2) inflammatory bowel disease, (3) familial adenomatous polyposis or Peutz–Jeghers syndrome, (4) malignancy from other organs, (5) neoadjuvant chemotherapy or radiotherapy, (6) distant metastasis at diagnosis, (7) <5 years follow-up after ER alone, and (8) missing clinical data were excluded. A total of 2611 patients were enrolled. One thousand one hundred eight pT1 CRC patients enrolled from the Sixth Affiliated Hospital of Sun Yat-sen University (February 2010 to May 2025) served as the training cohort. A total of 1503 patients were enrolled as the validation cohort, including 473 patients from Sun Yat-sen University Cancer Center (April 2015 to August 2024), 111 from Shaoguan Yuebei People’s Hospital (January 2014 to November 2024), 270 from the Third Bethune Hospital of Jilin University (July 2017 to May 2025), 263 from the Second Affiliated Hospital of Harbin Medical University (April 2018 to May 2025), and 208 from Shenzhen People’s Hospital (January 2014 to November 2024). In addition, 178 patients prospectively enrolled from the Sixth Affiliated Hospital of Sun Yat-sen University (June 2025 to January 2026) with the same criteria were recruited in the validation cohort. This purely observational study was conducted in accordance with the Declaration of Helsinki and approved by the Institutional Ethics Committee of the Sixth Affiliated Hospital of Sun Yat-sen University (No. 2025ZSLYEC-299) as well as other participating centers. Written informed consent was signed by each participant at their hospital admission.
Sample Size Calculation
The sample size was estimated before the study based on the method of events per variable (EPV).16 Based on the classic and widely adopted EPV of 10,17 with an assumed LNM-positive rate of 10% to 15%1 and 22 candidate variables, the required range of the sample size was calculated as follows:
The Range of Sample Size
=
EPV
×
Number of Variables
Incidence Rate
=
10
×
22
0.10
~
0.15
=
1
,
467
~
2200
The total cohort of 2611 patients substantially exceeded this range, ensuring an adequate sample size for analysis.
Histologic Assessment and Clinical Data Collection
All hematoxylin and eosin (H&E)–stained and immunohistochemistry (IHC) stained tumor slides were retrieved from institutional pathology archives. All histologic parameters were assessed using longitudinal sections of the whole tumor, including its deepest invasive part. For rigorous pathologic assessment, all the tumor slides (n=2611, 13,881 slides) were independently reviewed by 2 experienced gastrointestinal pathologists (X.L. and Q.Z.) who were blinded to clinical outcomes. In cases of discordance on initial review, a consensus was reached via review by a third pathologist (C.W.) and joint discussion.
TB and PDCs
TB was defined as an isolated single tumor cell or a cluster comprised of <5 tumor cells without glandular structures at the tumor invasive front.18 Briefly, the invasive front of all tumor slides was scanned at low-power magnification to identify the area with the greatest density of TBs. After the identification of the hotspot area, the number of buds was counted under a ×20 objective lens (0.785 mm2). In accordance with the International Tumor Budding Consensus Conference (ITBCC) recommendations, the TB was graded as grade 1 (0 to 4 buds), grade 2 (5 to 9 buds), or grade 3 (≥10 buds).19 According to the JSCCR guidelines,2 grade 1 was classified as low grade (Fig. 1A) and grades 2 and 3 were classified as high grade (Fig. 1B).
PDC was defined as clusters of ≥5 tumor cells with no evidence of glandular differentiation at the tumor invasive front.20 Similarly, the invasive front of all the tumor slides was carefully scanned to identify the area with the greatest density of PDC. After localizing the hotspot area, PDC was counted and classified into negative (Fig. 1C) or positive (Fig. 1D) based on its presence under a ×20 objective lens (0.785 mm2).7
Peritumoral Malignant Cellular Foci
We defined PMCF as nonglandular foci composed of ≥1 tumor cell at the tumor invasive front. First, tumor invasive margin in all the tumor slides was assessed to identify the area with the greatest density of PMCF. The count of PMCF was performed under a ×20 objective lens within the hotspot area (0.785 mm2). Since PMCF was identified as an independent LNM risk factor in both the training and validation cohorts (Supplementary Table S1, Supplemental Digital Content 1, Supplemental Digital Content 1, https://links.lww.com/PAS/C439), the optimal cutoff was determined by the Youden index in the training cohort at 3 (Supplementary Figure S1, Supplemental Digital Content 2, Supplemental Digital Content 1, https://links.lww.com/PAS/C439). Tumors with <3 PMCF were categorized as low grade (Fig. 1E) and those with ≥3 PMCF as high grade (Fig. 1F). Specifically, any focus defined as a PMCF was also counted as either a TB or a PDC.
Other Clinical Data and Histologic Parameters
Clinical and demographical information, including age, sex, body mass index (BMI), tumor location, tumor size, family history of CRC, preoperative contrast-enhanced CT reports, colonoscopy images, and serum tumor marker reports, were retrieved from the electronic medical record system.
The tumor grade (TG) was classified into well-differentiated, moderately differentiated, poorly differentiated adenocarcinoma, mucinous carcinoma, and signet ring cell carcinoma according to the WHO criteria.21 For tumors containing more than one component, the grade was determined based on the least differentiated component. Ki-67 expression was assessed as the percentage of positively stained tumor cells by IHC staining. Since continuous variables including Ki-67 and preoperative carcinoembryonic antigen (pre-CEA) were also identified as independent LNM risk factors in both the training and validation cohorts (Supplementary Table S1, Supplemental Digital Content 1, https://links.lww.com/PAS/C439), their optimal cutoffs were determined by ROC in the training cohort at 75% and 4.90, respectively (Supplementary Figure S1, Supplemental Digital Content 2, Supplemental Digital Content 1, https://links.lww.com/PAS/C439). LVI was defined as the presence of tumor cells within lymphatic or blood vessels.22 According to the NCCN guidelines3,4 and the US Multi-Society Task Force guidelines,23 when LVI was equivocal on H&E staining, IHC staining of anti-D2-40 antibody and anti-CD34 antibody was performed. Perineural invasion (PNI) was defined as the nerve sheath encircled by tumor cells.24 The depth of submucosal invasion was measured in accordance with the JSCCR guideline.2 In brief, upon the identification or estimation of the muscularis mucosae (MM), invasion depth was measured from its lower border to the deepest invasion. When the MM was unable to be identified or estimated, invasion depth was measured from the tumor surface to the deepest invasive front. For pedunculated lesions with tangled MM, the junction between the tumor head and neck (Haggitt level 2) was utilized as the reference line. Invasion confined to the head was recorded as 0 μm (head invasion), whereas invasion extending beyond (stalk invasion) was measured from the reference line to the deepest invasive front. MM status was evaluated with the assistance of antidesmin antibody and classified as Grade 1 when muscle fibers remained identifiable or Grade 2 when they were severely fragmented or entirely absent.25 Background adenoma (BGA) was defined as an adenomatous component contiguous with the carcinoma.26 IHC staining results of HER-2 were evaluated according to the American Society of Clinical Oncology (ASCO) guidelines.27,28 The expression of mismatch repaired (MMR) proteins (MLH1, PSM2, MSH2, and MSH6) were determined by IHC staining. Specimens with intact staining for all MMR proteins were classified as proficient MMR (pMMR). Tumors lacking intact MMR proteins expression were categorized as deficient MMR (dMMR). The IHC technical specifications for D2-40, CD34, HER2, Ki67, and MMR were listed in Supplemental Digital Content 3, Supplemental Digital Content 1, https://links.lww.com/PAS/C439.
Tumor location was categorized into the right colon (cecum, ascending colon, and transverse colon) and the left colon and rectum (descending colon, sigmoid colon, and rectum). The maximum tumor diameter was measured after formalin fixation. Tumor morphology was assessed according to the Paris endoscopic classification29 and dichotomized into the depressed type (IIc, III, Is+IIc, IIa+IIc, or IIc+IIa) and the nondepressed type (Ip, Isp, Is, IIa, or IIb). The BMI was classified into nonoverweight (BMI <24 kg/m²) and overweight (BMI ≥24 kg/m²). Patients with CRC diagnosed before the age of 50 were classified as early-onset (EOCRC), whereas those aged 50 or older were classified as late-onset (LOCRC).
Assessment of Study Outcomes
For patients who underwent initial or additional RS, LNM was determined via pathologic examination of resected lymph node specimens. For patients treated with ER alone, a follow-up of ≥5 years is needed in accordance with the JSCCR guidelines.2 LNM was evaluated via contrast-enhanced CT scan.30,31 Patients were defined as LNM-negative if the results of contrast-enhanced CT scans were free from regional lymph node (LN) recurrence for 5 years or longer, whereas those with radiologic evidence of regional LN recurrence at any time during follow-up were classified as LNM-positive.
Diagnosis of regional LN recurrence using contrast-enhanced CT was performed in accordance with the following criteria: (1) maximum short-axis diameter >5 mm; (2) abnormal nodal density or enhancement; (3) nodal necrosis or obscure borders; and (4) matted lymph nodes or nodal fusion with adjacent organs or vessels. Lesions presenting any of the above features were defined as positive LN recurrence. All the participating institutions applied the same criteria.
Regional LN stations were classified according to the Japanese Classification of Colorectal Carcinoma.32 Briefly, first-station LN (D1) were defined as pericolic/perirectal nodes, second-station LN (D2) as intermediate nodes, and third-station LN (D3) as main nodes. Skip metastasis was defined as the presence of tumor metastasis in the distant regional lymph node stations without involvement of the proximal stations. Otherwise, it was defined as nonskip metastasis.
Developing an LNM Prediction Model
In the training cohort, bidirectional stepwise regression was performed to screen 20 candidate variables, with TB and PDC excluded from variable selection. Fourteen key predictors—LVI (positive vs. negative), PNI (positive vs. negative), Pre-CEA (ng/mL), BGA (present vs. absent), PMCF (low-grade vs. high-grade), tumor morphology (depressed vs. nondepressed), TG (well-/moderate differentiation vs. poor differentiation/signet ring cell/mucinous carcinoma), HER-2 (−/1+ vs. 2+/3+), Ki-67 (%), family history of CRC (yes vs. no), tumor location (right colon vs. left colon/rectum), MM status (Grade 1 vs. Grade 2), tumor size (mm), and CT examination (positive vs. negative)—were subsequently retained to construct a logistic regression (LR) model.
The risk score was calculated using the following formula: −5.6218+1.75374*LVI +0.14447*Pre-CEA +0.02534*Ki-67-0.85757*BGA +0.80265*PMCF +0.75279*CT Examination+1.11027*HER-2+1.1447*TG+0.81415*Tumor Morphology+0.70308*MM status +1.62325*PNI −1.20887*Family History of CRC+0.59778*Tumor Location-0.01561*Tumor Size. The optimal cutoff value of −2.3583 was determined by the Youden index. The identical formula and cutoff were then applied to the validation cohort. The predictive performance of the model was comprehensively compared with current guidelines using receiver operating characteristic (ROC), precision-recall curves (PR), and decision curve analysis (DCA) in the training and validation cohorts. To facilitate its clinical application, we developed a web calculator.
According to the JSCCR guidelines,2 patients who have one or more risk factors outlined below are defined as high risk of LNM and recommended for additional RS: (1) positive LVI; (2) poorly differentiated adenocarcinoma, signet ring cell carcinoma, or mucinous carcinoma; (3) TB grade of BD 2/3; (4) depth of submucosal invasion ≥1000 µm. The risk factor of high-grade TB is absent from the ESMO guidelines,33,34 while the depth of invasion is not included in the NCCN guidelines.3,4
Interobserver Agreement
We randomly selected the original records of 50 cases that had been independently reviewed previously by the 2 aforementioned pathologists (X.L. and Q.Z.) and performed the interobserver agreement of TB, PDC, and PMCF.
Statistical Analysis
Continuous variables were presented as mean±SD and compared using the t test or the Wilcoxon test depended on their distributions. Categorical variables were presented as frequencies and percentages. Independent risk factors were identified using multivariate LR. To evaluate whether the effects of risk factors differed significantly across subgroups stratified by age, sex, tumor location, and BMI, interaction tests (P interaction) were performed. Likelihood ratio tests with one degree of freedom (P heterogeneity) were conducted to evaluate the heterogeneity of risk factor effects across LNM subgroups in multinomial LR. Briefly, this test compared a model that allows for separate associations of risk factors with LNM according to metastasis subtypes with a model that assumes a common association.35 Predictive performance was assessed using ROC with DeLong tests and PR. DCA was performed to quantify the net benefit across a range of threshold probabilities. Cohen Kappa coefficients were calculated to quantify the interobserver agreement. A 2-tailed P-value <0.05 was considered statistically significant. All statistical analyses were performed with R (Version 4.4.0).
Results
Baseline Clinical Information
One hundred fifteen (10.4%) patients were LNM-positive in the training cohort, whereas 168 (11.2%) were LNM-positive in the validation cohort. Overall, the LNM-positive rate was 10.8%. Demographic and clinical characteristics of all patients were summarized in Table 1. The patients flowchart was illustrated in Figure 2.
| Characteristics | Training cohort (n=1108) | Validation cohort (n=1503) | P |
|---|---|---|---|
| Sex (%) | |||
| Male | 629 (56.8) | 819 (54.5) | 0.247 |
| Female | 479 (43.2) | 684 (45.5) | |
| Age (y) | 58.9±11.8 | 60.5±10.4 | 0.001 |
| BMI (kg/m2) | 23.2±3.1 | 23.4±3.2 | 0.441 |
| Tumor location (%) | |||
| Right colon | 155 (14.0) | 266 (17.7) | 0.011 |
| Left colon and rectum | 953 (86.0) | 1237 (82.3) | |
| LVI (%) | |||
| Negative | 1011 (91.2) | 1348 (89.7) | 0.183 |
| Positive | 97 (8.8) | 155 (10.3) | |
| PNI (%) | |||
| Negative | 1100 (99.3) | 1460 (97.1) | <0.001 |
| Positive | 8 (0.7) | 43 (2.9) | |
| Tumor grade (%) | |||
| Well/moderate | 1034 (93.3) | 1329 (88.4) | <0.001 |
| Poor/Sig/Muc | 74 (6.7) | 174 (11.6) | |
| Tumor size (mm) | 23.2±12.3 | 24.1±12.9 | 0.073 |
| Depth of invasion (µm) (%) | |||
| <1000 | 263 (23.7) | 426 (28.3) | 0.008 |
| ≥1000 | 845 (76.3) | 1077 (71.7) | |
| Morphology (%) | |||
| Undepressed | 955 (86.2) | 1335 (88.8) | 0.043 |
| Depressed | 153 (13.8) | 168 (11.2) | |
| TB (%) | |||
| Grade 1 | 942 (85.0) | 1325 (88.2) | 0.190 |
| Grade 2/3 | 166 (15.0) | 178 (11.8) | |
| PDC (%) | |||
| Negative | 809 (73.0) | 959 (63.8) | <0.001 |
| Positive | 299 (27.0) | 544 (36.2) | |
| PMCF (%) | |||
| Low grade | 755 (68.1) | 1053 (70.1) | 0.294 |
| High grade | 353 (31.9) | 450 (29.9) | |
| Muscularis mucosae (%) | |||
| Grade 1 | 328 (29.6) | 290 (19.3) | <0.001 |
| Grade 2 | 780 (70.4) | 1213 (80.7) | |
| BGA (%) | |||
| Absence | 363 (32.8) | 245 (16.3) | <0.001 |
| Presence | 745 (67.2) | 1258 (83.7) | |
| Family history of CRC (%) | |||
| No | 1071 (96.7) | 1468 (97.7) | 0.119 |
| Yes | 37 (3.3) | 35 (2.3) | |
| MMR (%) | |||
| pMMR | 1052 (94.9) | 1445 (96.1) | 0.140 |
| dMMR | 56 (5.1) | 58 (3.9) | |
| HER-2 (%) | |||
| −/1+ | 1022 (92.2) | 1393 (92.7) | 0.671 |
| 2+/3+ | 86 (7.8) | 110 (7.3) | |
| Ki-67 (%) | |||
| <75% | 886 (80.0) | 938 (62.4) | <0.001 |
| ≥75% | 222 (20.0) | 565 (37.6) | |
| Pre-CEA (ng/mL) (%) | |||
| <4.90 | 973 (87.8) | 1360 (90.5) | 0.029 |
| ≥4.90 | 135 (12.2) | 143 (9.5) | |
| Pre-CA199 (U/mL) | 10.4±39.5 | 12.4±17.4 | <0.001 |
| CT examination (%) | |||
| Negative | 869 (78.4) | 1212 (80.6) | 0.165 |
| Positive | 239 (21.6) | 291 (19.4) | |
| LNM (%) | |||
| Negative | 993 (89.6) | 1335 (88.8) | 0.516 |
| Positive | 115 (10.4) | 168 (11.2) | |
| No. dissected LNs | 16.8±9.7 | 14.4±7.3 | <0.001 |
BGA indicates background adenoma; BMI, body mass index; CRC, colorectal cancer; dMMR, deficient mismatch repair; LN, lymph node; LNM, lymph node metastasis; LVI, lymphovascular invasion; MMR, mismatch repair; Muc, mucinous carcinoma; PDC, poorly differentiated cluster; PMCF, peritumoral malignant cellular foci; pMMR, proficient mismatch repair; PNI, perineural invasion; Pre-CA199, preoperative CA199; Pre-CEA, preoperative carcinoembryonic antigen; Sig, Signet ring cell carcinoma; TB, tumor budding.
High-Grade PMCF was an Independent Risk Factor for LNM With Superior Risk Stratification
We systematically compared the predictive performance of TB, PDC, and PMCF for LNM risk stratification in pT1 CRC. Notably, Grade 2/3 TB was not an independent high-risk factor in either the training or the validation cohort (P>0.05, Table 2). While positive PDC was identified as an independent risk factor in the validation cohort (P<0.05); it failed to do so in the training cohort (P>0.05, Table 2). By contrast, high-grade PMCF was identified as an independent risk factor in both cohorts (P<0.05, Table 2, Supplementary Table S2, Supplemental Digital Content 4, Supplemental Digital Content 1, https://links.lww.com/PAS/C439). In addition, as illustrated in Figure 3, PMCF exhibited the strongest LNM risk stratification in both the training and validation cohorts (P<0.05).
| Univariate analysis | Multivariate analysis | ||||
|---|---|---|---|---|---|
| Characteristics | OR (95% CI) | P | OR (95% CI) | P | |
| Training cohort | TB* | ||||
| Grade 1 | Reference | Reference | |||
| Grade 2/3 | 2.089 (1.322-3.302) | 0.002 | 0.824 (0.426-1.595) | 0.566 | |
| PDC* | |||||
| Negative | Reference | Reference | |||
| Positive | 2.493 (1.680-3.698) | <0.001 | 1.525 (0.886-2.625) | 0.128 | |
| PMCF† | |||||
| Low grade | Reference | Reference | |||
| High grade | 3.313 (2.234-4.915) | <0.001 | 2.089 (1.275-3.421) | 0.003 | |
| Validation cohort | TB* | ||||
| Grade 1 | Reference | Reference | |||
| Grade 2/3 | 2.291 (1.524-3.444) | <0.001 | 0.684 (0.370-1.263) | 0.225 | |
| PDC* | |||||
| Negative | Reference | Reference | |||
| Positive | 3.501 (2.508-4.888) | <0.001 | 2.197 (1.372-3.518) | 0.001 | |
| PMCF† | |||||
| Low grade | Reference | Reference | |||
| High grade | 5.899 (4.184-8.319) | <0.001 | 3.316 (2.103-5.229) | <0.001 | |
* Continuous variables including age, pre-CA199, BMI, tumor size, and categorical variables including sex (male/female), tumor location (right colon/left colon and rectum), LVI (negative/positive), PNI (negative/positive), TG (well and moderate /poor and muc and sig), depth of invasion (<1000 µm/≥1000 µm), morphology (undepressed/depressed), tumor budding (Grade 1/Grade 2 and 3), PDC (negative/positive), MM (Grade 1/Grade 2), BGA (presence/absence), family history of CRC (yes/no), MMR (dMMR/pMMR), HER-2 (- and 1+/2+ and 3+), Ki-67 (<75%/≥75%), Pre-CEA (<4.90/≥4.90), CT examination (negative/positive) were adjusted in multivariate logistic regression.
† Continuous variables including age, pre-CA199, BMI, tumor size and categorical variables including sex (male/female), tumor location (right colon/left colon and rectum), LVI (negative/positive), PNI (negative/positive), TG (well and moderate /poor and muc and sig), depth of invasion (<1000 µm/≥1000 µm), morphology (undepressed/depressed), PMCF (low grade/high grade), MM (Grade 1/Grade 2), BGA (presence/absence), family history of CRC (yes/no), MMR (dMMR/pMMR), HER-2 (- and 1+/2+ and 3+), Ki-67 (<75%/≥75%), Pre-CEA (<4.90/≥4.90), CT examination (negative/positive) were adjusted in multivariate logistic regression.
BGA indicates background adenoma; BMI, body mass index; CEA, carcinoembryonic antigen; CRC, colorectal cancer; dMMR, deficient mismatch repair; LNM, lymph node metastasis; LVI, lymphovascular invasion; MMR, mismatch repair; Muc, mucinous carcinoma; PDC, Poorly differentiated cluster; PMCF, peritumoral malignant cellular foci; pMMR, proficient mismatch repair; PNI, perineural invasion; Sig, Signet ring cell carcinoma; TB, tumor budding.
High-Grade PMCF was a Robust Predictor of LNM in Various Subgroups
To further compare the LNM predictive performance of TB, PDC, and PMCF across subgroups stratified by age, sex, tumor location, and BMI, subgroup analysis with an interaction test was conducted. High-grade PMCF was identified as an independent risk factor for LNM across all subgroups (P<0.05, Table 3). Moreover, high-grade PMCF was associated with a significantly higher LNM risk in right colon tumors compared with left colon and rectal tumors (P interaction <0.05, Table 3). In contrast, Grade 2/3 TB did not exhibit independent associations with LNM in any subgroup analysis (P>0.05, Table 3). Subgroup analyses revealed that positive PDC was an independent risk factor for LNM in the following subgroups: LOCRC, right-sided CRC, left-sided CRC, male patients, normal-weight patients, and overweight patients (P<0.05, Table 3). Detailed information of subgroup analysis was listed in Supplementary Table S3-S6 (Supplemental Digital Content 5-8, Supplemental Digital Content 1, https://links.lww.com/PAS/C439).
| Subgroups | TB* (grade 1 as reference) | PDC* (negative as reference) | PMCF† (low grade as reference) |
|---|---|---|---|
| EOCRC (n=424) | |||
| OR (95% CI) | 1.190 (0.366-3.869) | 1.988 (0.801-4.936) | 4.044 (1.619-10.098) |
| P | 0.773 | 0.138 | 0.002 |
| LOCRC (n=2187) | |||
| OR (95% CI) | 0.694 (0.429-1.125) | 1.767 (1.213-2.572) | 2.404 (1.685-3.428) |
| P | 0.138 | 0.003 | <0.001 |
| P Interaction | 0.465 | 0.582 | 0.408 |
| Male (n=1448) | |||
| OR (95% CI) | 0.774 (0.417-1.438) | 2.195 (1.351-3.565) | 3.012 (1.901-4.774) |
| P | 0.418 | 0.001 | <0.001 |
| Female (n=1163) | |||
| OR (95% CI) | 0.623 (0.318-1.222) | 1.413 (0.844-2.364) | 2.100 (1.294-3.407) |
| P | 0.169 | 0.188 | 0.002 |
| P Interaction | 0.556 | 0.200 | 0.332 |
| Right colon (n=421) | |||
| OR (95% CI) | 1.129 (0.297-4.289) | 3.138 (1.044-9.433) | 8.979 (2.949-27.337) |
| P | 0.858 | 0.042 | <0.001 |
| Left colon and rectum (n=2190) | |||
| OR (95% CI) | 0.693 (0.431-1.113) | 1.713 (1.186-2.473) | 2.197 (1.554-3.106) |
| P | 0.129 | 0.004 | <0.001 |
| P Interaction | 0.376 | 0.296 | 0.021 |
| Nonoverweight (n=1564) | |||
| OR (95% CI) | 0.716 (0.405-1.269) | 1.589 (1.019-2.478) | 2.500 (1.650-3.785) |
| P | 0.253 | 0.041 | <0.001 |
| Overweight (n=1047) | |||
| OR (95% CI) | 0.717 (0.345-1.491) | 2.239 (1.269-3.948) | 2.656 (1.541-4.578) |
| P | 0.373 | 0.005 | <0.001 |
| P Interaction | 0.459 | 0.230 | 0.782 |
* The OR and P-values were derived from multivariate logistic regression. Continuous variables including age, pre-CA199, BMI, tumor size, and categorical variables including sex (male/female), tumor location (right colon/left colon and rectum), LVI (negative/positive), PNI (negative/positive), TG (well and moderate /poor and muc and sig), depth of invasion (<1000 µm/≥1000 µm), morphology (undepressed/depressed), tumor budding (Grade 1/Grade 2 and 3), PDC (negative/positive), MM (Grade 1/Grade 2), BGA (presence/absence), family history of CRC (yes/no), MMR (dMMR/pMMR), HER-2 (-&1+/2+&3+), Ki-67 (<75%/≥75%), pre-CEA (<4.90/≥4.90), CT examination (negative/positive) were adjusted in multivariate logistic regression. P for Interaction was calculated through the interaction test.
† The OR and P-values were derived from multivariate logistic regression. Continuous variables including age, pre-CA199, tumor size, BMI and categorical variables including sex (male/female), tumor location (right colon/left colon and rectum), LVI (negative/positive), PNI (negative/positive), TG (well and moderate /poor and muc and sig), depth of invasion (<1000 µm/≥1000 µm), morphology (undepressed/depressed), PMCF (low grade/high grade), MM (Grade 1/Grade 2), BGA (presence/absence), family history of CRC (yes/no), MMR (dMMR/pMMR), HER-2 (-&1+/2+&3+), Ki-67 (<75%/≥75%), pre-CEA (<4.90/≥4.90), CT examination (negative/positive) were adjusted in multivariate logistic regression. P for Interaction was calculated through the interaction test.
BGA indicates background adenoma; BMI, body mass index; CEA, carcinoembryonic antigen; CRC, colorectal cancer; dMMR, deficient mismatch repair; EOCRC, early onset colorectal cancer; LNM, lymph node metastasis; LOCRC, late onset colorectal cancer; LVI, lymphovascular invasion; MMR, mismatch repair; Muc, mucinous carcinoma; PDC, poorly differentiated clusters; PMCF, peritumoral malignant cellular foci; pMMR, proficient mismatch repair; PNI, perineural invasion; Sig, Signet ring cell carcinoma; TB, tumor budding.
High-Grade PMCF was Associated With a Greater Number of Metastatic Lymph Nodes
After excluding 42 patients who underwent ER only, there were 274 LNM-positive patients in the total remaining cohort. We found that high-grade PMCF was associated with a significantly higher number of metastatic lymph nodes (P<0.05, Fig. 4A). However, neither Grade 2/3 TB nor positive PDC was associated with the number of metastatic lymph nodes (P>0.05, Fig. 4B-C). In addition, as independent risk factors in both the training and validation cohorts (Supplementary Table S2, Supplemental Digital Content 4, Supplemental Digital Content 1, https://links.lww.com/PAS/C439), absent BGA, positive CT examination, HER-2 with 2+/3+, Ki-67 ≥75% and positive LVI were also associated with a higher number of metastatic lymph nodes (P<0.05, Supplementary Fig. S2, Supplemental Digital Content 9, Supplemental Digital Content 1, https://links.lww.com/PAS/C439). The number of retrieved lymph nodes was comparable across those histologic parameters among these 274 LNM-positive patients (P>0.05, Supplementary Fig S3, Supplemental Digital Content 10, Supplemental Digital Content 1, https://links.lww.com/PAS/C439).
High-Grade PMCF was an Independent Risk Factor for D3 LNM
To investigate the predictive performance of PMCF for D3 LNM, we excluded patients who underwent ER alone, as well as LNM-positive cases without a specified lymph node station, from the total cohort. Multinomial LR and the heterogeneity test were then performed on the remaining 2485 patients. As shown in Table 4, high-grade PMCF was an independent risk factor for D3 LNM (P<0.05). Furthermore, it exhibited a much stronger association with D3 LNM than with D1 and D2 LNM (P heterogeneity <0.05). Similarly, high-grade PMCF was identified as an independent risk factor for skip metastasis (P<0.05, Table 5). In addition, positive PDC was identified as an independent risk factor for D1 and D2 LNM as well as nonskip metastasis (P<0.05, Table 4 and Table 5). However, neither TB nor PDC was an independent risk factor for D3 and skip metastasis (P>0.05, Table 4 and Table 5).
| D1 and D2 LNM (7.04%) | D3 LNM (0.60%) | |||
|---|---|---|---|---|
| Characteristics | OR (95% CI) | P | OR (95% CI) | P |
| TB† | ||||
| Grade 1 | Reference | Reference | ||
| Grade 2/3 | 0.862 (0.512-1.450) | 0.575 | 0.150 (0.017-1.350) | 0.091 |
| P heterogeneity | 0.197 | |||
| PDC† | ||||
| Negative | Reference | Reference | ||
| Positive | 1.613 (1.065-2.444) | 0.024 | 1.994 (0.421-9.447) | 0.385 |
| P heterogeneity | 0.932 | |||
| PMCF‡ | ||||
| Low grade | Reference | Reference | ||
| High grade | 2.615 (1.768-3.867) | <0.001 | 17.796 (4.004-79.087) | <0.001 |
| P heterogeneity | 0.027 | |||
* pT1 CRC patients who underwent ER alone, as well as LNM-positive cases with unspecified lymph node station, were excluded from the total cohort.
† The OR and P-values were derived from multivariate logistic regression. Continuous variables including age, pre-CA199, BMI, tumor size, and categorical variables including sex (male/female), tumor location (right colon/left colon and rectum), LVI (negative/positive), PNI (negative/positive), TG (well and moderate /poor and muc and sig), depth of invasion (<1000 µm/≥1000 µm), morphology (undepressed/depressed), tumor budding (Grade 1/Grade 2 and 3), PDC (negative/positive), MM (Grade 1/Grade 2), BGA (presence/absence), family history of CRC (yes/no), MMR (dMMR/pMMR), HER-2 (-&1+/2+&3+), Ki-67 (<75%/≥75%), Pre-CEA (<4.90/≥4.90), CT examination (negative/positive) were adjusted in multivariate logistic regression. P for heterogeneity was calculated through a likelihood ratio test with one degree of freedom.
‡ The OR and P-values were derived from multivariate logistic regression. Continuous variables including age, pre-CA199, tumor size, BMI and categorical variables including sex (male/female), tumor location (right colon/left colon and rectum), LVI (negative/positive), PNI (negative/positive), TG (well and moderate /poor and muc and sig), depth of invasion (<1000 µm/≥1000 µm), morphology (undepressed/depressed), PMCF (low grade/high grade), MM (Grade 1/Grade 2), BGA (presence/absence), family history of CRC (yes/no), MMR (dMMR/pMMR), HER-2 (-&1+/2+&3+), Ki-67 (<75%/≥75%), pre-CEA (<4.90/≥4.90), and CT examination (negative/positive) were adjusted in multivariate logistic regression. P for heterogeneity was calculated through a likelihood ratio test with one degree of freedom.
BGA indicates background adenoma; BMI, body mass index; CEA, carcinoembryonic antigen; CRC, colorectal cancer; D1, pericolic/perirectal lymph nodes; D2, intermediate lymph nodes; D3, main lymph nodes; dMMR, deficient mismatch repair; LNM, lymph node metastasis; LVI, lymphovascular invasion; MMR, mismatch repair; Muc, mucinous carcinoma; PDC, poorly differentiated clusters; PMCF, peritumoral malignant cellular foci; pMMR, proficient mismatch repair; PNI, perineural invasion; Sig, Signet ring cell carcinoma; TB, tumor budding.
| Nonskip metastasis (5.55%) | Skip metastasis (2.09%) | |||
|---|---|---|---|---|
| Characteristics | OR (95% CI) | P | OR (95% CI) | P |
| TB† | ||||
| Grade 1 | Reference | Reference | ||
| Grade 2/3 | 0.853 (0.491-1.482) | 0.573 | 0.613 (0.244-1.541) | 0.298 |
| P heterogeneity | 0.568 | |||
| PDC† | ||||
| Negative | Reference | Reference | ||
| Positive | 1.840 (1.173-2.884) | 0.008 | 1.215 (0.595-2.484) | 0.593 |
| P heterogeneity | 0.283 | |||
| PMCF‡ | ||||
| Low grade | Reference | Reference | ||
| High grade | 3.099 (2.013-4.771) | <0.001 | 3.733 (2.137-6.522) | <0.001 |
| P heterogeneity | 0.248 | |||
* pT1 CRC patients who underwent ER alone, as well as LNM-positive cases with unspecified lymph node station, were excluded from the total cohort.
† The OR and P-values were derived from multivariate logistic regression. Continuous variables including age, pre-CA199, BMI, tumor size, and categorical variables including sex (male/female), tumor location (right colon/left colon and rectum), LVI (negative/positive), PNI (negative/positive), TG (well and moderate /poor and muc and sig), depth of invasion (<1000 µm/≥1000 µm), morphology (undepressed/depressed), tumor budding (Grade 1/Grade 2 and 3), PDC (negative/positive), MM (Grade 1/Grade 2), BGA (presence/absence), family history of CRC (yes/no), MMR (dMMR/pMMR), HER-2 (-&1+/2+&3+), Ki-67 (<75%/≥75%), Pre-CEA (<4.90/≥4.90), CT examination (negative/positive) were adjusted in multivariate logistic regression. P for heterogeneity was calculated through a likelihood ratio test with one degree of freedom.
‡ The OR and P-values were derived from multivariate logistic regression. Continuous variables including age, pre-CA199, tumor size, BMI, and categorical variables including sex (male/female), tumor location (right colon/left colon and rectum), LVI (negative/positive), PNI (negative/positive), TG (well and moderate /poor and muc and sig), depth of invasion (<1000 µm/≥1000 µm), morphology (undepressed/depressed), PMCF (low grade/high grade), MM (Grade 1/Grade 2), BGA (presence/absence), family history of CRC (yes/no), MMR (dMMR/pMMR), HER-2 (-&1+/2+&3+), Ki-67 (<75%/≥75%), Pre-CEA (<4.90/≥4.90), CT examination (negative/positive) were adjusted in multivariate logistic regression. P for heterogeneity was calculated through a likelihood ratio test with one degree of freedom.
BGA indicates background adenoma; BMI, body mass index; CEA, carcinoembryonic antigen; CRC, colorectal cancer; dMMR, deficient mismatch repair; LNM, lymph node metastasis; LVI, lymphovascular invasion; MMR, mismatch repair; Muc, mucinous carcinoma; PDC, poorly differentiated clusters; PMCF, peritumoral malignant cellular foci; pMMR, proficient mismatch repair; PNI, perineural invasion; Sig, Signet ring cell carcinoma; TB, tumor budding.
In addition, the heterogeneity test revealed that positive LVI, depressed tumor morphology, absent BGA, and Ki-67 ≥75% exhibited stronger associations with D3 LNM (P heterogeneity <0.05, Supplementary Table S7, Supplemental Digital Content 11, Supplemental Digital Content 1, https://links.lww.com/PAS/C439). However, no statistically significant differences were found between skip metastasis and nonskip metastasis (P heterogeneity >0.05, Supplementary Table S8, Supplemental Digital Content 12, Supplemental Digital Content 1, https://links.lww.com/PAS/C439).
Associations Between PMCF and Other Histologic Parameters
As shown in Table 6, high-grade PMCF was significantly correlated with positive LVI, positive PNI, poor tumor differentiation, smaller tumor size, deeper submucosal invasion depth, depressed tumor morphology, severe or complete loss of MM, absence of BGA, elevated Ki-67 expression, and pre-CEA expression (P<0.05).
| Characteristics | Low-grade PMCF (n=1808) | High-grade PMCF (n=803) | P |
|---|---|---|---|
| Sex (%) | |||
| Male | 1018 (56.3) | 430 (53.5) | |
| Female | 790 (43.7) | 373 (46.5) | 0.191 |
| Age (y) | 59.7±11.0 | 59.9±11.0 | 0.547 |
| BMI (kg/m2) | 23.3±3.3 | 23.3±3.0 | 0.386 |
| Tumor location | |||
| Right colon | 301 (16.6) | 120 (14.9) | |
| Left colon and rectum | 1507 (83.4) | 683 (85.1) | 0.274 |
| LVI | |||
| Negative | 1712 (94.7) | 647 (80.6) | |
| Positive | 96 (5.3) | 156 (19.4) | <0.001 |
| PNI | |||
| Negative | 1788 (98.9) | 772 (96.1) | |
| Positive | 20 (1.1) | 31 (3.9) | <0.001 |
| Tumor grade | |||
| Well/moderate | 1682 (93.0) | 681 (84.8) | |
| Poor/Sig/Muc | 126 (7.0) | 122 (15.2) | <0.001 |
| Tumor size (mm) | 24.2±13.1 | 22.6±11.4 | 0.013 |
| Depth of invasion (µm) | |||
| <1000 | 545 (30.1) | 144 (17.9) | |
| ≥1000 | 1263 (69.9) | 659 (82.1) | <0.001 |
| Morphology | |||
| Undepressed | 1627 (90.0) | 663 (82.6) | |
| Depressed | 181 (10.0) | 140 (17.4) | <0.001 |
| Muscularis mucosae | |||
| Grade 1 | 528 (29.2) | 90 (11.2) | |
| Grade 2 | 1280 (70.8) | 713 (88.8) | <0.001 |
| BGA | |||
| Absence | 363 (20.1) | 245 (30.5) | |
| Presence | 1445 (79.9) | 558 (69.5) | <0.001 |
| Family history of CRC | |||
| No | 1752 (96.9) | 787 (98.0) | |
| Yes | 56 (3.1) | 16 (2.0) | 0.112 |
| MMR | |||
| pMMR | 1721 (95.2) | 776 (96.6) | |
| dMMR | 87 (4.8) | 27 (3.4) | 0.094 |
| HER-2 | |||
| −/1+ | 1684 (93.4) | 731 (91.0) | |
| 2+/3+ | 124 (6.6) | 72 (9.0) | 0.059 |
| Ki-67 (%) | |||
| <75% | 1312 (72.6) | 512 (63.8) | |
| ≥75% | 496 (27.4) | 291 (36.2) | <0.001 |
| Pre-CEA (ng/mL) | |||
| <4.90 | 1636 (90.5) | 697 (86.8) | |
| ≥4.90 | 172 (9.5) | 106 (13.2) | 0.005 |
| Pre-CA199 (U/mL) | 11.3±32.5 | 12.0±18.6 | 0.535 |
BGA indicates background adenoma; BMI, body mass index; CRC, colorectal cancer; dMMR, deficient mismatch repair; LVI, lymphovascular invasion; MMR, mismatch repair; Muc, mucinous carcinoma; PMCF, peritumoral malignant cellular foci; pMMR, proficient mismatch repair; PNI, perineural invasion; Pre-CA199, preoperative CA199; Pre-CEA, preoperative carcinoembryonic antigen; Sig, Signet ring cell carcinoma.
Development of a PMCF-Based LNM Prediction Model
A PMCF-based LNM prediction model was constructed using the LR algorithm. As illustrated in Figure 5, this model exhibited significantly better predictive performance than current clinical guidelines (P<0.05) in both the training and validation cohorts. Therefore, the PMCF-based LNM prediction model holds potential to guide additional RS. In addition, to facilitate the clinical use of this model, we have constructed a web calculator (Fig. 6, Supplemental Digital Content 13, Supplemental Digital Content 1, https://links.lww.com/PAS/C439).
Interobserver Agreement
PMCF yielded substantial interobserver agreement (Cohen Kappa=0.700, P<0.05), a value similar to the Kappa of 0.719 for PDC and far higher than that for TB (Cohen Kappa=0.563, Table 7).
| Characteristics | PMCF (Low Grade VS High Grade) | PDC (Negative VS Positive) | TB (Grade 1 VS Grade 2/3) |
|---|---|---|---|
| Kappa coefficient | 0.700 | 0.719 | 0.563 |
| P | < 0.001 | < 0.001 | < 0.001 |
PDC indicates poorly differentiated clusters; PMCF, peritumoral malignant cellular foci; TB, tumor budding.
Discussion
In this study, we found that PMCF provides better LNM risk stratification than either TB or PDC in pT1 CRC. The association between PMCF and LNM remained significant in subgroup analyses stratified by age, sex, tumor location, and BMI. In addition, high-grade PMCF was associated with a significantly greater number of metastatic lymph nodes. Furthermore, as an emerging risk factor for D3 LNM, high-grade PMCF showed a markedly stronger association with D3 LNM than with D1 and D2 LNM.
In current guidelines, additional RS is recommended when Grade 2/3 TB is identified.2–4 However, in our results, TB ceased to be an independent risk factor upon adjustment for PDC. This finding aligns with previous studies,5,6 which similarly demonstrated that TB was no longer an independent predictor following adjustment for PDC. Although PDC has not yet been incorporated into any clinical guidelines, emerging evidence suggests its potential as a predictive marker.6,7 Notably, in our results, after adjustment for TB, PDC was not a robust independent risk factor. We postulated that the predictive performance of TB and PDC for LNM in pT1 CRC is substantially influenced by their mutual interaction. Researchers have found considerable overlapping between TB and PDC in terms of molecular characteristics and clinical utility. Compared with the background tumor, both TB and PDC exhibited elevated nuclear β-Catenin and reduced E-Cadherin expression.10 KRAS mutations were more frequent in both high-grade TB and PDC.36 TB and PDC engaged in dynamic epithelial-mesenchymal transition (EMT).37,38 A recent research found that MYC downregulation and RUNX2 upregulation contributed to the acquisition of an invasive phenotype with TB and PDC.39 Moreover, the combination of TB and PDC provides superior prognostic stratification in CRC.40 Based on our findings and previous research, it is plausible that TB and PDC represent a continuous invasive spectrum with shared biological features as one pathologic entity. Regardless of cellularity within each tumor cell cluster at the invasive front, a greater number of clusters correlates with more aggressive LNM progression. Therefore, a separate assessment of TB or PDC might not comprehensively reflect the biological continuum of pT1 CRC LNM. This prompts critical questions: Is the 5-tumor-cell threshold a reasonable cutoff? May TB and PDC be considered as one integrated pathologic entity? Multiple studies have investigated the combination of TB and PDC for predicting LNM in pT1 CRC. Backes et al5 proposed that the presence of either TB of Grade 2/3 or PDC of Grade 2/3 (Grade 1: 0-4 PDCs; Grade 2: 5-9 PDCs; Grade 3: ≥10 PDCs) could effectively predict LNM. Martínez et al41 demonstrated that a combination of TB2/3 and high-grade PDC (positive PDC, consistent with the definition used in this study) could reduce unnecessary surgeries by 41.5% to 45% in pT1 CRC. Nevertheless, TB and PDC were still regarded as separate pathologic entities under standard grading criteria in these studies. In essence, these studies failed to capture the full morphologic spectrum of the tumor invasive front with one single pathologic parameter. To address these limitations, here we first defined PMCF as nonglandular malignant cellular foci consisting of ≥1 tumor cell at the tumor invasive front. Functioning as a unified biomarker, high-grade PMCF was found to be an independent risk factor with superior predictive performance. Beyond this, PMCF’s role as a holistic biomarker offers several practical advantages: it effectively eliminates the challenging and somewhat arbitrary distinction between 4-cell and 5-cell clusters, provides stronger LNM risk stratification than either TB or PDC with substantial reproducibility, captures the full morphologic spectrum and likely represents the biological continuum of the tumor invasive front. However, several practical problems should be considered: 1. Small malignant cellular foci that are indistinguishable from stromal components, such as macrophages, fibroblasts, inflammatory cells, or necrosis area should be discriminated to avoid overestimation of PMCF. 2. Malignant cellular foci within large mucin pools should not be classified as PMCF. 3. In case of numerous PMCF, poorly differentiated adenocarcinoma or micropapillary adenocarcinoma should be carefully distinguished.
The association between LNM risk factors and the number of metastatic lymph nodes remains unexplored. In our study, high-grade PMCF, absent BGA, positive CT examination, HER-2 with 2+/3+, Ki-67 ≥75%, and positive LVI demonstrated a stronger association with greater numbers of metastatic lymph nodes. Therefore, patients with these risk factors may require not only additional RS after ER but also more extensive lymph node dissection to reduce the risk of residual tumor.
To date, only the JSCCR has offered recommendations on the extent of lymph node dissection for pT1 CRC.2 For clinically LNM-negative (cN(−)) patients, D2 lymph node dissection is recommended, whereas D3 dissection is recommended for cN(+) patients. Nonetheless, it remains unclear whether D3 dissection is truly necessary for pT1 CRC patients diagnosed as cN(+). Moreover, the patients who could benefit from D3 dissection have not been well defined. In our opinion, despite the extremely low rate of D3 LNM in pT1 CRC, routine D3 dissection is not applicable to all LNM-positive cases. Given that an appropriate extent of lymph node dissection can substantially reduce the risk of perioperative complications,42,43 exploring risk factors for D3 LNM is of great significance. Our results revealed that high-grade PMCF, positive LVI, depressed tumor morphology, Ki-67 ≥75%, and absent BGA were significantly associated with an increased risk of D3 LNM. These findings suggest that patients with the above risk factors warrant close vigilance against potential D3 LNM. More rigorous evaluation for D3 LNM should be performed during both preoperative radiologic assessment and intraoperative examination to facilitate the extent of lymph node dissection.
Several limitations of this study should be acknowledged. First, this study prospectively enrolled a relatively modest number of patients from a single center. Thus, a larger prospective cohort from multicenter is required to validate the pathologic and clinical value of PMCF. Second, the event number with D3 metastasis might be insufficient to create a stable multivariate model for identifying the high-risk factors for D3 LNM. Thus, these findings must be interpreted cautiously. Expanding the sample size of D3 LNM patients is necessary in the future study. Third, this study included only Chinese cohorts. Future validation of the utility of PMCF in international cohorts is therefore warranted.
In conclusion, high-grade PMCF not only suggests additional RS after ER in pT1 CRC, but may also indicate D3 lymph node dissection. As a better pathologic predictor of LNM, PMCF provides an evidence-based rationale to optimize surgical decision-making in pT1 CRC.
Acknowledgments
The authors thank the staff from the department of pathology at all participating centers for providing pathologic slides.