- 问题:ADNC 半定量框架在晚期区分度差——同一诊断类别内病理严重程度差异很大,部分无认知障碍者被归为重度 ADNC。作者设定目标:Braak NFT V 期应总是伴认知受损(MCI 或痴呆),VI 期应总是痴呆。
- 方法:肯塔基大学 ADRC 尸检队列 329 例(均在死前 2 年内有临床评估),四个新皮质区(额中回、颞上中回、顶下小叶、枕叶)PHF-1 免疫组化,全切片图像经 AI 分别做基于对象的 NFT 计数(个/mm²)与基于像素的 pTau 负荷(染色面积 %),并比较 HALO 与 Aperio 两个平台、PHF-1 与 AT8 两种抗体。
- 结果:颞上中回 + 枕叶两区 NFT 密度即与认知相关性良好;无认知受损者 NFT 合计最高约 19 个/mm²,受损组远超 45 个/mm²,据此重定重度期切点,17% 病例重新分期,与原 Braak 分期的线性关系由 R² 0.5140 提高到 0.6582。
- 可推广性:HALO 全自动流程每张切片常不足 1 分钟(Aperio 质控 + 检测可达约 40 分钟);同一算法在 UT 圣安东尼奥中心复用,计数几乎完全一致;PHF-1 与 AT8 相邻切片的定量 R² 0.73–0.91。附表 1–5 与图 1–8 中英对照。
收录范围:PMC 开放获取全文(CC BY 4.0)——摘要、引言、方法、结果、讨论、结论,表 1–5 与图 1–8 及图注中英对照;作者贡献、资助、利益冲突、伦理声明、补充材料与参考文献未收录。
摘要
阿尔茨海默病神经病理改变(ADNC)通过半定量参数加以操作性界定,是基于共识的疾病严重程度诊断评估金标准。ADNC 诊断框架虽有实用价值,但也存在局限,尤其是在疾病晚期,同一诊断类别内的病理严重程度差异很大。此外,一些没有认知障碍的个体被不恰当地归类为重度 ADNC。本研究将定量病理指标和替代性组织取样方案与生前认知状态数据相结合,以制定有临床依据的神经病理诊断阈值。本研究的具体目标是建立由数据驱动的标准化诊断切点,使 ADNC 最严重的分期具有一致的含义:Braak 神经原纤维缠结(NFT)V 期病例始终存在认知障碍(轻度认知障碍[MCI]或痴呆),而 Braak 神经原纤维缠结 VI 期病例始终存在痴呆。我们利用全切片成像和基于 AI 的图像分析,在肯塔基大学 ADRC 尸检队列的三个病例子样本中,比较了各新皮质脑区基于对象(NFT 计数)和基于像素(磷酸化 tau[pTau]负荷)的定量结果(n = 329,所有病例均在死亡前 2 年内接受过临床评估)。我们还比较了 HALO 与 Aperio 平台的结果,以及 AT8 与 PHF‐1 pTau 抗体的结果。应用细化后的阈值,使既往分类与数字化测定的恰当状态不一致的病例得以重新分类:因此,17% 的病例被重新分类。使用商用软件、标准化分类器架构及可互操作的分析流程,促进了可扩展、可重复的数字化定量。在德克萨斯大学圣安东尼奥分校进行的跨机构验证中,两个研究中心应用了相同算法,证实病理计数几乎完全一致,突出了其可共享性,以及将协调一致的数字化工作流程用于协作研究和诊断的可行性。这些发现支持将定量数字病理纳入标准神经病理方案,并为未来的多中心研究提供可扩展的模式。通过支持分析平台、pTau 抗体和解剖取样策略之间的比较,更新后的工作流程表现出高度可重复性及一致的临床病理相关性。
引言
根据美国国家老龄化研究所–阿尔茨海默病协会(NIA‐AA)基于共识的指南 [1, 2],阿尔茨海默病神经病理改变(ADNC)的标志性病变是 β‐淀粉样肽(Aβ)沉积、神经炎性淀粉样斑和神经原纤维缠结(NFT),各自采用半定量指标进行分类。在 ADNC 的标志性病理改变中,NFT(由磷酸化 tau,即 pTau,构成的神经元内包涵体)与认知障碍的关联最强 [3]。Braak 神经原纤维缠结分期构成一种具有高度顺序性的量表(共七期,从 0 期至 VI 期),反映 NFT 在脑内的空间分布 [4, 5, 6, 7, 8]。Braak 神经原纤维缠结分期衡量 pTau 病理改变按固定模式扩展的过程:起初局限于跨内嗅皮质(Braak 神经原纤维缠结 I 期),随后累及边缘系统区域,最终在 Braak 神经原纤维缠结 VI 期扩展至多个新皮质脑区。与较早分期不同,Braak 神经原纤维缠结 IV 至 VI 期常伴有可测量的临床功能下降 [9, 10, 11]。Braak 神经原纤维缠结分期的方法已从银染发展为 pTau 免疫组织化学,目前 Alafuzoff 等描述的方案已成为 Braak 神经原纤维缠结分期的标准 [8]。虽然 Braak 神经原纤维缠结分期仍是描述(事实上也是界定)ADNC 严重程度的重要工具,但被划入同一 Braak 神经原纤维缠结分期的个体,其认知功能和病理负荷可能差异很大 [11, 12, 13]。这种不完全的临床病理相关性降低了 Braak 神经原纤维缠结分期的解释效用。本研究旨在使病理诊断与临床损害的严重程度更紧密地联系起来,并使数字病理在 ADNC 诊断中的应用标准化。
在当代数字和定量神经病理时代,Braak 神经原纤维缠结分期的其他一些局限也日益显现。Braak 神经原纤维缠结分期体系本质上是半定量的,描述的是 NFT 沉积的解剖范围,而非其绝对负荷。因此,两个 Braak 神经原纤维缠结分期相同的病例,其 pTau 病理负荷可能相差甚大 [14, 15]。染色方案、抗体表位和成像平台的差异还会带来额外变异,这些因素均可能影响判定“阳性”病理改变的阈值,最终影响患者的诊断分类 [16]。为帮助解决这些局限,多个研究团队和联盟已协调统一 pTau 免疫组织化学方案,建立标准化区域取样模板,并引入补充标准以提高可重复性 [8, 17, 18, 19, 20]。此外,越来越多的神经病理医师在传统 Braak 神经原纤维缠结分期的基础上增加 pTau 病理改变的数字化定量 [14, 21, 22, 23, 24, 25, 26]。
数字病理方法的日益普及,代表着从以半定量、解剖部位二分判定为主的分期,向更严格的病理严重程度定量指标转变,以提高神经病理评估与可测量认知结局之间的一致性。然而,迄今尚未利用数字病理方法,对现有半定量指标进行数据驱动的细化。更具体地说,目前尚无一种定量方法,能基于融合数字病理与临床数据的开发模型,区分 NIA‐AA 指南所规定的重度 ADNC 的不同分期。
数字病理通过将组织切片数字化并实现先进的计算分析,正在把传统的、依赖观察者的评估转变为更具定量性的学科 [27, 28, 29, 30, 31, 32, 33]。这一转变的核心是整合人工智能(AI),尤其是机器学习(ML)和深度学习(DL),这些技术已成为现代病理工作流程中非常实用的工具。AI 算法目前可自动执行图像分割、特征提取和分类等任务,从而同时提高诊断准确性与工作效率 [34, 35, 36, 37, 38]。对于神经病理医师,PathoFusion 等工具利用卷积神经网络分析全切片图像(WSI),检测与神经病理相关的、细微但可量化的组织形态学特征 [38, 39, 40, 41, 42, 43]。除识别和量化与神经退行性疾病相关的病理现象外,这些系统还支持肿瘤分级,以及与神经影像和基因组数据的多模态整合,以实现更个体化的诊断 [37, 40, 44, 45, 46, 47, 48]。
AI 驱动工具以及 HALO、Aperio、QuPath 等商业平台的最新进展,使对整张切片的病理改变进行高通量、像素级分割成为可能 [49, 50, 51, 52]。包括 U‐Net、SegNet 和全卷积网络(FCN)在内的深度学习架构可生成稳健的 pTau 负荷、病理密度和空间聚集指标,这些指标共同提供了疾病相关病理改变稳健、全面且可重复的定量与定性特征谱 [53, 54, 55, 56, 57]。
肯塔基大学阿尔茨海默病研究中心(UK‐ADRC)自 2012 年起,依照已发表的工作流程,将数字病理技术纳入所有尸检的常规评估 [9, 22]。通过较早开展 WSI 和计算分析,UK‐ADRC 已将图像衍生指标用于常规神经病理评估,推动了将基于 WSI 的定量病理读出纳入评估的转变 [22, 58, 59]。除了基于这些资源发表的多篇相关研究论文 [59, 60, 61, 62, 63, 64, 65, 66],该虚拟生物样本库还促进了 UK‐ADRC 的病理诊断,并有助于建立联邦式数字切片档案。然而,由于缺乏用于共享 WSI 和分析流程的基础设施,跨机构的广泛应用仍然受限。此外,广泛用于数字分析的 Aperio 软件正被制造商逐步淘汰。
为克服这些障碍,我们使用商用 HALO 数字病理软件进行构建、训练和测试,以实现图像数据与分析模块的跨机构共享。我们与德克萨斯大学圣安东尼奥健康科学中心(UTHSA)ADRC 共享了标准化流程,包括经训练的组织分类器、对象检测算法和分析参数,从而实现跨中心的标准化 pTau 病理定量。这项工作反映了该领域更广泛的演进,即从基于解剖的半定量分期转向更具定量性、由临床和病理数据驱动的体系,并强调数字神经病理在推动 ADNC 评估现代化中的关键作用 [22, 67, 68]。本研究的总体目标之一是同时依据数字病理指标和生前认知数据,制定标准化、定量、可共享且具有临床意义的阈值,以区分 Braak 神经原纤维缠结 IV–VI 期。
方法
研究参与者、子样本、纳入及排除标准
样本来自 UK‐ADRC 尸检队列,该队列以肯塔基州列克星敦地区的社区人群为基础。该队列的人口学特征、招募策略及其他相关细节已在既往文献中描述 [69, 70, 71]。绝大多数纳入的参与者在神经功能正常时进入研究,并接受纵向随访直至尸检。如既往所述 [72, 73, 74, 75, 76, 77],研究纳入病例的特征是在 ADRC 共识会议上,依据临床表现和认知能力(即“正常”“受损”“痴呆”)进行判定,主要意见由临床医师提供。
从整个 UK‐ADRC 队列中选取三个子样本,用于训练、验证和跨中心标准化分析。队列 1(n = 81)由“单纯”ADNC 病例组成,特别排除了存在共存病理改变的个体,例如路易体痴呆(DLB)、边缘系统为主的年龄相关性 TDP‐43 脑病神经病理改变(LATE‐NC),以及皮质基底节变性(CBD)、Pick 病、进行性核上性麻痹(PSP)等 tau 蛋白病,或其他伴 pTau 包涵体的额颞叶变性(FTLD‐tau)亚型。队列 1 的纳入还要求具有死亡前 2 年内取得的简易精神状态检查(MMSE)评分,以确保可靠的临床病理相关性。队列 2(n = 329)作为主要测试子样本,采用与队列 1 相似的排除标准和时间限制进行选择,同样仅限于具有死亡前 2 年内 MMSE 数据的病例。但与队列 1 不同,队列 2 未排除伴有共病病理改变(DLB、LATE‐NC、FTLD‐tau 等)的病例。队列 3(n = 58)在每个 Braak 神经原纤维缠结分期(II–VI 期)中随机抽取约 12 例,以确保各疾病分期均衡地得到代表。第三个队列用于评估检测方法在不同解剖区域及不同组织学染色中的表现。这些队列共同支持了数字神经病理评估范式的系统训练、验证和中心间比较。
组织制备与免疫组织化学
本研究在四个新皮质脑区完成免疫组织化学及分析:额中回(MFG,Brodmann 分区[BA]9)、颞上回和颞中回(SMTG,BA 21/22)、顶下小叶(BA 40)以及枕叶纹状皮质(BA 17/18/19)。这些新皮质脑区均在尸检时常规取样。在石蜡包埋的人尸检脑组织 8 μm 厚切片上,使用 PHF‐1 抗体(小鼠单克隆,1:1000,由已故 Peter Davies 博士惠赠)及 AT8(1:1000,Thermo Fisher Scientific,货号 MN1020,RRID: AB_223647)进行 pTau 免疫组织化学染色。切片首先用二甲苯脱蜡,再经梯度乙醇系列(100%、95% 和 80%)复水至蒸馏水。在 Dako 低 pH 靶抗原修复液(TRS Lo,pH 6;货号 GV805)中于 95°C 进行抗原修复 6 min,随后在室温下冷却 10 min。切片用流动蒸馏水冲洗 10 min,再置于振荡器上用 1× TBS 平衡 5 min。通过在含 20% 甲醇和 3% 过氧化氢的溶液中孵育 30 min,淬灭内源性过氧化物酶活性。再以蒸馏水冲洗并用 TBS 洗涤 5 min 后,将切片置于用 1× TBS 配制的 5% 脱脂奶粉溶液中,在室温下封闭 1 h。一抗孵育在湿盒中于 4°C 过夜进行。次日,用 1× TBS 洗涤切片两次(每次 5 min),随后与生物素化马抗小鼠二抗(Vector Laboratories,货号 BA‐2000,1:250)在室温下孵育 1 h。再经 TBS 洗涤两次后,使用按制造商说明配制的 VECTASTAIN® Elite ABC 过氧化物酶试剂盒(Vector Laboratories,货号 PK‐6100)处理切片 1 h。逐滴加入 DAB 显色液(DAKO,货号 K3468),直至观察到充分的信号显色。随后将切片浸入去离子水中终止反应,洗涤 5 min,并用 IMCB Harris 苏木精(#HH‐160)复染。再次用去离子水冲洗后,切片经递增浓度的乙醇(80%、95% 和 100%)脱水,以二甲苯透明,并用永久性封片剂加盖盖玻片。切片固化 48 h 后进行 WSI 扫描。染色后,使用 Leica/Aperio AT‐2 扫描仪以 40× 放大倍率生成数字化 WSI。
UK‐ADRC 历来采用以不断演进的共识指南为基础的方法进行 Braak 神经原纤维缠结分期诊断。本研究聚焦于 Braak 神经原纤维缠结 IV 至 VI 期,UK‐ADRC 传统上依据新皮质中通过 PHF‐1 pTau 抗体识别的 pTau NFT 密度来区分这些分期。尽管基于共识的方法着重于纹状皮质和颞叶新皮质,以区分重度 Braak 神经原纤维缠结分期,但额中回和顶叶皮质的染色也被纳入 UK‐ADRC 的诊断阈值判定规则,虽然此前并没有用于区分 Braak 神经原纤维缠结 IV 期与 V 期的具体界值 [2, 4, 5, 6, 7, 8, 78, 79, 80]。
使用 Aperio 软件的分析流程
如既往详细描述 [22],我们采用 Leica/Aperio“Genie”图像分析软件系统(本文简称“Aperio”),评估选定灰质感兴趣区(ROI)内的 pTau 病理改变。最初未采用全切片定量,原因是病例间灰质与白质比例差异过大,且处理时间过长;取而代之的是,在病理信号强度一致的灰质区域内布置固定大小的正方形 ROI(每张切片 10 个 ROI,每个 4 mm2)[22](图 S1A,补充信息)。ROI 分布于整个组织,以尽可能增大空间间隔,同时避免重叠及染色不佳或结构变形的区域。采用负向选择工具,手动将组织皱褶、制备碎屑和脑膜血管等非神经成分排除在分析之外(图 S1A)。ROI 按照取样策略手动放置,而非真正随机选择。这种方法使 ROI 广泛而一致地分布于可用灰质中,以提高可重复性,同时避开可能干扰定量分析的染色伪影和组织变形。
随后,使用经改良、针对 pTau(PHF‐1 抗体)免疫反应性优化的细胞核检测算法,通过 Aperio 软件定量 NFT 密度。通过系统评估最小细胞核尺寸阈值,在保留真阳性检出的同时,尽量减少将胶质细胞核或背景信号等非 NFT 成分纳入。为建立一种可广泛应用的分析方法,我们在具有代表性的病例子集中测试了多种阈值条件,并将算法输出与人工标注进行比较,以确定最佳检测阈值。最终分析覆盖各灰质 ROI,NFT 密度按检出的 NFT 总数除以分析组织总面积进行标准化计算(图 S1C)。此外,使用针对显色检测调校的自定义阳性像素计数(PPC)算法评估 pTau 负荷。输出值表示为高强度像素相对于所分析组织总面积的比例 [22](图 S1D)。
使用 HALO 软件的更新分析流程
采用 HALO 图像分析平台(4.1.6 版,Indica Labs,美国新墨西哥州阿尔伯克基)开发了修订后的分析流程。该更新工作流程将三个分类器模块整合为单一自动化流程,从而简化预处理并改善组织分类。该数字化流程使用既往已染色并数字化的 WSI,首先去除玻璃/背景和脑膜组织。组织检测分类器采用 2.0 μm/像素的分辨率设置进行调校,并设定门限,仅检测最小面积为 500 μm2 的对象。组织检测分类器以 >500 个对象进行训练,迭代 400,000 次,达到 <0.01 的熵值。随后,质量控制分类器将组织皱褶、撕裂、聚焦不佳区域及外来碎屑从可用组织中剔除。质量控制分类器同样采用 2.0 μm/像素的分辨率调校,并设置为检测 >100 μm2 的对象。该分类器也以 >500 个对象训练,完成 300,000 次训练迭代,直至熵值 <0.01。最后,灰质/白质分割分类器用于区分皮质区域,并在灰质与白质之间生成不同的标注层,以用于区域分析。最后这个分类器采用 7.00 μm/像素的分辨率调校,以忽略灰质/白质染色的细小变化,并仅检测 >5000 μm2 的对象。该分类器同样以 >500 个对象进行训练,共迭代 750,000 次,在熵值达到 <0.01 后仍继续训练。通过分类器验证,检验灰质/白质分割的准确性和精确度。将标注区域分为训练集(占标注区域的 80%)、验证集(10%)和测试集(10%)。分类器验证所得精确率为 0.969,召回率为 0.961,F1 分数为 0.965(图 S2)。
自动检测流程完成后,首先使用对象共定位模块进行 NFT 定量。该模块根据设定阈值的显色强度、空间形态和尺寸限制,检测并计数离散的免疫阳性对象。该算法可在每张切片全部分割出的灰质中精细识别 NFT 结构,输出表示为每 mm2 的 NFT 密度。对象共定位分析中的参数依据尺寸、检测模糊半径和对比度半径,以及对比度阈值和光密度进行优化,以排除非特异性信号和伪影性包涵体。最终的 HALO 模块配置经过优化,可准确识别并定量 PHF‐1 阳性 NFT 的形态特征(即计数 NFT,而不仅是阳性染色),同时排除营养不良性神经突和神经炎性斑。
进一步使用面积定量模块测量 pTau 负荷,该模块经优化,可检测 DAB 标记的像素,并计算显示免疫阳性的组织表面积百分比(染色组织百分比)。这种方法提供了基于表面积的高分辨率 pTau 病理定量,并在先前使用 Aperio 系统分析的相同解剖区域中进行验证。然而,如前所述,与 Aperio 软件中的处理方式不同,基于 HALO 的分析覆盖每张切片全部分割出的灰质。两个平台的定量输出均与临床元数据整合,包括认知状态(依据临床共识和末次 MMSE 评分)及 Braak 神经原纤维缠结分期。这一框架支持 Aperio 与 HALO 流程之间的比较。HALO 对象检测流程被配置为生成 NFT 特异性定量输出,旨在模拟并更新 Aperio 衍生的 NFT 密度测量,而不是泛化地定量所有 pTau 阳性成分。HALO 还基于面积定量提供了总体 pTau 负荷的补充指标,从而能够与 Aperio 的 NFT 病灶密度和阳性像素计数分别进行同类比较。
临床病理相关性
为确定建立 ADNC 临床病理关系模型的最佳解剖取样和分析策略,我们定量了每个病例四个新皮质脑区的 NFT 密度和总体 pTau 负荷。利用 HALO 和 Aperio 两种数字病理平台的数据,我们评估了区域病理改变与 MMSE 评分所测认知表现之间的相关性。对于每项指标,我们评估了一个、两个、三个和四个脑区的所有可能组合,以确定使预测准确性和效率最大化的取样策略。采用决定系数(R 2)评估定量病理与认知状态之间的关联强度,并将结果按分析平台和病理类型分层,以热图呈现(表 S1)。
建立数据驱动的诊断分期阈值
为进一步评估用于重度 Braak 神经原纤维缠结分期分类的、具有临床依据的定量阈值,我们重点研究了两个新皮质脑区,即颞上回和颞中回以及枕叶皮质。利用队列 1 的数据,计算这两个脑区的 NFT 密度(每 mm2 计数的 NFT 数),生成每个病例的综合 pTau 病理负荷。随后按总 NFT 密度对个体进行排序,并依据死亡前 2 年内的认知状态选择界值。阈值依据同时结合病理数据和临床损害数据的标准定义。Braak 神经原纤维缠结 VI 期仅限于临床诊断为痴呆的个体,不论其 NFT 负荷如何。将由队列 1 得出的阈值模型应用于队列 2,当病理和认知数据与最初诊断的 Braak 神经原纤维缠结分期不一致时,相应地对病例重新分期。这种方法实现了对重度 ADNC 分类的数据驱动细化,同时保持与 Braak 神经原纤维缠结分期框架解剖逻辑的连续性。各 Braak 神经原纤维缠结分期的状态变化及平均 MMSE 评分见表 S1 和 S2。
数据分析
所有统计分析均使用 JMP Pro 软件 14.0 版(SAS Institute,美国北卡罗来纳州卡里)或 GraphPad Prism 软件 8.0 版完成。所有图形和热图也均使用 GraphPad Prism 生成。
结果
总体工作流程与研究设计
研究目标和工作流程见表 1 和图 1。
| 目标 | 具体子目标 | 实现目标的方法 | 使用的队列 |
|---|---|---|---|
| 总体目标 | 使用数字病理优化对重度 ADNC 关键参数(新皮质神经原纤维病理改变)的常规评估,为 Braak 神经原纤维病理分期提供依据 | 建立可重复的数字化 pTau 病理定量测量框架,以提高分析精确度并加强临床与病理分期的一致性 | 队列 1/2 |
| 常规评估的临床相关性 | (a) 从临床相关性角度评估 pTau 负荷与 NFT 密度计数的应用 | 评估基于面积与基于对象的 pTau 指标对认知和功能结局的预测效度 | 队列 1/2 |
| (b) 从临床相关性角度评估取样(分析纳入的解剖区域)的影响 | 通过建模评估区域取样策略对疾病分期区分及认知下降预测的贡献 | 队列 1 | |
| (c) 制定 Braak 神经原纤维缠结 IV–VI 期的实际界值 | 利用数字化 NFT 指标与临床表型之间由数据驱动的相关性,推导晚期 Braak 分类的定量阈值 | 队列 1 | |
| 常规评估的标准化 | (a) 评估将数字化分割、病理识别和定量从 Aperio 平台转为 HALO 平台的可能性 | 开展跨平台验证,量化系统间一致性,并识别算法或分类器相关偏倚 | 队列 1/2 |
| (b) 评估在不同研究中心使用相同 HALO 模块的情况 | 开展多中心可重复性分析,确定实验室间变异并优化模块的协调统一 | 队列 3 | |
| (c) 评估使用不同 pTau 抗体的影响及相应的方法学策略 | 比较不同 pTau 表位(AT8、PHF‐1)的数字化定量输出,以表征抗体特异性信号变异 | 队列 3 |
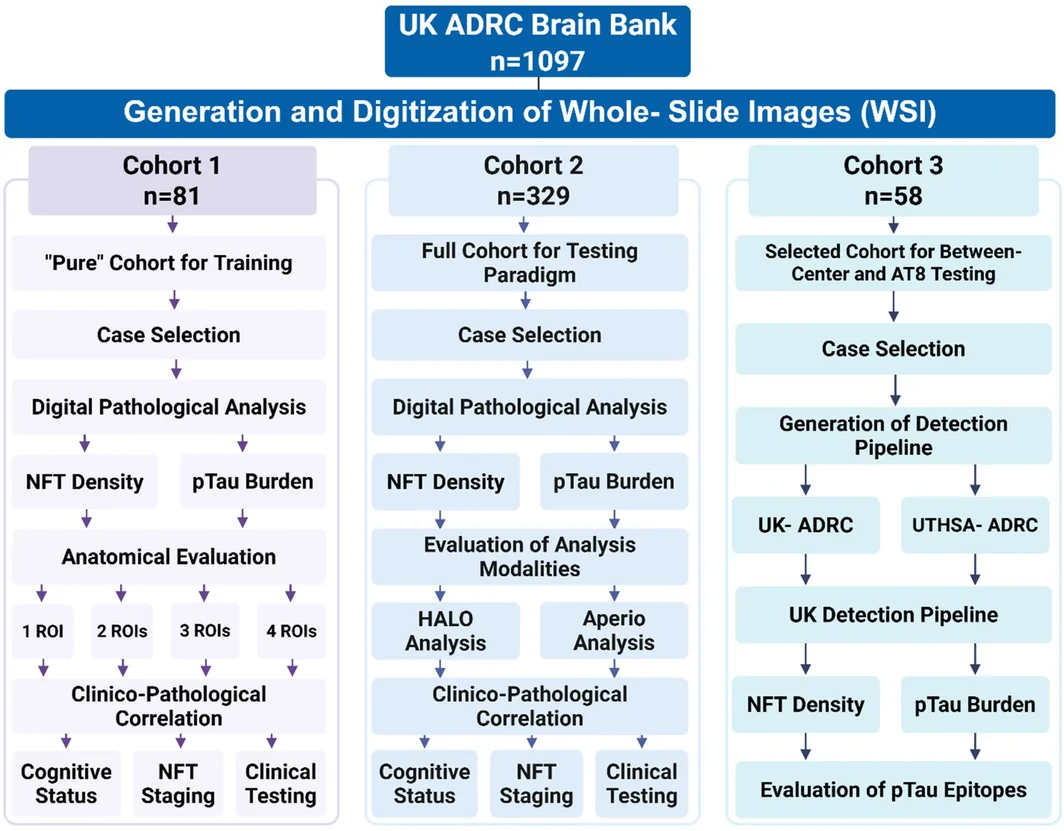
我们使用三个尸检队列子样本,评估不同 ADNC 分期的 pTau 病理数字化定量。在三个队列中,参与者涵盖 ADNC 严重程度的全部范围,包括 Braak 神经原纤维缠结 0–VI 期。符合预期的是,以末次 MMSE 评分评估的认知表现随神经病理严重程度增加而逐渐下降。载脂蛋白 E(APOE)基因型分布以 ε3/ε3 为主,但 ε4 等位基因在 Braak 神经原纤维缠结分期较高的个体中更常见。同样符合预期的是,共存的神经病理发现,包括脑血管病(CVD)和老年性海马硬化(HS‐A),在认知障碍较晚阶段更常见。各组死后间隔时间(PMI)相对一致,通常为 2 至 8 h(表 2、3、4)。
| 队列 1,n = 81 | |||||||||
|---|---|---|---|---|---|---|---|---|---|
| Braak 神经原纤维缠结分期 | 样本量 | 死亡年龄(平均值) | 其他 tau 蛋白病 a | 存在 LATE‐NC | 老年性海马硬化 | CVD | 最常见的 APOE 基因型 | MMSE(平均值) | PMI,h(平均值) |
| 0 | n = 2 | 78 | 0/2 | 0/2 | 0/2 | 1/2 | ε2/ε3 | 30 | 6.0 |
| 男(2) 女(0) | 1/2 | ||||||||
| I | n = 19 | 84 | 0/19 | 0/19 | 0/19 | 6/19 | ε3/ε3 | 29 | 4.8 |
| 男(6) 女(13) | 13/19 | ||||||||
| II | n = 20 | 84 | 0/20 | 0/20 | 0/20 | 6/20 | ε3/ε3 | 29 | 5.7 |
| 男(11) 女(9) | 12/20 | ||||||||
| III | n = 5 | 86 | 0/5 | 0/5 | 0/5 | 1/5 | ε4/ε4 | 28 | 5.6 |
| 男(2) 女(3) | 4/5 | ||||||||
| IV | n = 4 | 88 | 0/4 | 0/4 | 0/4 | 2/4 | ε4/ε4 | 25 | 3.3 |
| 男(3) 女(1) | 2/4 | ||||||||
| V | n = 10 | 84 | 0/10 | 0/10 | 0/10 | 7/10 | ε3/ε3 | 25 | 7.4 |
| 男(6) 女(4) | 6/10 | ||||||||
| VI | n = 10 | 71 | 0/10 | 0/10 | 0/10 | 3/10 | ε4/ε4 | 11 | 10.0 |
| 男(5) 女(5) | 7/10 | ||||||||
| N/A | n = 11 | 80 | 4/11 | 0/11 | 0/11 | 1/11 | ε3/ε3 | 26 | 7.76 |
| 男(4) 女(7) | 5/11 | ||||||||
缩写:CVD,脑血管病病理改变;HS, aging,老年性海马硬化;LATE‐NC,边缘系统为主的年龄相关性 TDP‐43 脑病神经病理改变;MMSE,简易精神状态检查;PMI,死后间隔时间。
其他 tau 蛋白病包括伴 tau 蛋白病变的非 ADNC 疾病,例如 Pick 病、其他 FTLD‐tau 亚型等。N/A 病例因 Braak 神经原纤维缠结分期缺失或无法分期,或存在路易体病理改变,未纳入 Braak 神经原纤维缠结分期分析。
| 队列 2;n = 329 | |||||||||
|---|---|---|---|---|---|---|---|---|---|
| Braak 神经原纤维缠结分期 | 样本量 | 死亡年龄(平均值) | 其他 tau 蛋白病 a | 存在 LATE‐NC | 老年性海马硬化 | CVD | 最常见的 APOE 基因型 | MMSE(平均值) | PMI,h(平均值) |
| 0 | n = 6 | 82 | 0/6 | 0/6 | 0/6 | 4/6 | ε3/ε3 | 26 | 6.3 |
| 男(5) 女(1) | 3/6 | ||||||||
| I | n = 50 | 82 | 0/50 | 4/50 | 3/50 | 17/50 | ε3/ε3 | 27 | 6.5 |
| 男(21) 女(29) | 31/50 | ||||||||
| II | n = 55 | 88 | 0/55 | 5/55 | 8/55 | 22/50 | ε3/ε3 | 25 | 6.7 |
| 男(30) 女(25) | 35/55 | ||||||||
| III | n = 28 | 88 | 0/28 | 6/28 | 3/28 | 14/28 | ε3/ε3 | 25 | 5.6 |
| 男(11) 女(17) | 15/28 | ||||||||
| IV | n = 20 | 88 | 0/20 | 1/20 | 1/20 | 13/20 | ε3/ε3 | 23 | 7.2 |
| 男(11) 女(9) | 10/20 | ||||||||
| V | n = 92 | 86 | 0/92 | 19/92 | 19/92 | 45/92 | ε4/ε4 | 18 | 6.8 |
| 男(54) 女(38) | 37/92 | ||||||||
| VI | n = 53 | 77 | 0/53 | 8/53 | 11/53 | 21/53 | ε4/ε4 | 10 | 9.2 |
| 男(27) 女(26) | 32/53 | ||||||||
| N/A | n = 25 | 77 | 7/25 | 1/25 | 1/25 | 4/25 | ε3/ε3 | 26 | 8.8 |
| 男(10) 女(15) | 8/25 | ||||||||
缩写:CVD,脑血管病病理改变;HS‐aging,老年性海马硬化;LATE‐NC,边缘系统为主的年龄相关性 TDP‐43 脑病神经病理改变;MMSE,简易精神状态检查;PMI,死后间隔时间。
其他 tau 蛋白病包括伴 tau 蛋白病变的非 ADNC 疾病,例如 Pick 病、其他 FTLD‐tau 亚型等。表中未列出的病例为 Braak 分期状态缺失或无法分期的病例。N/A 病例因 Braak 神经原纤维缠结分期缺失或无法分期,或存在路易体病理改变,未纳入 Braak 神经原纤维缠结分期分析。
| 队列 3;n = 58 | |||||||||
|---|---|---|---|---|---|---|---|---|---|
| Braak 神经原纤维缠结分期 | 样本量 | 死亡年龄(平均值) | 其他 tau 蛋白病 a | 存在 LATE‐NC | 老年性海马硬化 | CVD | 最常见的 APOE 基因型 | MMSE(平均值) | PMI,h(平均值) |
| 0 | ‐ | ‐ | ‐ | ‐ | ‐ | ‐ | ‐ | ‐ | ‐ |
| I | |||||||||
| II | n = 12 | 88.4 | 0/12 | 8/12 | 3/12 | 6/12 | ε3/ε3 | 24 | 6.2 |
| 男(6) 女(6) | 10/12 | ||||||||
| III | n = 11 | 87.8 | 0/11 | 5/11 | 1/11 | 8/11 | ε3/ε3 | 24.5 | 5.4 |
| 男(6) 女(5) | 4/11 | ||||||||
| IV | n = 11 | 87.3 | 0/11 | 5/11 | 4/11 | 7/11 | ε3/ε3 | 23.2 | 15.3 |
| 男(7) 女(4) | 7/11 | ||||||||
| V | n = 12 | 81.8 | 0/12 | 5/12 | 5/12 | 3/12 | ε3/ε3 | 17.2 | 11.5 |
| 男(7) 女(5) | 5/12 | ||||||||
| VI | n = 12 | 79.4 | 0/12 | 9/12 | 4/12 | 6/12 | ε4/ε4 | 6 | 6.8 |
| 男(5) 女(7) | 7/12 | ||||||||
缩写:CVD,脑血管病病理改变;HS‐aging,老年性海马硬化;LATE‐NC,边缘系统为主的年龄相关性 TDP‐43 脑病神经病理改变;MMSE,简易精神状态检查;PMI,死后间隔时间。
其他 tau 蛋白病包括伴 tau 蛋白病变的非 ADNC 疾病,例如 Pick 病、其他 FTLD‐tau 亚型等。
四个新皮质脑区的 pTau 病理数字化定量
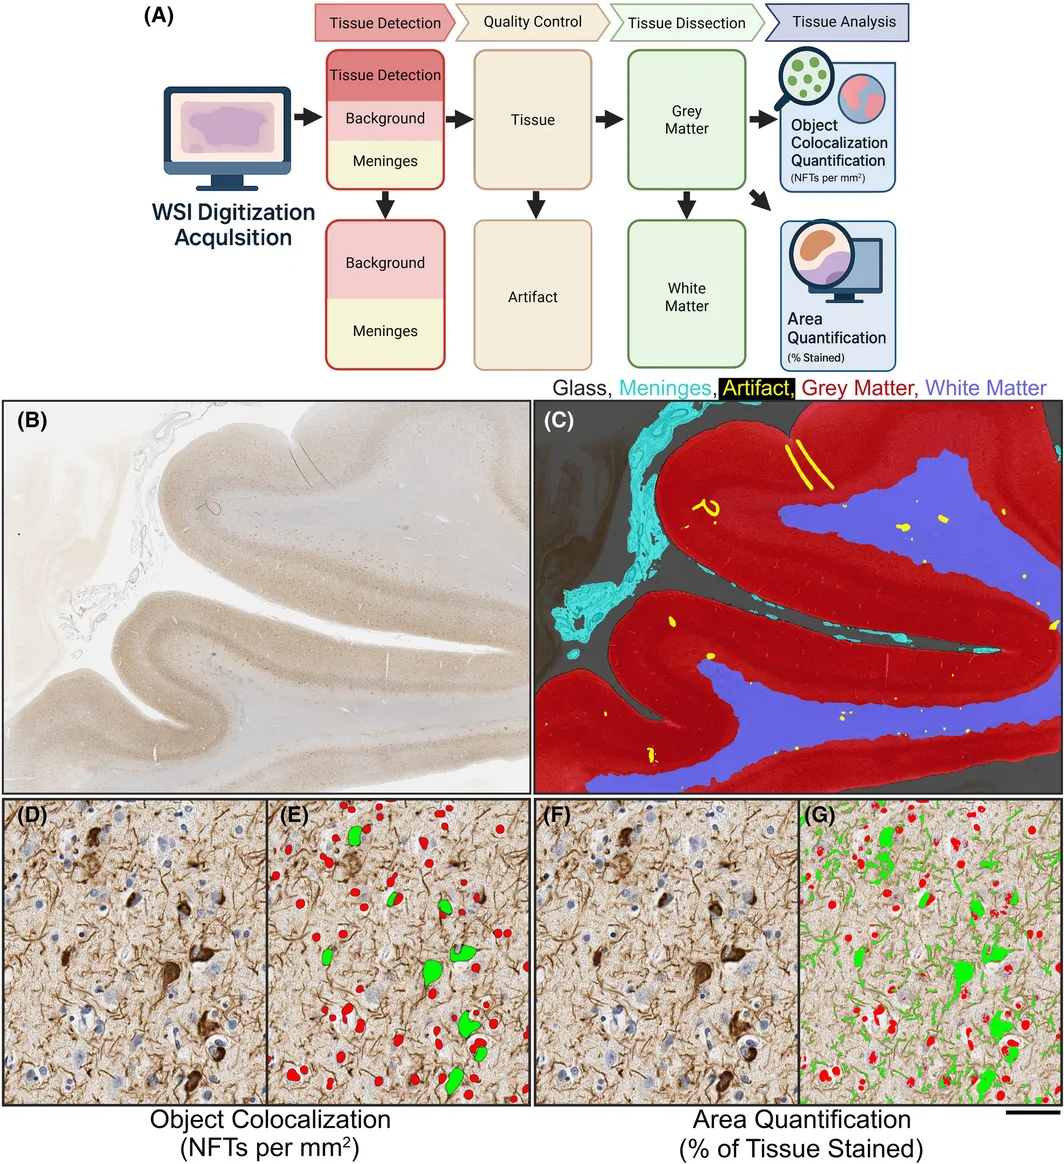
为建立标准化的数字神经病理工作流程,我们采用 HALO 和 Aperio 两种商用平台,对 PHF‐1 免疫染色切片实施并行定量流程。更新后的流程生成两种相互独立的定量输出:基于对象级检测的 NFT 密度(每 mm2 计数的 NFT 数),以及通过像素分类反映皮质灰质中 pTau 阳性百分比的 pTau 负荷(染色组织百分比)。这些分析在涉及 ADNC 的四个不同新皮质脑区进行,包括额中回、颞上回和颞中回、顶叶皮质以及枕叶皮质。AI 驱动的工作流程实现了灰质区域分割,并成功捕捉到与已知疾病分布相一致的区域病理模式(图 2)。
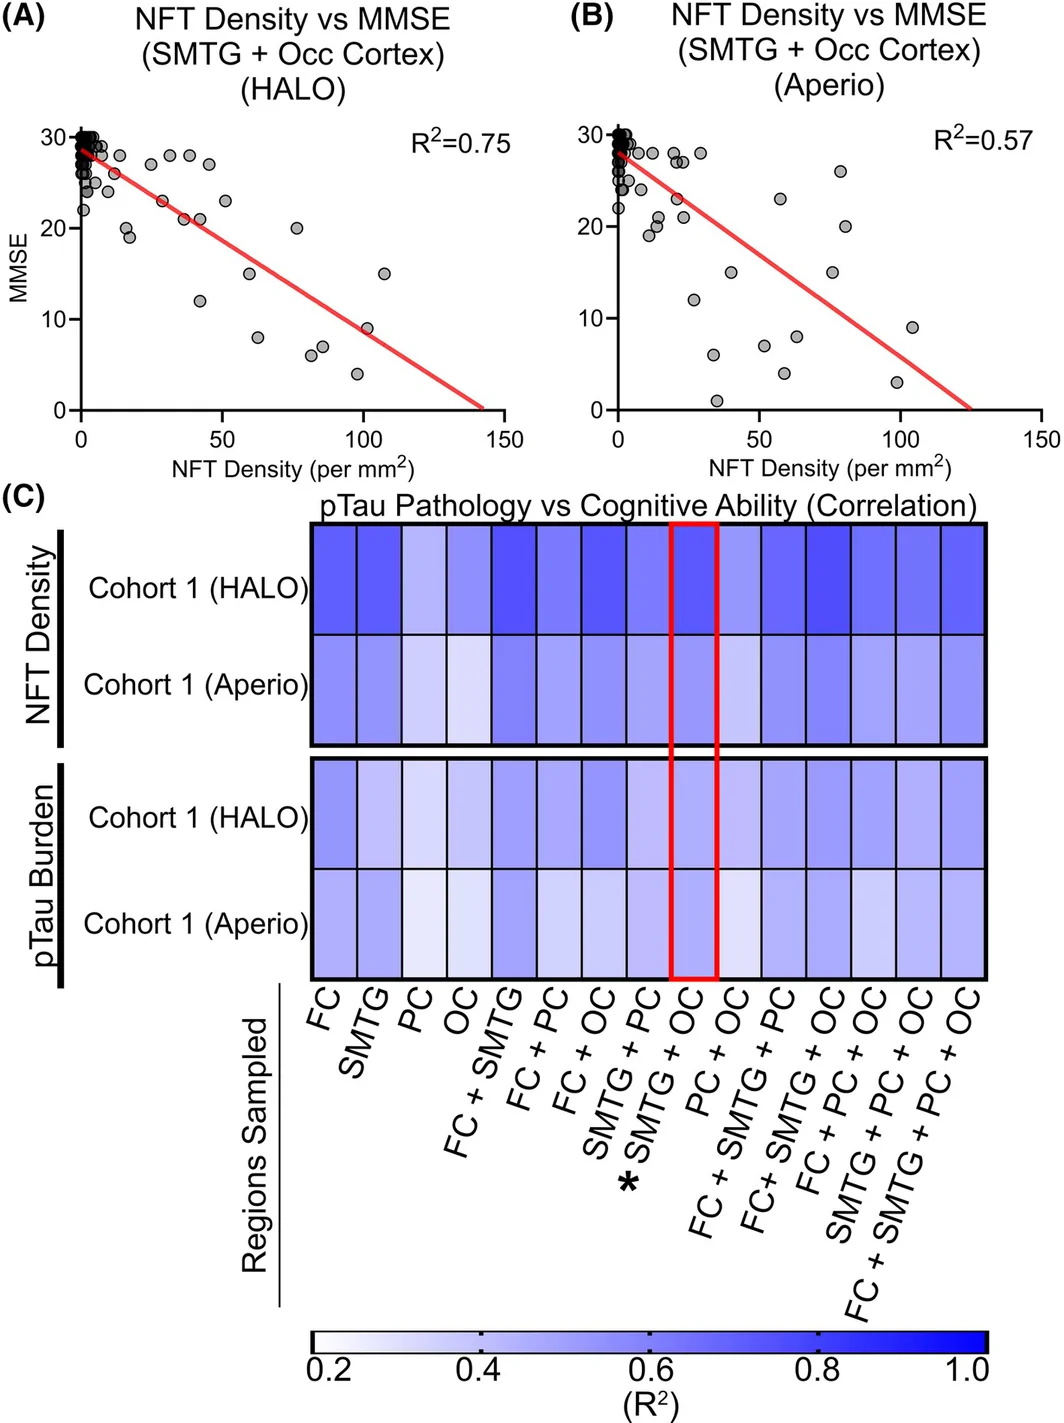
利用这些分割方法,我们评估了区域取样的 pTau 病理改变对认知状态的预测能力。对于队列 1 的每个病例,我们分析了末次 MMSE 评分与 HALO 和 Aperio 平台所得 NFT 密度及 pTau 负荷之间的关系(R 2)(图 3A)。我们考虑了一个、两个、三个或四个取样新皮质脑区的所有组合。如 R 2 值热图所示,多脑区取样与认知障碍的关联强于单脑区取样,而将颞上回和颞中回与枕叶皮质相结合时,表现最为一致(图 3A)。仅限于颞上回和颞中回及枕叶皮质的取样所得 R 2 值与全脑区模型相当,与这些区域在 Braak 神经原纤维缠结分期中已确立的重要性一致 [8]。这些发现在不同平台和不同定量指标间均保持稳定(图 3B、C)。
按临床状态分层的定量 NFT 密度,以提高分期准确性
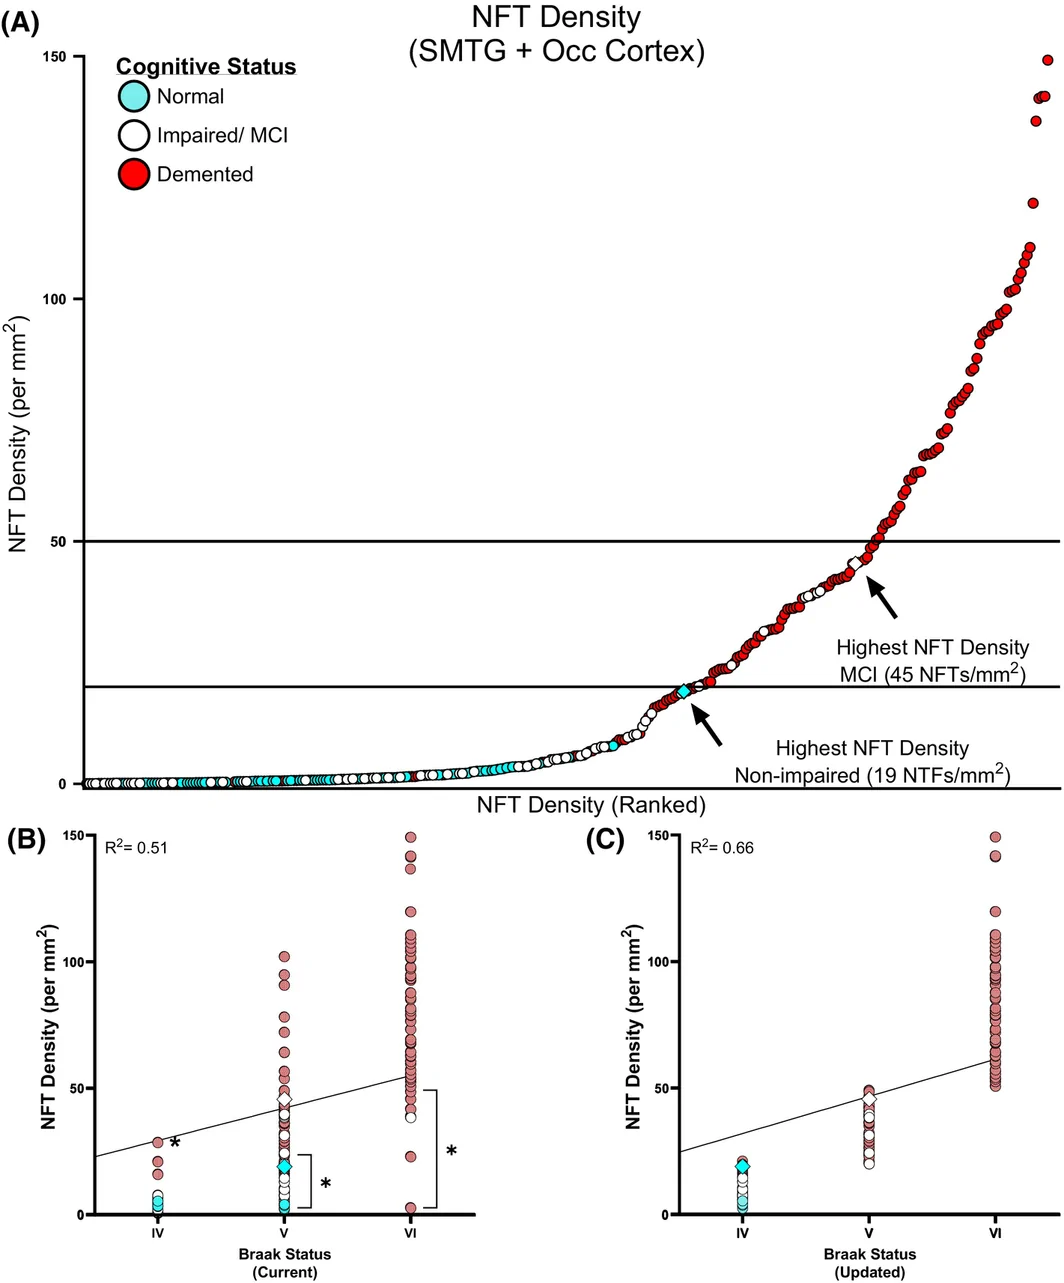
在确定两个新皮质脑区(颞上回和颞中回以及枕叶)的 NFT 密度与认知能力相关后,我们进一步更新了重度 ADNC 各分期的现有阈值。按 NFT 密度对病例排序,显示队列中存在显著的个体间变异(图 4A)。认知未受损个体中最高的 NFT 合计数约为每 mm2 19 个 NFT,而认知受损组的数值远高于每 mm2 45 个 NFT,由此形成了潜在的数据驱动阈值标准。我们进一步考察了数字化 NFT 定量与既往诊断的 Braak 神经原纤维缠结分期的一致程度(图 4B)。数字化 NFT 计数与原始分类及 Braak 神经原纤维缠结分类呈正相关(图 4C),更新后的模型显示出更好的线性关系(R 2 = 0.5140 对比 R 2 = 0.6582)。在更新后的模型中,若干病例被重新划入更高或更低分期,最终分期更好地反映了其定量负荷(图 4C)。这些结果提示,数字病理能够在传统分类评估的基础上进一步提高分辨能力和分期忠实度。
不同数字病理平台之间的 pTau 检测比较
在建立更新的工作流程和 Braak 神经原纤维缠结分期分类后,我们进一步评估了跨平台一致性。对队列 1 中每个病例及每个皮质脑区,分别使用 HALO 和 Aperio 软件独立定量 NFT 密度和 pTau 负荷。跨平台比较表明,所有脑区及指标均具有较高的线性相关性(R 2 = 0.91–0.98;图 5)。这种一致性证实,基于对象和基于面积的指标均能稳健地应对平台架构及算法实现中的方法学差异。
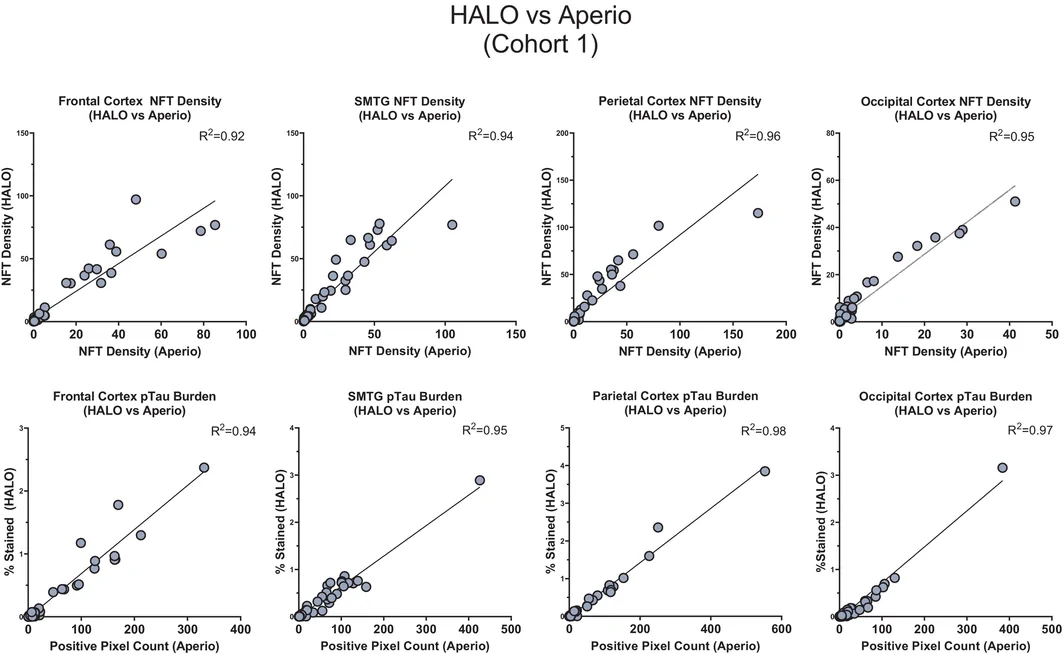
尽管生成的定量指标相当,HALO 与 Aperio 的分析工作流程仍存在显著差异。如 Neltner 等所报道,Aperio 需要手动放置 ROI 和进行质量控制,分析步骤为半自动化 [22]。对于 pTau 分析,单张切片的质量控制耗时可达 10 min,病理检测可达 30 min。相比之下,HALO 采用完全整合的 AI 流程,将组织检测、质量控制、灰质/白质分区和分析步骤自动化,通常每张切片不到 1 min 即可完成全部阶段。这些由自动化带来的效率提升,在保持分析忠实度的同时大幅减轻了使用者负担,使 HALO 特别适用于标准化和可扩展性至关重要的高通量或多中心研究(表 5)。
| 分类器/分析 | Aperio | HALO |
|---|---|---|
| 组织检测 | 10–30 s | 4 s |
| 在整个组织中手动放置 ROI | 作为 AI 流程的一部分自动完成 | |
| 质量控制 | 5–10 min | 17 s |
| 手动完成 | 作为 AI 流程的一部分自动完成 | |
| 组织分区 | N/A | 4 s |
| N/A | 作为 AI 流程的一部分自动完成 | |
| 对象共定位 | ~30 min | 15–60 s |
| 半自动;单独启动分析 | 作为 AI 流程的一部分或独立分析自动完成 | |
| 面积定量 | ~2 min | 15–60 s |
| 半自动;单独启动分析 | 作为 AI 流程的一部分或独立分析自动完成 |
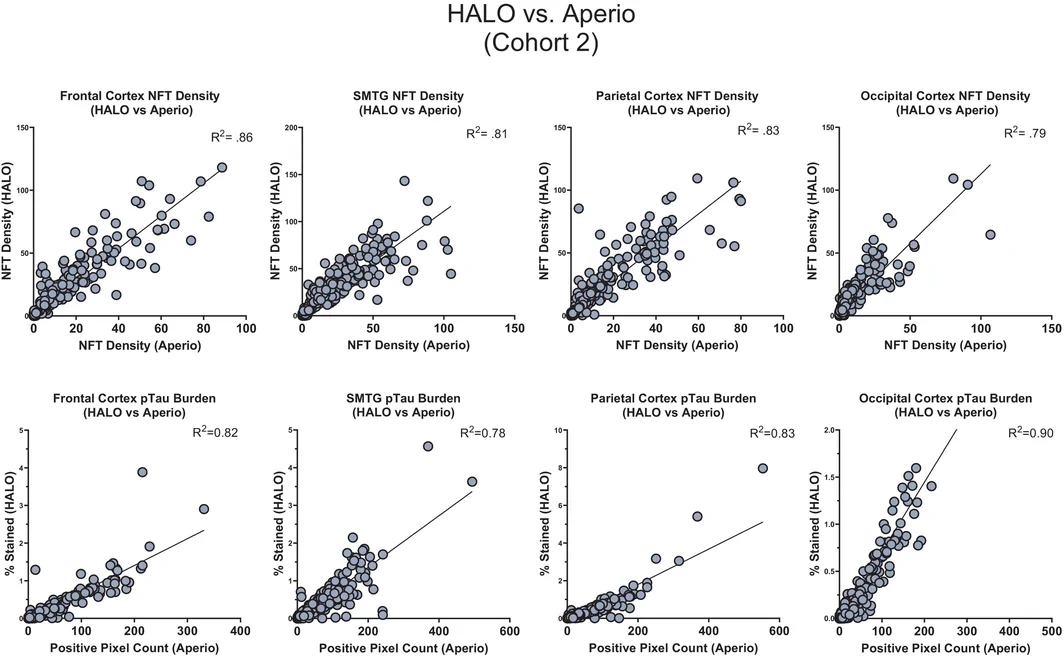
使用队列 1 完成 AI 检测流程的开发、训练和内部测试后,随后将自动化流程应用于队列 2,以评估其在更广泛病理改变中的可推广性。如前所述,队列 1 由“单纯”ADNC 病理病例组成,而队列 2 涵盖 UK‐ADRC 脑库的完整病例谱,包括混合及多重病理改变的病例。将检测流程应用于队列 2 后,获得了同样较高的相关系数(R 2 = 0.78–0.90),证实其能够在病理异质性更大的队列中检测 pTau 病理,结果也与 ADRC 自 2012 年以来获得的发现一致。这些发现共同证实了数字病理指标在不同软件环境间的可互换性,并支持将协调一致、高效的工作流程用于研究和临床应用的可行性(图 6)。
使用协调一致的流程评估独立中心间的 pTau 定量
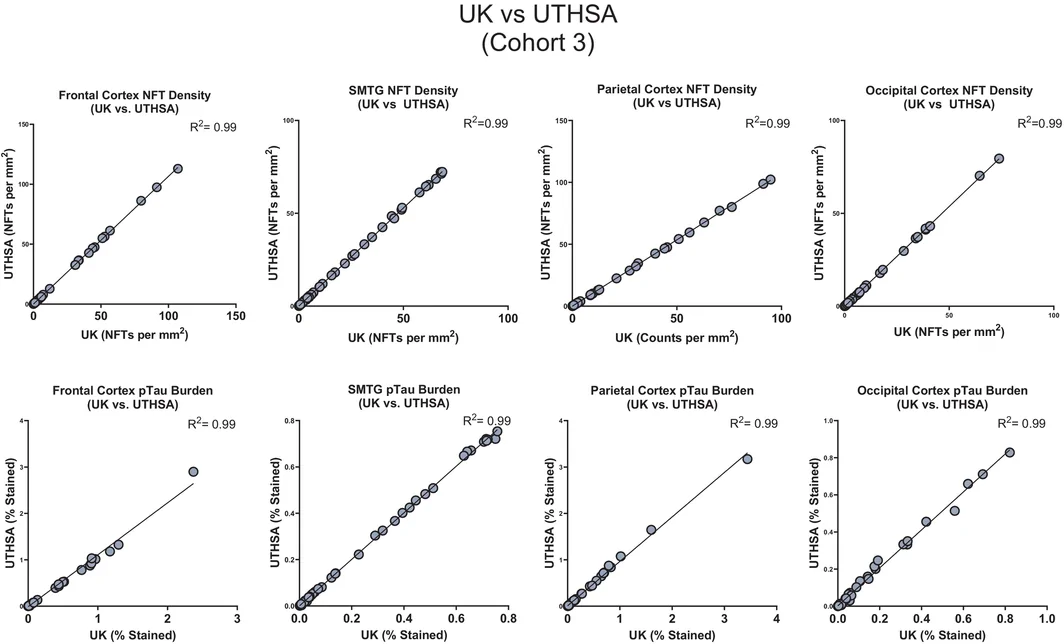
为确定数字化定量是否可以推广至不同中心(即不同大学的研究人员)并共享,我们对两个独立脑库(UK‐ADRC 和 UTHSA‐ADRC)的匹配病例应用了相同的成像和分析工作流程。每个中心独立计算了全部四个皮质脑区的 NFT 密度和 pTau 负荷。所有比较的中心间相关系数均超过 R 2 = 0.99,反映出中心间的定量结果几乎完全一致(图 7)。
不同 pTau 抗体(PHF‐1 和 AT8)的 pTau 病理定量评估
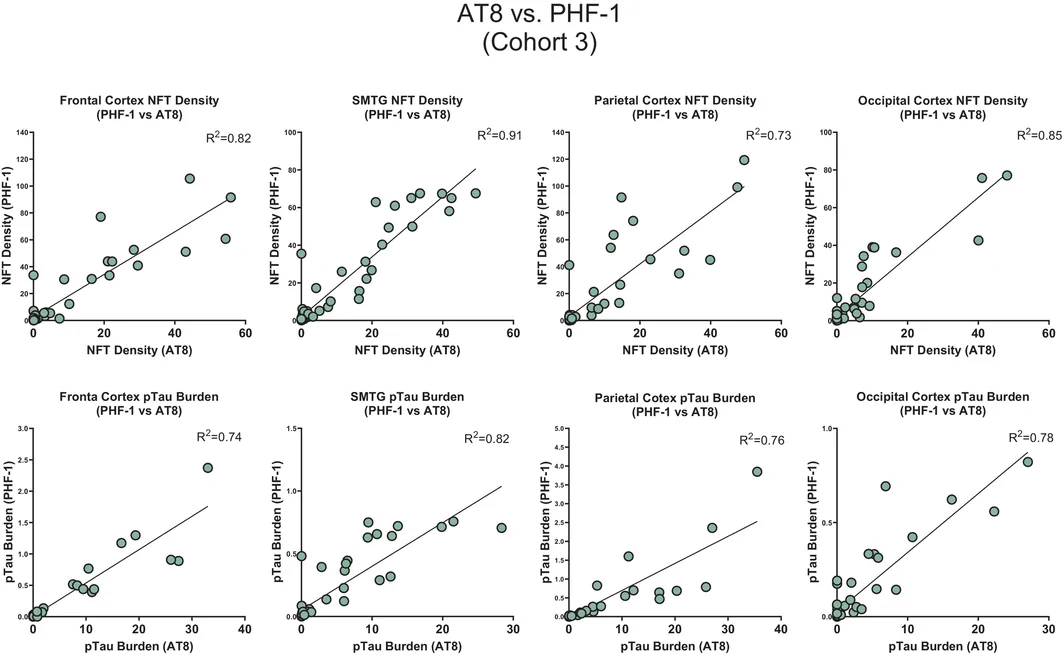
最后,我们比较了队列 3 中以 pTau 抗体 PHF‐1 和 AT8 染色的相邻切片的病理指标,考察数字化定量在不同 pTau 表位间是否保持一致。在全部四个皮质脑区中,NFT 密度和 pTau 负荷均呈较强相关性(R 2 = 0.73–0.91;图 8),其中颞上回和颞中回以及额中回的一致性尤其高。鉴于 AT8 抗体是研究及临床应用中最广泛使用的商用 pTau 抗体之一,这项验证具有高度相关性 [81, 82]。
讨论
本研究旨在整合高分辨率数字病理、AI 和临床指标,建立以数据为基础的 Braak 神经原纤维缠结 IV–VI 期分类框架,以支持重度 ADNC 的标准化诊断。通过自动化 WSI 分析和跨平台验证,我们生成了 pTau 负荷与 NFT 密度的定量指标,两者均与生前认知状态具有较强关联。这些指标使较高 Braak 神经原纤维缠结分期之间能够依据临床信息进行区分 [4, 5, 6, 7, 83]。尽管本项目总体上聚焦于重度 ADNC(Braak 神经原纤维缠结 IV–VI 期),但所用样本(尤其是队列 2)并不限于认知受损个体。更具体地说,整个队列中有 24% 的个体生前认知正常。因此,本方法提供了连续、定量的 pTau 负荷和 NFT 密度测量,可能有助于在保持 Braak 神经原纤维缠结分期既定解剖框架的同时,细化整个疾病谱的分类。重要的是,这些发现并不是提出修改 Braak 神经原纤维缠结分期体系本身,而是提供一种可重复、具有临床意义的辅助方案,补充现有框架并增强其临床和研究适用性。此外,将以临床数据为依据的定量阈值应用于 pTau 病理,有助于改善诊断分层,尤其是在半定量分期产生不一致的临床解释的病例中。这些阈值应理解为数据驱动的回顾性细化,旨在协调统一重度 Braak 神经原纤维缠结各期内的分类,并通过提高晚期 ADNC 的分辨能力和可重复性,提供一个有临床依据的定量框架,以补充传统 Braak 神经原纤维缠结分期。在这种情况下,数字化衍生指标为评估疾病严重程度提供了更以数据为基础的依据。
本研究推荐的最佳解剖取样区域,与 Alafuzoff 等详细描述的 BrainNet Braak 分期一致 [8, 84]。因此,对颞上回和颞中回以及枕叶皮质的 pTau 病理进行定量,获得了稳健的临床病理关联 [4, 5, 6, 7, 83]。这些区域已包含在标准 ADRC 取样方案中,因而无需额外获取组织或进行特殊处理 [79]。这种与既定工作流程的一致性,有利于将提出的数字化指标整合到常规神经病理评估和多中心研究中。
我们更新后的方法依据整合病理和认知数据的 AI 衍生指标,提出了用于 ADNC 中晚期 pTau 病理分类的定量界值。虽然近期研究已证实,基于 HALO 和 QuPath 的 pTau 病理数字化定量具有实用价值,但本研究特别强调数字病理、临床数据与 Braak 神经原纤维缠结分期之间的相互关联 [33, 85, 86, 87]。本研究的一个基本假设是,疾病的病理分级应反映临床结局。更具体地说,最严重的疾病等级应能可靠地反映临床损害。虽然这通常适用于 ADNC,但相关病理分期的标准仍有待细化(例如,参见文献 [3, 78])。
尽管 Braak 神经原纤维缠结分期仍是描绘 pTau 病理层级性进展的基础体系,但它受到有序分类结构、解释变异以及与临床结局相关性不完全的限制 [88, 89, 90]。通过整合基于 DL 的定量与纵向认知测量,我们的分析改善了这些不足。这种联合方法增强了临床病理相关性,并减少了分类评估固有的变异,尤其是在疾病晚期。
本研究的一个关键优势在于其跨机构的可重复性和可扩展性。以往,抗体选择及区域取样的实验室间差异阻碍了 ADNC 分期的可比性。除了机构间方法学不一致,免疫组织化学所用 pTau 抗体选择的差异也会带来显著变异。然而,全切片成像和基于 AI 的组织分割技术的进步,如今使分类器模型和定量参数能够直接共享,而直到不久前,这在技术上仍难以实现。使用商用数字病理平台、标准化分类器架构和易于共享的分析流程,使各中心能够标准化地复现定量输出,不同中心及染色方案间数据的高度一致性证明了这一点。然而,这些数据也凸显了我们自身存档的 Braak 神经原纤维缠结分期数据在临床病理相关性方面的不足。尽管如此,本研究提供了概念验证,表明标准化的 AI 检测流程可以方便地在外部环境中跨数字平台部署和实施。一旦使用单一中心的组织完成训练,这些流程即可通过直接文件传输或 Github 等公共代码库以电子形式分发,并且无需重新训练或针对中心进行优化即可使用,从而支持在神经病理学中更广泛采用协调一致的分析框架这一目标。
Braak 神经原纤维缠结分期一直是衡量遗忘型痴呆中 pTau 神经原纤维病理进展的主要框架。然而,近期的多中心评估,尤其是 BrainNet Europe 联盟的评估显示,即使在共识方案指导下,不同机构的分期结果仍存在相当大的解释变异 [68, 84, 91]。Alafuzoff 等(Heiko Braak 博士为共同作者)提出的、可视为 Braak 神经原纤维缠结分期“金标准”的方案,根据 pTau 病理在特定新皮质脑区(枕叶/纹状皮质和颞叶新皮质)的分布划分 IV–VI 期。该体系对 AT8 免疫反应阳性的神经网丝采用“+++”“++”“+”或“−”的严重程度评分进行操作性判定 [8],因此强调的是一种有别于 NFT 本身的 pTau 病理形式。相比之下,2012 年 NIA‐AA 共识 ADNC 诊断指南的规定明显较为宽松,允许采用银浸染色或 pTau 免疫组织化学来确定 Braak 神经原纤维缠结分期 [2]。综合来看,这些因素突出了 Braak 神经原纤维缠结分期框架的一项主要实际局限:它依赖半定量、受解剖范围约束的分类,导致分期忠实度存在显著变异,尤其是在临床意义最大的晚期阶段。因此,需要更具可重复性、定量性并以认知状态为依据的方法,以数字病理及基于机器学习的 pTau 病理测量补充传统解剖层级。我们的研究通过在分类式解剖分期中增加连续的、按区域取样且经临床验证的数字化指标来回应这些需求,从而细化晚期分类,同时保持与原始 Braak 神经原纤维缠结分期框架在概念上的连续性。
本研究还表明,协调一致的 AI 病理工作流程能够跨机构、成像平台和 pTau 抗体有效实施。在脑库和病理中心之间部署分类器模型与定量参数的能力,代表了可重复性方面的重要进步,使前所未有规模的多中心研究成为可能。在 ADRC 网络中,这类工作流程促进了不同尸检队列之间的标准化,并支持数字病理数据集的大规模汇聚。这项工作还强调了将 AI 衍生指标纳入正式神经病理分期指南的可行性。随着 NIA‐AA 等相关工作致力于细化 ADNC 诊断框架,纳入以认知信息为依据的定量指标,可能有助于减少评估者间变异,并加强临床与病理之间的联系。我们的方法以 Braak 神经原纤维缠结分期的概念基础为依托,通过一致且透明的测量,提供更高的分辨能力和更好的临床可解释性。
虽然 AT8 和 PHF‐1 两种抗体均可检测病理性 pTau 聚集物,但它们结合不同的 tau 磷酸化表位,因此标记的是不同分子状态的 pTau 病理改变 [81]。更具体地说,AT8 识别 tau 蛋白氨基酸残基丝氨酸202/苏氨酸205 的磷酸化,这通常被认为是早期构象变化的标志,在前 NFT 及神经网丝 pTau+ 结构中含量丰富 [80, 81, 82, 92, 93]。相比之下,PHF‐1 识别 tau 蛋白氨基酸残基丝氨酸396/丝氨酸404 处的磷酸化表位,通常与更成熟的 NFT 相关 [81, 82, 93, 94, 95, 96, 97]。这些表位特异性亲和力导致不同脑区和疾病分期的染色模式与信号强度存在差异,可能影响仅基于单一抗体类型训练的数字检测算法。因此,要协调统一不同队列和平台的输出,就必须仔细验证抗体特异性分类器和阈值参数,以确保无论采用何种免疫标记策略,都能准确且可重复地定量 pTau 病理。我们的结果表明,AT8 和 PHF‐1 免疫标记的结果可以通过系统化方式实现协调一致。
本研究的一些局限值得考虑。MMSE 检查虽然应用广泛,且比将“痴呆/无痴呆”二分(或采用 0–3 级临床痴呆评定量表)更精细,但其对整体认知的测量仍不完善,可能忽略与区域 pTau 负荷更密切对应的特定认知领域缺损 [98, 99]。未来研究应纳入综合性神经心理测验组合,以更好地捕捉有意义的临床病理关系。此外,虽然 PHF‐1 与 AT8 抗体的数字化读出总体一致,但表位结合和染色强度的细微差异仍可能给跨中心比较带来变异。另外,由于本项目纳入的 WSI 几乎涵盖了 UK‐ADRC 生物样本库自 2011 年以来的所有病例,组织学染色存在一定变异不可避免。再者,我们的取样集中于新皮质脑区,未包括皮质下或异型皮质区域,而这些区域可能对理解非典型或早发型表型至关重要 [14, 80, 100, 101]。虽然 HALO 和 Aperio 软件等商用数字病理工具已推动显著进展,但其自身也存在不足。它们仍受许可限制、高昂成本以及长期以来有限的跨机构兼容性制约。这些障碍促成了联邦式、开放获取基础设施的发展,例如脑数字切片档案库(BDSA;NIH 资助项目 U24 NS133945 和 U24 NS133949),该基础设施促进跨机构协作切片标注、AI 模型训练和协调一致的数据共享 [1, 102]。我们与这一计划的整合,反映了开放框架作为可扩展、可重复且公平的神经病理学必要基础设施,正受到越来越多的重视。这些努力与神经影像和基因组学领域的成功举措并行,在这些领域,协调统一的数据存储库已推动诊断和生物标志物发现的创新。
本研究通过推进一种将 pTau 定量与认知状态相联系、可扩展的协调一致数字病理模式,为持续推进神经病理评估现代化作出贡献。通过使 AI 驱动流程能够部署于多个中心和软件平台,我们的方法支持正在形成的可互操作、以临床为依据的分析标准。重要的是,我们的发现验证了共享分类器模块和经区域优化的取样能够产生可重复的输出,以改进疾病分类,为实施多模态分期体系向前迈进一步。在这一不断演进的领域中,数字病理是现代神经病理的关键要求,支持精准表型分析、跨学科洞见以及诊断忠实度。本研究将数字组织学与临床数据整合,为这些努力作出贡献,进一步推动该领域朝着全面、标准化且具有临床可解释性的神经退行性疾病评估发展。
结论
本研究表明,定量数字病理与临床认知数据整合后,可改善重度 ADNC 的 Braak 神经原纤维缠结分期,并使其更为合理。通过跨机构部署协调一致的 AI 驱动流程,我们获得了可重复的 pTau 病理指标,这些指标与认知障碍的相关性更强,并能更好地区分重度 Braak 神经原纤维缠结各期。这些结果强调了以认知信息为依据的数字化分期的可行性,并支持向标准化、可扩展的神经退行性疾病诊断方法转变。
- Problem: semi-quantitative ADNC frameworks discriminate poorly at advanced stages — severity varies widely within a category and some cognitively unimpaired people are classed as severe ADNC. Goal: Braak NFT stage V should always be impaired (MCI or dementia) and stage VI always demented.
- Methods: 329 University of Kentucky ADRC autopsies (all with clinical evaluation within 2 years of death); PHF-1 IHC on four neocortical regions; AI analysis of whole-slide images for object-based NFT density (per mm²) and pixel-based pTau burden (% stained), comparing HALO vs Aperio and PHF-1 vs AT8.
- Results: NFT density in two regions (SMTG + occipital) correlated well with cognition; the highest summed count in non-impaired cases was ~19 NFTs/mm², while impaired cases extended well above 45/mm². Refined cut-points reclassified 17% of cases and improved linearity against Braak staging (R² 0.5140 → 0.6582).
- Portability: HALO’s fully automated pipeline often runs in under 1 min per slide (Aperio up to ~40 min with QC); the same algorithms applied at UT San Antonio gave near-perfect agreement; PHF-1 vs AT8 on adjacent sections R² 0.73–0.91. Tables 1–5 and Figures 1–8 included.
Scope: PMC open-access full text (CC BY 4.0) — abstract, introduction, methods, results, discussion and conclusion, Tables 1–5 and Figures 1–8 with captions. Author contributions, funding, conflicts, ethics statements, supporting information and references are not included.
Abstract
Alzheimer's disease neuropathological changes (ADNC)—operationalized with semi‐quantitative parameters—represent the consensus‐based gold standard for diagnostic evaluation of disease severity. Although useful, ADNC diagnostic frameworks have limitations, particularly in advanced disease stages where pathological severity varies widely within a given diagnostic category. Further, some individuals lacking cognitive impairment are inappropriately categorized as having severe ADNC. In this study, quantitative pathology metrics and alternative tissue sampling schemes were integrated with data about premortem cognitive status, in order to derive clinically informed neuropathologic diagnostic thresholds. Specific goals of the current study were to generate data‐driven, standardized diagnostic cut‐points, with the most severe stages of ADNC having consistent implications: Braak neurofibrillary tangle (NFT) stage V cases being always impaired (MCI or demented) and Braak NFT stage VI cases being always demented. Utilizing whole‐slide imaging and AI‐based image analysis, object‐based (NFT counts) and pixel‐based (phosphorylated tau [pTau] burden) quantifications were compared across neocortical regions in three subsamples of cases from the University of Kentucky ADRC autopsy cohort (n = 329, all with clinical evaluations within 2 years of death). We also compared between HALO‐ and Aperio‐based platform results, and between AT8 and PHF‐1 pTau antibodies. Applying refined thresholds enabled reclassification of cases previously misaligned with their digitally determined appropriate status: 17% of cases were thus reclassified. The use of commercially available software, standardized classifier architectures, and interoperable analysis pipelines facilitated scalable and reproducible digital quantification. Cross‐institutional validation at University of Texas San Antonio, with the same algorithms applied in both research centers, confirmed near‐perfect agreement of pathology counts, underscoring shareability and the feasibility of harmonized digital workflows for collaborative research and diagnostic purposes. These findings support the integration of quantitative digital pathology into standard neuropathological protocols and provide a scalable model for future multi‐site studies. Enabling comparisons of analytical platforms, pTau antibodies, and anatomical sampling strategies, an updated workflow demonstrated high reproducibility and consistent clinical‐pathological correlations.
INTRODUCTION
The hallmarks of Alzheimer's disease neuropathologic change (ADNC) are β‐amyloid peptide (Aβ) deposition, neuritic amyloid plaques, and neurofibrillary tangles (NFTs), each categorized using semiquantitative metrics, according to the National Institute on Aging–Alzheimer's Association (NIA‐AA) consensus‐based guidelines [1, 2]. Of the ADNC pathological hallmarks, NFTs (intraneuronal inclusions composed of phosphorylated tau, or pTau) have the strongest association with cognitive impairment [3]. Braak NFT staging constitutes a highly ordinal scale (with seven stages, ranging from stage 0 to stage VI), indexing the spatial distribution of NFTs in the brain [4, 5, 6, 7, 8]. Braak NFT staging gauges the stereotypic expansion of pTau pathology from the transentorhinal cortex in isolation (Braak NFT stage I) through limbic regions and ultimately into many neocortical regions in Braak NFT stage VI. In contrast to earlier stages, Braak NFT stages IV through VI are often accompanied by measurable clinical decline [9, 10, 11]. The methodology of Braak NFT staging has evolved from the use of silver stains to pTau immunohistochemistry, with the protocol described by Alafuzoff et al., now serving as the standard for Braak NFT staging [8]. While Braak NFT staging remains a valuable tool for describing (indeed, defining) ADNC severity, individuals assigned to the same Braak NFT stage may exhibit widely varying levels of cognitive function and pathological burden [11, 12, 13]. This imperfect clinicopathological correlation decreases the interpretive utility of Braak NFT staging. The goal of the current study is to tie the pathologic diagnosis more closely to the severity of clinical impairment and also to standardize the use of digital pathology for the purposes of diagnosing ADNC.
Several other limitations of Braak NFT staging have become increasingly apparent in the modern era of digital and quantitative neuropathology. The system of Braak NFT staging is inherently semi‐quantitative, describing the anatomical extent of NFT deposition but not its absolute burden. As a result, two cases with identical Braak NFT staging may differ substantially in pTau pathologic load [14, 15]. Additional variability arises from differences in staining protocols, antibody epitopes, and imaging platforms, all of which may influence the threshold for what constitutes “positive” pathology and ultimately how patients are diagnostically categorized [16]. To help address these limitations, several research groups and consortia have harmonized pTau immunohistochemistry protocols, established standardized regional sampling templates, and introduced complementary criteria to enhance reproducibility [8, 17, 18, 19, 20]. Further, an increasing number of neuropathologists have augmented traditional Braak NFT staging with digital quantification of pTau pathology [14, 21, 22, 23, 24, 25, 26].
The increasing adoption of digital pathologic methods represents a shift from largely semi‐quantitative, anatomically dichotomized staging toward more rigorously quantitative metrics of pathological severity to enable improved alignment between neuropathological assessment and measurable cognitive outcomes. However, to date, digital pathological methods have not been leveraged for data‐driven refinement of the existing semiquantitative metrics. More specifically, no quantitative method currently exists to delineate between stages of severe ADNC as set forth by the NIA‐AA guidelines, based on a developmental model that incorporates digital pathology and clinical data.
Digital pathology is transforming traditional, observer‐dependent evaluations into a more quantitative discipline by digitizing tissue slides and enabling advanced computational analyses [27, 28, 29, 30, 31, 32, 33]. Central to this transformation is the integration of artificial intelligence (AI), particularly machine learning (ML) and deep learning (DL), which have become highly useful for modern pathological workflows. AI algorithms now automate tasks such as image segmentation, feature extraction, and classification, thereby enhancing both diagnostic accuracy and operational efficiency [34, 35, 36, 37, 38]. For neuropathologists, tools such as PathoFusion utilize convolutional neural networks to analyze whole‐slide images (WSIs), detecting subtle but quantifiable histomorphologic features relevant to neuropathology [38, 39, 40, 41, 42, 43]. In addition to identification and quantification of pathologic phenomena related to neurodegenerative diseases, these systems also support tumor grading and multimodal integration with neuroimaging and genomic data for more personalized diagnostics [37, 40, 44, 45, 46, 47, 48].
Recent developments in AI‐driven tools and commercial platforms such as HALO, Aperio, and QuPath now enable high‐throughput, pixel‐level segmentation of pathology across entire slides [49, 50, 51, 52]. Deep learning architectures including U‐Net, SegNet, and fully convolutional networks (FCNs) produce robust metrics for pTau burden, pathology density, and spatial clustering, which together provide robust, comprehensive, and reproducible profiles (quantitative and qualitative) of disease‐related pathologies [53, 54, 55, 56, 57].
The University of Kentucky Alzheimer's Disease Research Center (UK‐ADRC) has incorporated digital pathological techniques since 2012 as part of the routine evaluation of all autopsies, following a published workflow [9, 22]. Through early implementation of WSI and computational analysis, the UK‐ADRC has leveraged image‐derived metrics as part of routine neuropathologic evaluation, facilitating a shift toward integrating quantitative WSI‐based pathologic readouts [22, 58, 59]. In addition to a number of relevant research papers that have resulted from these resources [59, 60, 61, 62, 63, 64, 65, 66], the virtual biobank has facilitated diagnostic pathology at the UK‐ADRC and has been useful for building a federated digital slide archive. However, broader adoption across institutions remains limited by the lack of infrastructure for sharing WSIs and analysis pipelines. Furthermore, the widely used Aperio‐based software for digital analyses is in the process of being phased out by the manufacturer.
To overcome these barriers, we generated, trained, and tested commercially available HALO digital pathology software to enable cross‐institutional sharing of image data and analysis modules. Standardized pipelines, including trained tissue classifiers, object detection algorithms, and analysis parameters were shared with the University of Texas Health Science Center at San Antonio (UTHSA) ADRC, enabling standardized quantification of pTau pathology across sites. This work reflects a broader evolution in the field, from anatomy‐based, semi‐quantitative staging, toward a more quantitative (clinical and pathological) data‐driven system, and underscores the critical role of digital neuropathology in modernizing ADNC assessment [22, 67, 68]. An overarching goal of this study was to develop standardized, quantitative, shareable, and clinically relevant thresholds for distinguishing Braak NFT stages IV–VI, informed by both digital pathology metrics and antemortem cognitive data.
METHODS
Research participants, subsamples, inclusion, and exclusion criteria
Samples were acquired from the UK‐ADRC autopsy cohort, a community‐based cohort drawing from the Lexington, Kentucky area. The cohort's demographics, recruitment strategies, and other pertinent details have been previously described [69, 70, 71]. The large majority of included participants were recruited into the study while neurologically normal and followed longitudinally to autopsy. Cases included in the study were characterized based on clinical presentation and cognitive abilities (i.e., “normal,” “impaired,” “demented”) at an ADRC consensus conference that included primary input by clinicians, as previously described [72, 73, 74, 75, 76, 77].
Three subsamples were derived from the overall UK‐ADRC cohort, to support training, validation, and cross‐center standardization analyses. Cohort 1 (n = 81) comprised “pure” ADNC cases, specifically excluding individuals with coexisting pathologies such as dementia with Lewy bodies (DLB), limbic‐predominant age‐related TDP‐43 encephalopathy neuropathologic changes (LATE‐NC) and tauopathies such as corticobasal degeneration (CBD), Pick's disease, progressive supranuclear palsy (PSP), or other subtypes of frontotemporal lobar degeneration with pTau inclusions (FTLD‐tau). Inclusion in Cohort 1 also required availability of Mini‐Mental State Examination (MMSE) scores obtained within 2 years of death, ensuring reliable clinicopathological correlation. Cohort 2 (n = 329) served as the primary test subsample, selected using similar exclusion criteria and temporal constraints to Cohort 1, and similarly limited to cases with MMSE data within 2 years of death. However, unlike Cohort 1, Cohort 2 did not exclude cases with comorbid pathology (DLB, LATE‐NC, FTLD‐tau, etc.). Cohort 3 (n = 58) included approximately 12 cases per Braak NFT stages (II–VI) that were randomly sampled to ensure balanced representation across disease stages. This third cohort was used to assess detection methods across anatomical regions and in varying histological stains. Together, these cohorts enabled systematic training, validation, and between‐center comparison of digital neuropathological assessment paradigms.
Tissue preparation and immunohistochemistry
Immunohistochemistry and analysis for this study was completed on four neocortical regions: middle frontal gyrus (MFG, Brodmann area [BA] 9), superior and middle temporal gyri (SMTG, BA 21/22), inferior parietal lobule (BA 40), and occipital striate cortex (BA 17/18/19). These regions of neocortex were routinely sampled at autopsy. Immunohistochemistry for pTau was performed on 8 μm‐thick sections from paraffin‐embedded human autopsy brain sections using antibodies against PHF‐1 antibody (mouse monoclonal, 1:1000, courtesy of the late Dr. Peter Davies) and AT8 (1:1000, Thermo Fisher Scientific Cat# MN1020, RRID: AB_223647). Slides were first deparaffinized in xylene and rehydrated through a graded ethanol series (100%, 95%, and 80%) to distilled water. Antigen retrieval was conducted in Dako Target Retrieval Solution, low pH (TRS Lo, pH 6; Cat. #GV805) at 95°C for 6 min, followed by a 10‐min cooldown at room temperature. Slides were rinsed in running distilled water for 10 min and equilibrated in 1× TBS on a shaker for 5 min. Endogenous peroxidase activity was quenched by incubation in a solution of 20% methanol and 3% hydrogen peroxide for 30 min. Following an additional rinse in distilled water and a 5‐min TBS wash, sections were blocked in 5% non‐fat dry milk prepared in 1× TBS for 1 h at room temperature. Primary antibody incubation was carried out overnight at 4°C in a humidified chamber. The following day, sections were washed twice in 1× TBS (5 min each) and incubated for 1 h at room temperature with a biotinylated horse anti‐mouse secondary antibody (Vector Laboratories, Cat #BA‐2000, 1:250). After two additional TBS washes, slides were treated for 1 h with the VECTASTAIN® Elite ABC Peroxidase kit (Vector Laboratories, Cat #PK‐6100), prepared according to manufacturer instructions. Visualization was achieved using DAB chromogen solution (DAKO, Cat #K3468), applied dropwise until adequate signal development was observed. Slides were then immersed in deionized water to halt the reaction, washed for 5 min, and counterstained with IMCB Harris Hematoxylin (#HH‐160). Following another rinse in deionized water, slides were dehydrated through ascending ethanol concentrations (80%, 95%, and 100%), cleared in xylene, and coverslipped using a permanent mounting medium. Slides were cured for 48 h prior to WSI scanning. Following staining, WSIs were digitized using a Leica/Aperio AT‐2 Scanner at 40× magnification.
At the UK‐ADRC, Braak NFT staging has historically been diagnosed using methodology grounded in evolving consensus‐based guidelines. The current study focused on Braak NFT stages IV through VI, which have traditionally been differentiated at the UK‐ADRC based on the density of pTau NFTs in the neocortex, identified using the PHF‐1 pTau antibody. Although consensus‐based methods focus on the striate and temporal lobe neocortices for differentiating severe Braak NFT stages, staining in the MFG and parietal cortex has also factored into the diagnostic thresholding rubric at the UK‐ADRC, although there was not a prior specific cutoff to differentiate Braak NFT stages IV or V [2, 4, 5, 6, 7, 8, 78, 79, 80].
Analysis pipeline using Aperio software
As described in detail previously [22], the Leica/Aperio “Genie” image analysis software system (referred to here as “Aperio”) was used to assess pTau pathology within selected grey matter regions of interest (ROIs). Full‐slide quantification was initially avoided because of excessive variability in grey‐to‐white matter ratios across cases and prohibitive processing time; rather, fixed‐size square ROIs (10 ROIs per slide, each 4 mm2) were placed throughout grey matter areas that displayed consistent pathological signal intensity [22] (Figure S1A, Supporting Information). ROIs were distributed across the tissue to maximize spatial separation while avoiding overlapping and regions with suboptimal staining or structural distortion. Non‐neural elements such as tissue folds, processing debris, and meningeal vasculature were manually excluded from the analysis using negative selection tools (Figure S1A). ROIs were manually placed according to a sampling strategy rather than by true random selection. This approach allowed ROIs to be distributed broadly and consistently across the available grey matter to enhance reproducibility, while avoiding staining artifacts and tissue distortion that could confound quantitative analysis.
Quantification of NFT density using the Aperio software was then conducted using a modified nuclear detection algorithm optimized for pTau (PHF‐1 antibody) immunoreactivity. A systematic evaluation of minimum nuclear size thresholds was used to minimize the inclusion of non‐NFT elements, such as glial nuclei or background signal, while preserving true positive detection. To generate a widely applicable method of analysis, multiple threshold conditions were tested across a representative case subset, and algorithmic outputs were compared to manual annotations to identify the optimal detection threshold. Final analyses were performed across the grey matter ROIs, with NFT density calculated as the total number of detected NFTs normalized to total analyzed tissue area (Figure S1C). Additionally, pTau burden was assessed using a customized Positive Pixel Count (PPC) algorithm tuned for chromogenic detection. Output values were expressed as the proportion of high‐intensity pixels relative to the total tissue area analyzed [22] (Figure S1D).
Updated analysis pipeline using HALO software
A revised analytical pipeline was developed using the HALO image analysis platform (version 4.1.6, Indica Labs, Albuquerque, NM). This updated workflow integrated three classifier modules into a single automated pipeline, allowing for streamlined preprocessing and improved tissue classification. The digital pipeline used previously stained and digitized WSIs and began by removing glass/background and meningeal tissue. The tissue detection classifier was tuned using a resolution setting of 2.0 μm/pixel and gated to only detect objects with a minimum size of 500 μm2. Training for the tissue detection classifier was conducted on >500 objects and 400,000 training iterations achieving an entropy score of <0.01. Next, a quality control classifier eliminated tissue folds, tears, areas of poor focus, and extraneous debris from usable tissue. The quality control classifier was similarly tuned using 2.0 μm/pixel resolution and set to detect objects >100 μm2. This classifier was also trained on >500 objects and completed 300,000 training iterations until its entropy value was <0.01. Finally, the grey/white matter segmentation classifier was used to distinguish cortical regions and generate distinct annotation layers between grey and white matter to be used for regional analysis. This final classifier was tuned using 7.00 μm/pixel resolution to ignore small variations in grey/white matter staining and only detected objects >5000 μm2. This classifier was also trained using >500 objects and underwent 750,000 training iterations that continued after reaching an entropy value of <0.01. Classifier validation was conducted to test the accuracy and precision of the grey/white segmentation. Annotated regions were separated into a training set (80% of annotated regions), validation set (10% of annotated regions), and test set (10% of annotated regions). Classifier validation achieved a precision score of 0.969, a recall score of 0.961 and an F1 score of 0.965 (Figure S2).
Following the automated detection pipeline, quantification of NFTs was first performed using the Object Colocalization module. This module detects and counts discrete immune‐positive objects based on thresholded chromogen intensity, spatial morphology, and size constraints. This algorithm allowed for refined identification of NFT structures throughout the entire segmented grey matter on each slide, with outputs expressed as density of NFTs per mm2. Parameters within the object colocalization analysis were optimized based on size, detection blur and contrast radii as well as contrast threshold and optical density, allowing for the exclusion of non‐specific signal and artifactual inclusions. The final HALO module configuration was optimized to accurately recognize and quantify the morphological signature of PHF‐1‐positive NFTs (i.e., counted NFTs, rather than just positive staining), while excluding dystrophic neurites and neuritic plaques.
pTau burden was further measured using the Area Quantification module, optimized to detect DAB‐labeled pixels and calculate the percentage of tissue surface area demonstrating immunopositivity (% of tissue stained). This approach provided high‐resolution surface‐based quantification of pTau pathology and was validated across the same anatomical regions previously analyzed with the Aperio system. However, as mentioned, unlike what was done in Aperio software, the HALO‐based analyses were conducted on the entire segmented grey matter on each slide. Quantitative outputs from both platforms were integrated with clinical metadata, including cognitive status (based on clinical consensus and final MMSE scores) and Braak NFT staging. This framework enabled comparison between the Aperio and HALO pipelines. The HALO object‐detection pipeline was configured to generate NFT‐specific quantification outputs in an attempt to emulate and update the Aperio‐derived NFT density measures, rather than broadly quantify all pTau‐positive elements. HALO also provided a complementary measure of overall pTau burden based on area quantification, thereby enabling like‐for‐like comparison with both Aperio NFT lesion density and positive‐pixel counts.
Clinicopathological correlation
To determine the optimal anatomical sampling and analytic strategy for modeling clinicopathological relationships in ADNC, we quantified both NFT density and overall pTau burden across four neocortical regions from each case. Using data derived from both the HALO and Aperio digital pathology platforms, we assessed the correlations between regional pathology and cognitive performance as measured by MMSE scores. For each metric, all possible combinations of one, two, three, and four regions were evaluated to identify sampling strategies that maximized predictive accuracy and efficiency. The strength of association between quantitative pathology and cognitive status was assessed using the coefficient of determination (R 2), with results visualized as heatmaps stratified by analysis platform and pathology type (Table S1).
Generation of data‐driven diagnostic staging thresholds
To further evaluate quantitative, clinically informed thresholds for severe‐stage Braak NFT staging classification, we focused on two neocortical regions, SMTG and occipital cortex. Using data from Cohort 1, NFT density (NFTs counted per mm2) was computed across both regions to generate a composite pTau pathology load for each case. Individuals were then rank ordered based on total NFT density, and cognitive status within 2 years of death was used to inform cut‐off selection. Thresholds were defined using criteria that combined both pathology and clinical impairment data. Braak NFT stage VI was restricted to individuals with a clinical diagnosis of dementia, irrespective of NFT burden. The threshold model derived from Cohort 1 was applied to Cohort 2, and cases were reassigned accordingly when pathology and cognitive data diverged from their originally diagnosed Braak NFT staging designation. This approach enabled data‐driven refinement of severe ADNC classification while maintaining continuity with the anatomical logic of the Braak NFT staging framework. Information depicting the change in Braak NFT staging status and average MMSE score in each Braak NFT stage can be found in Tables S1 and S2.
Data analyses
All statistical analyses were performed using either JMP Pro software version 14.0 (SAS institute, Cary, NC) or GraphPad Prism software version 8.0. GraphPad Prism was also used to generate all graphs and heatmaps.
RESULTS
Overall workflow and study design
Study goals and workflow are illustrated in Table 1 and Figure 1.
| Goal | Specific subgoal | Approach to accomplish goal | Cohort(s) used |
|---|---|---|---|
| Overarching goal | Optimize routine assessment of the key severe ADNC parameter (neocortical neurofibrillary pathology) using digital pathology to inform Braak neurofibrillary pathology staging | Establish a reproducible digital framework for quantitative pTau pathology measurement to enhance analytic precision and strengthen clinicopathological staging alignment | Cohorts 1/2 |
| Clinical relevance of routine assessment | (a) Evaluate use of pTau burden vs. NFT density counts in terms of clinical relevance | Assess predictive validity of area‐based versus object‐based pTau metrics in relation to cognitive and functional outcomes | Cohorts 1/2 |
| (b) Evaluate impact of sampling (anatomical regions included in analyses) in terms of clinical relevance | Model the contribution of regional sampling strategies to disease‐stage discrimination and cognitive decline prediction | Cohort 1 | |
| (c) Generate actual cutoffs for Braak NFT stages IV–VI | Derive quantitative thresholds for late‐stage Braak classification using data‐driven correlations between digital NFT metrics and clinical phenotype | Cohort 1 | |
| Standardization of routine assessment | (a) Assess the potential to change from Aperio‐based to HALO‐based digital segmentation, pathology recognition, and quantification | Perform cross‐platform validation to quantify inter‐system concordance and identify algorithmic or classifier‐based biases | Cohorts 1/2 |
| (b) Evaluate using same HALO modules at different research centers | Conduct multi‐center reproducibility analyses to define inter‐laboratory variance and optimize module harmonization | Cohort 3 | |
| (c) Evaluate impact of (and methodologic strategies for) using different pTau antibodies | Compare digital quantification outputs across distinct pTau epitopes (AT8, PHF‐1) to characterize antibody‐specific signal variability | Cohort 3 |
Three autopsy cohort subsamples were used to evaluate digital quantification of pTau pathology across different stages of ADNC. In all three cohorts, participants spanned the full range of ADNC severity including Braak NFT stages 0–VI. Cognitive performance, as assessed by final MMSE scores, declined progressively with increasing neuropathological severity as expected. The Apolipoprotein E (APOE) genotype distribution was predominantly ε3/ε3, although the ε4 allele was more frequent in individuals with higher Braak NFT stages. Also as expected, comorbid neuropathological findings, including cerebrovascular disease (CVD) and hippocampal sclerosis of aging (HS‐A), were more frequent in the later stages of cognitive impairment. Postmortem intervals (PMI) were relatively consistent across groups, typically ranging from 2 to 8 h (Tables 2, 3, 4).
| Cohort 1, n = 81 | |||||||||
|---|---|---|---|---|---|---|---|---|---|
| Braak NFT stage | Sample size | Age at death (Avg.) | Other tauopathies a | LATE‐NC present | HS‐aging | CVD | Most common APOE genotype | MMSE (Avg.) | PMI, h (Avg.) |
| 0 | n = 2 | 78 | 0/2 | 0/2 | 0/2 | 1/2 | ε2/ε3 | 30 | 6.0 |
| M(2) F(0) | 1/2 | ||||||||
| I | n = 19 | 84 | 0/19 | 0/19 | 0/19 | 6/19 | ε3/ε3 | 29 | 4.8 |
| M(6) F(13) | 13/19 | ||||||||
| II | n = 20 | 84 | 0/20 | 0/20 | 0/20 | 6/20 | ε3/ε3 | 29 | 5.7 |
| M(11) F(9) | 12/20 | ||||||||
| III | n = 5 | 86 | 0/5 | 0/5 | 0/5 | 1/5 | ε4/ε4 | 28 | 5.6 |
| M(2) F(3) | 4/5 | ||||||||
| IV | n = 4 | 88 | 0/4 | 0/4 | 0/4 | 2/4 | ε4/ε4 | 25 | 3.3 |
| M(3) F(1) | 2/4 | ||||||||
| V | n = 10 | 84 | 0/10 | 0/10 | 0/10 | 7/10 | ε3/ε3 | 25 | 7.4 |
| M(6) F(4) | 6/10 | ||||||||
| VI | n = 10 | 71 | 0/10 | 0/10 | 0/10 | 3/10 | ε4/ε4 | 11 | 10.0 |
| M(5) F(5) | 7/10 | ||||||||
| N/A | n = 11 | 80 | 4/11 | 0/11 | 0/11 | 1/11 | ε3/ε3 | 26 | 7.76 |
| M(4) F(7) | 5/11 | ||||||||
Abbreviations: CVD, cerebrovascular disease pathology; HS, aging: hippocampal sclerosis of aging; LATE‐NC, Limbic‐predominant age‐related TDP‐43 encephalopathy neuropathologic change; MMSE, minimental state examination; PMI, post‐mortem interval.
Other tauopathies include non‐ADNC conditions with tau proteinopathy such as Pick's disease, other subtypes of FTLD‐tau, etc. N/A cases omitted from Braak NFT staging analysis because of missing in un‐stageable Braak NFT stage, or the present of Lewy Body pathology.
| Cohort 2; n = 329 | |||||||||
|---|---|---|---|---|---|---|---|---|---|
| Braak NFT stage | Sample size | Age at death (Avg.) | Other tauopathies a | LATE‐NC present | HS‐aging | CVD | Most common APOE genotype | MMSE (Avg.) | PMI, h (Avg.) |
| 0 | n = 6 | 82 | 0/6 | 0/6 | 0/6 | 4/6 | ε3/ε3 | 26 | 6.3 |
| M(5) F(1) | 3/6 | ||||||||
| I | n = 50 | 82 | 0/50 | 4/50 | 3/50 | 17/50 | ε3/ε3 | 27 | 6.5 |
| M(21) F(29) | 31/50 | ||||||||
| II | n = 55 | 88 | 0/55 | 5/55 | 8/55 | 22/50 | ε3/ε3 | 25 | 6.7 |
| M(30) F(25) | 35/55 | ||||||||
| III | n = 28 | 88 | 0/28 | 6/28 | 3/28 | 14/28 | ε3/ε3 | 25 | 5.6 |
| M(11) F(17) | 15/28 | ||||||||
| IV | n = 20 | 88 | 0/20 | 1/20 | 1/20 | 13/20 | ε3/ε3 | 23 | 7.2 |
| M(11) F(9) | 10/20 | ||||||||
| V | n = 92 | 86 | 0/92 | 19/92 | 19/92 | 45/92 | ε4/ε4 | 18 | 6.8 |
| M(54) F(38) | 37/92 | ||||||||
| VI | n = 53 | 77 | 0/53 | 8/53 | 11/53 | 21/53 | ε4/ε4 | 10 | 9.2 |
| M(27) F(26) | 32/53 | ||||||||
| N/A | n = 25 | 77 | 7/25 | 1/25 | 1/25 | 4/25 | ε3/ε3 | 26 | 8.8 |
| M(10) F(15) | 8/25 | ||||||||
Abbreviations: CVD, cerebrovascular disease pathology; HS‐aging, hippocampal sclerosis of aging; LATE‐NC, Limbic‐predominant age‐related TDP‐43 encephalopathy neuropathologic change; MMSE, minimental state examination; PMI, post‐mortem interval.
Other tauopathies include non‐ADNC conditions with tau proteinopathy such as Pick's disease, other subtypes of FTLD‐tau, etc. Cases omitted from table represent cases with missing or unstageable Braak status. N/A cases omitted from Braak NFT staging analysis because of missing in un‐stageable Braak NFT stage, or the present of Lewy Body pathology.
| Cohort 3; n = 58 | |||||||||
|---|---|---|---|---|---|---|---|---|---|
| Braak NFT stage | Sample size | Age at death (Avg.) | Other tauopathies a | LATE‐NC present | HS‐aging | CVD | Most common APOE genotype | MMSE (Avg.) | PMI, h (Avg.) |
| 0 | ‐ | ‐ | ‐ | ‐ | ‐ | ‐ | ‐ | ‐ | ‐ |
| I | |||||||||
| II | n = 12 | 88.4 | 0/12 | 8/12 | 3/12 | 6/12 | ε3/ε3 | 24 | 6.2 |
| M(6) F(6) | 10/12 | ||||||||
| III | n = 11 | 87.8 | 0/11 | 5/11 | 1/11 | 8/11 | ε3/ε3 | 24.5 | 5.4 |
| M(6) F(5) | 4/11 | ||||||||
| IV | n = 11 | 87.3 | 0/11 | 5/11 | 4/11 | 7/11 | ε3/ε3 | 23.2 | 15.3 |
| M(7) F(4) | 7/11 | ||||||||
| V | n = 12 | 81.8 | 0/12 | 5/12 | 5/12 | 3/12 | ε3/ε3 | 17.2 | 11.5 |
| M(7) F(5) | 5/12 | ||||||||
| VI | n = 12 | 79.4 | 0/12 | 9/12 | 4/12 | 6/12 | ε4/ε4 | 6 | 6.8 |
| M(5) F(7) | 7/12 | ||||||||
Abbreviations: CVD, cerebrovascular disease pathology; HS‐aging, hippocampal sclerosis of aging; LATE‐NC, Limbic‐predominant age‐related TDP‐43 encephalopathy neuropathologic change; MMSE, minimental state examination; PMI, post‐mortem interval.
Other tauopathies include non‐ADNC conditions with tau proteinopathy such as Pick's disease, other subtypes of FTLD‐tau, etc.
Digital quantification of pTau pathology across four neocortical regions
To establish a standardized digital neuropathology workflow, we implemented parallel quantification pipelines using two commercially available platforms, HALO and Aperio, applied to sections immunostained for PHF‐1. The updated pipeline generated two orthogonal quantitative outputs: NFT density (NFTs counted per mm2), based on object‐level detection, and pTau burden, reflecting the percentage of cortical grey matter positive for pTau via pixel‐based classification (% of tissue stained). These analyses were performed on four different neocortical regions implicated in ADNC, including MFG, SMTG, parietal cortex, and occipital cortex. AI‐driven workflows yielded segmentation of grey matter regions and successfully captured regional pathology patterns consistent with known disease topography (Figure 2).
Using these segmentation methods, we assessed how well regionally sampled pTau pathology predicted cognitive status. For each case in Cohort 1, we analyzed the relationship (R 2) between final MMSE score and both NFT density and pTau burden derived from HALO and Aperio platforms (Figure 3A). All combinations of one, two, three, or four sampled neocortical regions were considered. As visualized in a heatmap of R 2 values, multiregional sampling provided stronger associations with cognitive impairment than single‐region sampling, with the most consistent performance observed when the SMTG and occipital cortex were combined (Figure 3A). Sampling limited to SMTG and occipital cortex yielded R 2 values comparable to full‐region models, consistent with their established relevance in Braak NFT staging [8]. These findings were stable across platforms and across quantification metrics (Figure 3B,C).
Quantitative NFT density stratified by clinical status to refine staging accuracy
After establishing that the use of NFT densities in two (SMTG and occipital) neocortical regions correlated with cognitive abilities, we proceeded to update the existing thresholds for each of the stages in severe ADNC. Rank‐ordering cases based on NFT densities revealed substantial inter‐individual variability across the cohort (Figure 4A). The highest NFT summed count among non‐impaired individuals was approximately 19 NFTs per mm2, while the impaired group extended well above 45 NFTs per mm2, establishing a potential data‐driven threshold criterion. We further examined how digital NFT quantification aligned with prior diagnosed Braak NFT staging (Figure 4B). Digital NFT counts were positively correlated with the original and Braak NFT classification (Figure 4C), with the updated model showing superior linearity (R 2 = 0.5140 vs. R 2 = 0.6582). Several cases were reassigned to higher or lower stages under the updated model, with final assignments better reflecting their quantitative burden (Figure 4C). These results suggest that digital pathology can enhance resolution and staging fidelity beyond traditional categorical assessments.
Comparison of pTau detection between different digital pathology platforms
After establishing an updated workflow and Braak NFT stage classification, we next evaluated cross‐platform agreement. NFT density and pTau burden were independently quantified in each case and cortical region in Cohort 1 using both HALO and Aperio software. Cross‐platform comparisons demonstrated high linear correlation across all regions and metrics (R 2 = 0.91–0.98; Figure 5). This concordance confirmed that both object‐based and area‐based metrics are robust to methodological differences in platform architecture and algorithmic implementation.
Despite producing comparable quantitative metrics, HALO and Aperio workflows differed substantially in analytic workflows. As reported in Neltner et al., Aperio requires manual ROI placement and quality control, with semi‐automatic analysis steps [22]. For pTau analysis, a single slide can take up to 10 min for quality control and 30 min for pathology detection. In contrast, HALO utilizes a fully integrated AI pipeline that automates tissue detection, quality control, grey/white matter dissection, and analysis steps, often completing all stages in under 1 min per slide. These automation‐driven efficiencies dramatically reduce user burden while preserving analytic fidelity, making HALO particularly well‐suited for high‐throughput or multi‐site studies where standardization and scalability are essential (Table 5).
| Classifier/analysis | Aperio | HALO |
|---|---|---|
| Tissue detection | 10–30 s | 4 s |
| ROIs manually placed throughout tissue | Done automatically as part of AI pipeline | |
| Quality control | 5–10 min | 17 s |
| Done manually | Done automatically as part of AI pipeline | |
| Tissue dissection | N/A | 4 s |
| N/A | Done automatically as part of AI pipeline | |
| Object colocalization | ~30 min | 15–60 s |
| Semi‐automatic; started standalone analysis | Done automatically as part of AI pipeline or as standalone analysis | |
| Area quantification | ~2 min | 15–60 s |
| Semi‐automatic; started standalone analysis | Done automatically as part of AI pipeline or as standalone analysis |
Following development, training, and internal testing of the AI‐detection pipeline using Cohort 1, the automated pipeline was next applied to Cohort 2 to assess generalizability on a wider range of pathologies. As previously mentioned, Cohort 1 consisted of cases with “pure” ADNC pathology, while Cohort 2 encompassed a full spectrum of cases from the UK‐ADRC brain bank, including those with mixed and multiple pathologies. Application of the detection pipeline to Cohort 2 yielded similarly high correlation coefficients (R 2 = 0.78–0.90), confirming its ability to detect pTau pathology in more heterogeneous pathological cohorts that are also consistent with the findings generated within the ADRC since 2012. Together, these findings affirm the interchangeability of digital pathology metrics across software environments and support the feasibility of harmonized, efficient workflows for both research and clinical applications (Figure 6).
Assessment of pTau quantification across independent sites using harmonized pipelines
To determine whether digital quantification could be generalized and shared across different sites (i.e., researchers at different universities), identical imaging and analysis workflows were applied to matched cases from two independent brain banks (UK‐ADRC and UTHSA‐ADRC). NFT density and pTau burden were independently derived at each site for all four cortical regions. Inter‐site correlation coefficients exceeded R 2 = 0.99 across all comparisons, reflecting near‐identical quantification between sites (Figure 7).
Assessment of pTau pathologic quantification across different pTau antibodies (PHF‐1 and AT8)
Lastly, we examined whether digital quantification is preserved across pTau epitopes by comparing pathology metrics from adjacent sections stained with pTau antibodies PHF‐1 and AT8 in Cohort 3. Strong correlations were observed across both NFT density and pTau burden in all four cortical regions (R 2 = 0.73–0.91; Figure 8), with particularly high agreement in SMTG and MFG. This validation is highly relevant given that the AT8 antibody is one of the most widely used commercially available pTau antibodies in both research and clinical applications [81, 82].
DISCUSSION
This study aimed to develop a data‐grounded framework for classifying Braak NFT stages IV–VI by integrating high‐resolution digital pathology, AI, and clinical metrics to support standardized diagnosis of severe ADNC. Through automated WSI analysis and cross‐platform validation, we generated quantitative measures of pTau burden and NFT density, both of which showed strong associations with antemortem cognitive status. These measures enabled a clinically informed distinction among higher Braak NFT stages [4, 5, 6, 7, 83]. Although the overall focus of this project was severe ADNC (Braak NFT stages IV–VI), the samples used (specifically those in Cohort 2) were not limited to cognitively impaired individuals. More specifically, 24% of the overall cohort were cognitively normal before death. The present approach thus provided a continuous, quantitative measure of pTau burden and NFT density that may help refine disease classification across the disease spectrum while preserving the established anatomical framework of Braak NFT staging. Importantly, these findings do not propose a modification of the Braak NFT staging system per se, but rather offer a reproducible, clinically relevant supporting protocol that complements the existing framework and enhances its clinical and research applicability. Moreover, the ability to apply clinical data‐informed, quantitative thresholds to pTau pathology facilitates improved diagnostic stratification, particularly in cases where semi‐quantitative staging yields incongruent clinical interpretations. These thresholds should be interpreted as data‐driven, retrospective refinements intended to harmonize classification within severe Braak NFT stages and are designed to provide a clinically informed quantitative framework that complements traditional Braak NFT staging by improving resolution and reproducibility in late‐stage ADNC. In such settings, digitally derived metrics provide a more data‐driven foundation for evaluating disease severity.
In the current study, the optimal anatomical regions sampled that we recommended coincided with BrainNet Braak staging as detailed by Alafuzoff et al. [8, 84]. Thus, quantification of pTau pathology from the SMTG and occipital cortex provided robust clinicopathological associations [4, 5, 6, 7, 83]. These regions are already included in standard ADRC sampling protocols, ensuring that no additional tissue acquisition or specialized processing is required [79]. This alignment with established workflows facilitates integration of the proposed digital metrics into routine neuropathologic assessment and multicenter research efforts.
Our updated approach proposes quantitative cutoffs for categorization of advanced stages of pTau pathology in ADNC, based on AI‐derived metrics integrating pathological and cognitive data. While recent studies have demonstrated the utility of HALO and QuPath‐based digital quantification of pTau pathology, the present study specifically emphasizes the cross‐correlation of digital pathology and clinical data with Braak NFT staging [33, 85, 86, 87]. An underlying assumption for the current study is that the pathological grading of disease should reflect clinical outcomes. More specifically, the most severe disease grade should reliably reflect clinical impairment. While this generally holds true for ADNC, the criteria for underlying pathologic staging remain open to refinement (see, e.g., References [3, 78]).
While Braak NFT staging remains a foundational system for mapping the hierarchical progression of pTau pathology, it is constrained by its ordinal structure, interpretive variability, and imperfect correlation with clinical outcomes [88, 89, 90]. By integrating DL‐based quantification with longitudinal cognitive measures, our analyses improved these gaps. This combined approach enhances clinical‐pathological correlations and reduces variability inherent in categorical assessments, particularly in the context of late‐stage disease.
A key strength of this study lies in its reproducibility and scalability across institutions. Historically, inter‐laboratory variation in antibody selection and regional sampling have hindered comparability in ADNC staging. In addition to methodological inconsistencies across institutions, significant variability also arises from differences in the choice of pTau antibodies used for immunohistochemistry. However, advances in whole‐slide imaging and AI‐based tissue segmentation now permit direct sharing of classifier models and quantification parameters, an achievement that until recently was technically prohibitive. The use of commercially available digital pathology platforms, standardized classifier architectures, and easily shared analytical pipelines allows for standardized replication of quantitative outputs between centers, as demonstrated by strong data concordance across sites and staining protocols. However, the data also highlighted the shortcomings in the clinical‐pathological correlation of our own archival Braak NFT staging data. Nevertheless, this study provides proof of concept that standardized, AI‐based detection pipelines can be readily deployed and implemented in external settings across digital platforms. Once trained on tissue from a single site, these pipelines can be distributed electronically, via direct file transfer or public repositories such as Github, and used without the need for retraining or site‐specific optimization, supporting the goal of broader adaptation of harmonized analytical frameworks in neuropathology.
Braak NFT staging has served as the principal framework for indexing the progression of pTau neurofibrillary pathology in amnestic dementia. However, recent multi‐center evaluations, most notably from the BrainNet Europe Consortium, have revealed considerable interpretive variability in staging outcomes across institutions, even when guided by consensus protocols [68, 84, 91]. The protocol that could be regarded as the “gold standard” for Braak NFT staging, proposed by Alafuzoff et al. (with Dr. Heiko Braak a coauthor), assigned stages IV–VI based on the distribution of pTau pathology across defined neocortical regions (occipital/striate cortex and temporal neocortex). This system operationalizes “+++,” “++,” “+,” or “−” severity scoring of AT8‐immunoreactive neuropil threads [8], thereby emphasizing a form of pTau pathology distinct from NFTs per se. In contrast, the 2012 NIA‐AA consensus ADNC diagnostic guidelines were notably less prescriptive, permitting the use of either silver impregnation staining or pTau immunohistochemistry to determine Braak NFT stages [2]. Taken together, these considerations underscore major practical limitation of the Braak NFT staging framework: its reliance on semi‐quantitative, anatomically bounded classification introduces substantial variability in staging fidelity, particularly in advanced stages where clinical implications are greatest. In response, there is a need for more reproducible, quantitative, and cognitive status‐informed approaches that augment traditional anatomical hierarchies with digital pathology and machine learning–based measurements of pTau pathology. Our study addressed these needs by augmenting categorical anatomical staging with continuous, regionally sampled, and clinically validated digital metrics that refine late‐stage classification while preserving conceptual continuity with the original Braak NFT staging framework.
This study also demonstrated that harmonized AI‐based pathology workflows can be effectively implemented across institutions, imaging platforms, and pTau antibodies. The ability to deploy classifier models and quantification parameters across brain banks and pathology centers represents a significant advance in reproducibility, enabling multi‐site studies of unprecedented scale. In the context of the ADRC network, such workflows facilitate standardization across autopsy cohorts and support large‐scale aggregation of digital pathology datasets. This work also underscores the feasibility of integrating AI‐derived metrics into formal neuropathological staging guidelines. As initiatives such as the NIA‐AA seek to refine ADNC diagnostic frameworks, incorporating quantitative, cognition‐informed metrics may help mitigate inter‐rater variability and strengthen the clinicopathological bridge. Our approach builds on the conceptual foundation of Braak NFT staging, providing greater resolution and improved clinical interpretability through consistent and transparent measurement.
Although both antibodies AT8 and PHF‐1 detect pathological pTau aggregates, the two antibodies bind to distinct tau phosphorylation epitopes and therefore label different molecular states of pTau pathology [81]. More specifically, AT8 recognizes phosphorylation at tau protein amino acid residues serine202/threonine205, which is commonly believed to be a marker of early conformational change and is abundant in pre‐NFT and neuropil thread pTau+ structures [80, 81, 82, 92, 93]. In contrast, PHF‐1 recognizes a phosphorylated epitope at tau protein amino acid residues serine396/serine404, typically associated with more mature NFTs [81, 82, 93, 94, 95, 96, 97]. These epitope‐specific affinities result in differences in staining patterns and signal intensity across brain regions and disease stages, which could influence digital detection algorithms trained on a single antibody type. As such, harmonizing outputs across cohorts and platforms requires careful validation of antibody‐specific classifiers and threshold parameters to ensure accurate and reproducible quantification of pTau pathology regardless of immunolabeling strategy. Our results indicated that the results of AT8 and PHF‐1 immunolabeling can be harmonized in a systematic way.
Some limitations of the current study warrant consideration. The MMSE test, while widely available and more granular than dichotomizing “dementia/no‐dementia” (or applying the 0–3 Clinical Dementia Rating scale), provides a still‐imperfect measure of global cognition that may ignore domain‐specific deficits more closely aligned with regional pTau burden [98, 99]. Future studies should include comprehensive neuropsychological batteries to better capture interesting clinicopathological relationships. Moreover, while digital readouts were generally consistent across PHF‐1 and AT8 antibodies, subtle differences in epitope binding and staining intensity may still introduce variability in cross‐site comparisons. Additionally, as WSIs included in this project incorporated nearly all cases in the UK‐ADRC biobank dating back to 2011, some variability in histological staining was unavoidable. Furthermore, our sampling focused on neocortical regions and did not include subcortical or allocortical areas, which may be critical for understanding atypical or early‐onset phenotypes [14, 80, 100, 101]. While commercial digital pathology tools such as HALO and Aperio software have enabled significant progress, they are not without their own shortcomings. They remain limited by licensing constraints, high costs, and historically restricted cross‐institutional compatibility. These barriers have prompted the development of federated, open‐access infrastructures such as the Brain Digital Slide Archive (BDSA; NIH grants U24 NS133945 and U24 NS133949), which fosters collaborative slide annotation, AI model training, and harmonized data sharing across institutions [1, 102]. Our integration with this initiative reflects the growing emphasis on open frameworks as essential infrastructure for scalable, reproducible, and equitable neuropathology. These efforts parallel successful initiatives in neuroimaging and genomics, where harmonized data repositories have catalyzed innovation in diagnostics and biomarker discovery.
This study contributes to ongoing efforts to modernize neuropathological assessment by advancing a scalable model for harmonized digital pathology that links pTau quantification with cognitive status. By enabling the deployment of AI‐driven pipelines across multiple sites and software platforms, our approach supports emerging standards for interoperable, clinically anchored analysis. Importantly, our findings validate that shared classifier modules and regionally optimized sampling can produce reproducible outputs that enhance disease classification, offering a step towards the implementation of multimodal staging systems. Within this evolving landscape, digital pathology is a key requirement for modern neuropathology, supporting precision phenotyping, cross‐disciplinary insight, and diagnostic fidelity. The present study contributes to these efforts by integrating digital histology with clinical data, reinforcing the field's movement toward holistic, standardized, and clinically interpretable assessments of neurodegenerative disease.
CONCLUSION
This study demonstrated that quantitative digital pathology, when integrated with clinical cognitive data, can enhance and rationalize Braak NFT staging of severe ADNC. By deploying harmonized AI‐driven pipelines across institutions, we derived reproducible metrics of pTau pathology that correlated more strongly with cognitive impairment and offered improved delineation of severe Braak NFT stages. These results underscore the feasibility of cognition‐informed digital staging and support a shift toward standardized, scalable approaches for neurodegenerative disease diagnosis.