- 设计:45 例 GBM 前瞻性采集 161 块术中活检,按 MRI 分为强化肿瘤(CE)、非强化肿瘤(nCE)、血管源性水肿与影像学正常组织四区;MIB1 免疫组化测增殖与细胞密度,并以单细胞 RNA 测序数据中筛选的免疫、胶质与血管标志物做靶向转录谱。
- 发现:多数 nCE 活检具肿瘤特征——细胞密度高、增殖标志物阳性、少突胶质细胞特征丢失;但部分 MRI 判为「水肿」的区域同样含浸润肿瘤细胞,且与疾病进展相关——MRI 对 nCE 的划分总体准确,却低估水肿区的浸润。
- 预后:大体全切(GTR)患者中,周边高细胞密度预示更早局部复发;强化肿瘤中的免疫相关表型仅在完整切除强化区后与较差预后相关;基因面板(尤其少突胶质细胞标志物)的预后意义取决于活检部位与切除范围。
- 对病理科的提示:周边组织的细胞密度与 MIB1 评估可作为复发风险分层工具,作者主张把肿瘤周边的组织学与分子评估纳入手术与治疗决策。附图 1–6 中英对照。
收录范围:PMC 开放获取全文(CC BY-NC-ND 4.0)——摘要、引言、方法、结果、讨论,图 1–6 与图注中英对照;作者贡献、资助、利益冲突、伦理声明、补充材料与参考文献未收录。
摘要
胶质母细胞瘤(GBM)是最致命的癌症之一,这主要归因于残留肿瘤细胞驱动的、几乎不可避免的复发。近期证据表明,将切除范围扩展至非强化肿瘤(nCE)区域的超全切除可能延长生存期。然而,这些区域的肿瘤浸润尚未得到充分表征。我们的目标是明确 GBM 周边区域的细胞构成及其临床相关性。为此,我们前瞻性收集了 45 例 GBM 患者的 161 份活检标本。根据磁共振成像(MRI),将样本分为强化肿瘤、nCE 肿瘤、血管源性水肿或影像学正常组织。我们采用 MIB1(Ki-67)染色进行免疫组织化学检测,以识别增殖细胞并测量细胞密度。我们还进行了转录表达谱分析,从单细胞 RNA 测序数据中筛选免疫、胶质及血管标志物。我们分析了这些指标与切除程度及患者结局的关联。大多数 nCE 肿瘤活检标本呈现肿瘤性特征,包括高细胞密度、增殖标志物表达以及少突胶质细胞特征的丧失。然而,部分在 MRI 上标记为水肿的区域也含有浸润性肿瘤细胞,并与疾病进展相关。因此,尽管基于 MRI 的 nCE 肿瘤区域分类总体准确,但其低估了标记为水肿区域内的浸润。此外,在接受全切除的患者中,周边区域的高细胞密度预示着更早的局部复发。这提示,评估周边区域的细胞密度能够改善复发风险预测。在肿瘤微环境分析方面,只有在强化肿瘤完全切除后,免疫相关表型才与较差预后相关。此外,我们的基因检测组合,尤其是少突胶质细胞标志物,可根据活检部位与切除程度提供预后信息。这些发现支持将肿瘤周边区域的组织学和分子评估纳入手术与治疗决策过程。这一方法为改善 GBM 患者分层和结局预测提供了途径。
引言
胶质母细胞瘤(GBM)是中枢神经系统最常见、最致命的肿瘤,五年生存率仅为 5% [1]。虽然其很少发生转移,但会广泛浸润脑实质。浸润性并非这种高级别胶质瘤所独有;它是治疗抵抗的关键驱动因素,也解释了 GBM 为何总会复发,且通常发生在切除腔边缘。即使在积极的手术切除后,继以针对瘤床的放射治疗及替莫唑胺全身治疗,仍会出现这种情况 [2]。
磁共振成像(MRI)是诊断和表征 GBM 的金标准。GBM 通常表现为强化(CE)病灶,有时因瘤内坏死、囊肿或出血而呈现不均一性。在 T2-FLAIR(液体衰减反转恢复)序列上,其核心周围为高信号区。近期研究提示,可在 FLAIR 高信号区域检测到 GBM 浸润。具体而言,非强化肿瘤(nCE)表现为轻度至高度信号增高的病灶 [3, 4]。然而,区分 nCE 肿瘤与水肿及胶质增生仍具有挑战性,并且很大程度上依赖主观影像学标准。此外,在部分 GBM 病例中,所有肿瘤均表现出强化,这提示浸润性肿瘤区域并非总能在常规 MRI 上显示,或者某些肿瘤比其他肿瘤更具浸润性。
近年来,超全切除的概念日益受到重视。这一方法旨在尽可能切除肿瘤,包括 CE 和 nCE 部分,前提是能够安全完成且不会导致显著的神经功能缺损。多项研究报告,GBM 患者的总生存期(OS)显著延长,平均增加 6 个月,这是迄今其他任何肿瘤治疗均未达到的结果 [5, 6]。此外,已提出新的神经肿瘤疗效评价(RANO)标准,用于对手术切除程度进行分类,其中包括超全切除类别;目前也正在开展临床试验,以验证这些扩大切除带来的生存获益 [7, 8]。
这些结果凸显了表征 GBM 肿瘤周边 FLAIR 高信号区域的重要性。该区域包含肿瘤细胞、免疫系统细胞、反应性星形胶质细胞和少突胶质细胞谱系细胞的混合群体,其所处的血管环境与肿瘤核心显著不同 [9, 10, 11, 12]。多项研究利用单细胞技术,提供了 GBM 周边区域细胞特征的详细信息,并确定了某些肿瘤细胞状态的富集 [13, 14, 15, 16]。然而,这些研究分析的样本数量有限,且均未探讨不同影像学区域之间的差异或其与 GBM 进展的相关性。
在本研究中,我们前瞻性建立了一个包含 161 份影像引导活检标本的队列,标本取自强化结节区域及其周边。我们采用新的 RANO 标准,评估了纳入研究的 45 例患者的切除程度。值得注意的是,在我们的队列中,术后存在残留 CE 肿瘤对患者生存产生了显著影响。我们对石蜡包埋样本进行了免疫组织化学(IHC)分析,测量细胞密度和增殖情况(Ki67 阳性细胞),将其作为肿瘤浸润指标。结果证实,nCE 肿瘤区域含有大量增殖细胞,其细胞密度与肿瘤核心相近。然而,我们也在部分影像学归类为血管源性水肿的区域及无影像学改变的区域发现了肿瘤特征。在接受 CE 肿瘤完全切除(全切除,GTR)的患者中,周边样本的低细胞密度与较好的 OS 以及复发肿瘤出现在远离手术部位的位置相关。
为进一步评估肿瘤浸润程度并表征肿瘤微环境,我们利用公开的单细胞 RNA 测序(scRNA-seq)数据,鉴定了不同细胞类型的特异性基因。差异基因表达分析的无监督聚类依据增殖标志物的富集以及正常内皮和少突胶质细胞表达的缺失,将 nCE 肿瘤样本与 CE 活检标本归为一组。CE 样本中的特定细胞标志物,尤其是与内皮细胞和免疫细胞相关的标志物,与较差预后相关;但这一现象仅见于接受强化肿瘤完全切除的患者。实际上,在非 GTR 患者组中,髓系和 T 细胞标志物与 OS 呈负相关。有趣的是,nCE 活检标本中的少突胶质细胞相关基因表达与 OS 改善相关;相反,肿瘤核心样本中则呈现相反趋势。
总体而言,我们的研究对一个大型 GBM 瘤周样本队列进行了组织学和转录组学表征。这一表征证实,基于 FLAIR 图像选定为 nCE 肿瘤区域的大多数区域具有成瘤性。然而,我们的数据支持改进术前和术后 MRI 技术,以识别那些表现为血管源性水肿或影像学正常区域的肿瘤浸润区域。我们认为,术后全面表征 GBM 肿瘤的性质和范围,可能具有重要的预后和预测价值。
方法
人体样本
我们于 2021 年 4 月至 2024 年 4 月开展了一项前瞻性研究,研究对象为所有因新诊断高级别胶质瘤接受手术的成年患者,排除接受立体定向活检者,以及被认为获取多份活检标本会造成不必要风险的病例。我们仅纳入确诊为 GBM 且异柠檬酸脱氢酶(IDH)1 和 2 基因为野生型的患者。术前 MRI 扫描用于确定肿瘤体积和位置,并选择采集活检标本的肿瘤区域,优先考虑对每例患者实施最大范围的安全肿瘤切除。每份活检标本的解剖位置均通过取样时的术中神经导航截图记录,随后映射到术前 MRI 上进行影像学分类。为尽量减小术中脑移位的影响,优先在手术早期、神经导航准确性最高时获取活检标本。对于手术后期获得、无法确保与术前 MRI 可靠对应的样本,将其排除在分析之外。
至少两名经验丰富的神经放射科医师独立审阅手术图像,并将活检标本分为 CE 肿瘤、nCE 肿瘤、血管源性水肿或影像学正常区域。对在 FLAIR 高信号且无强化的区域获取的活检标本,进一步分为非强化肿瘤和血管源性水肿。我们采用观察性标准区分这两个亚类的样本。归类为 nCE 肿瘤的区域包括取自具有结节性或膨胀性表现、皮质增厚和/或 FLAIR 信号强度低于血管源性水肿的区域的活检标本。在这些样本中,使用 Olea Sphere © 测得的表观扩散系数(ADC)始终低于 1 × 10⁻³ mm2/s。若有灌注成像资料,也将其纳入考虑,其中相对脑血容量(rCBV)通常高于 1,支持归类为 nCE 肿瘤。
相反,血管源性水肿被定义为 FLAIR 信号强度很高的区域,通常呈指状分布、不累及皮质,且缺乏与 nCE 肿瘤相关的形态学特征;这些样本中大多数的 ADC 值介于 1 × 10⁻³ 和 2 × 10⁻³ mm2/s 之间,且在有相关数据时 rCBV 值低于 1,与既往报道一致 [17, 18]。
放射科医师分析术后 MRI 扫描(术后 ≤72 h 内获取),以评估每例患者的切除程度。通过组织病理学检查和测序,我们排除了所有 IDH 突变型(IDHmut)病例,以及坏死成分较多的 CE 肿瘤活检标本。患者和所收集样本的详细清单见附录 S2。
肿瘤的分子特征分析
术中(治疗前)获取的活检标本保存在 RNAlater 中(冷冻),或经 PFA 固定后石蜡包埋(FFPE)。使用 Maxwell RSC DNA FFPE Kit(Promega)从 FFPE 肿瘤组织中提取 DNA,并使用 Qubit 2.0 荧光计(Thermo Fisher Sci.)定量。我们采用定制的 AmpliSeq 基因靶向新一代测序检测组合,分析常见突变:TERTp、1p/19q 共缺失、EGFR/EGFRvIII/PDGFRA 扩增以及 CDKN2A/PTEN 缺失 [19]。使用 Ion AmpliSeq Library Kit Plus 手工制备 Ampliseq 文库,并在 Ion Torrent Genexus Integrated 测序仪(Thermo Fisher)上进行测序。采用 Pyromark Q24 试剂盒(QIAGEN)评估 MGMT 甲基化状态(附录 S2)。
RNA 提取和 qRT-PCR
按照附录 S2 中详述的方案,使用 TRIzol(Invitrogen)提取 RNA。使用 PrimeScript RT Reagent Kit(Takara)对 1 微克 RNA 进行逆转录。使用 SYBR Premix(Takara)和基因特异性引物(附录 S2),在 LightCycler 480(Roche Diagnostics)上进行 qRT-PCR。将 GAPDH、HPRT 和 RPII 作为候选管家基因进行检测。评估这些基因的表达一致性后,选择 GAPDH 用于归一化。每个反应均设置两个技术重复,并纳入无模板对照。使用 ΔΔCt 法计算相对基因表达量。
免疫组织化学和免疫荧光染色及定量
染色在 4 μm 厚的 FFPE 切片上进行。使用苏木精-伊红染色确认组织学特征。对于显色和荧光检测(附录 S2),将玻片在 60°C 下预热 30 min,随后使用 BOND RXm 自动化高级染色系统(Leica Biosystems),按照各染色类型的专用方案进行处理(附录 S2)。采用 Hamamatsu NanoZoomer‐SQ 显微镜扫描二氨基联苯胺(DAB)染色玻片,并使用配备 20x/0.80 NA 物镜的 Leica Thunder Imaging System 采集 IF 图像。
使用 QuPath 软件,按照特定设置进行图像定量(附录 S2)。采用阳性细胞检测方法分析 DAB 染色,计算指定区域内阳性细胞占总细胞数的百分比。IF 定量采用复合分类器方法,整合多个荧光通道的信息,根据联合标志物强度对对象进行分类,从而实现共表达的定量分析。
scRNA-seq 数据集分析
我们分析了此前发表的整合人类单细胞图谱;该图谱按照既往所述方法 [20],通过整合正常脑、IDHmut 胶质瘤(较低级别胶质瘤,LGG)及 GBM 的公开 scRNA-seq 数据集生成。我们纳入非肿瘤 [21]、LGG 和 GBM 样本 [22](附录 S2),使该基因列表有望适用于所有胶质瘤样本,尽管此处呈现的结果仅限于 IDHwt GBM。使用 Seurat 流程进行无监督聚类(先基于 PCA 构建近邻图,再进行 Louvain 社区检测),使用 Harmony 校正患者间的批次效应,并系统评估分辨率参数以确保细胞簇的稳定性。为验证肿瘤周边区域的关键基因,从公共存储库下载已处理的 RDS 文件。使用 Seurat v4.3.0 进行数据处理和分析。采用 Seurat 函数 FindAllMarkers(用于细胞类型特异性标志物)及 FindMarkers(用于条件特异性比较)确定差异表达基因(DEGs),要求基因在至少 25% 的细胞中表达,且最小对数倍数变化为 0.25。
关键基因鉴定
进行了两种不同类型的分析(附录 S2)。
分析 1
从 DEGs 中鉴定关键基因(附录 S2):
(1)整合单细胞图谱中的细胞类型特异性标志物。作为各细胞类型标志物的 DEGs,在各细胞簇中采用以下参数:大多数细胞簇为 ptc.2 ≤ 0.1,星形胶质细胞-C10 为 ptc.2 < 0.2,内皮细胞、血管壁细胞和神经元为 ptc.2 < 0.3。(2)在每个特定细胞簇内,对照脑与 LGG 患者之间的 DEGs(参数设置:avg_log2FC = <−1)。(3)对照脑与新诊断 GBM 患者之间的 DEGs(参数设置:avg_log2FC = <−1)。(4)对照脑与复发性 GBM 患者之间的 DEGs。稳态与新近复发的 GBM 患者之间的 DEGs(在每个特定细胞簇内(参数设置:avg_log2FC = <−1))。
在每个特定细胞类型中,这些列表之间重叠的基因被定义为候选关键基因(附录 S1F 和表 S1)。通过比较 GTEx 脑皮质/额叶皮质与 TCGA LGG 及 GBM 数据集,对其进一步验证(附录 S1F 和表 S1)。为评估显著的表达差异,我们采用 Welch t 检验(TCGA 与 GTEx 比较)[23],鉴定正常脑组织与胶质瘤样本之间表达差异最大的基因(附录 S1F 和表 S2)。
分析 2
从保守标志物 DEGs 中鉴定关键基因(附录 S1G):
我们基于维恩图,将对照脑和胶质瘤样本中显著的保守标志物,与整合单细胞图谱中鉴定的细胞类型特异性标志物进行比较(参数设置:ptc.2 ≤ 0.1)。当分析 1 未能为某些细胞类型提供有力标志物时,采用这一分析,帮助我们提取内皮细胞和少突胶质细胞的关键标志物。
最后,在整合单细胞图谱和核心/周边区域数据库(附录 S1B)中对两种分析得到的候选基因进行可视化,以筛选细胞类型特异性最强的基因(附录 S2)。
生存分析
为评估这些标志物的表达在 GBM 中的预后价值,我们使用了人类蛋白质图谱网络工具 [24](proteinatlas.org)。RNA 测序(RNAseq)数据来自 TCGA。采用最佳截断值算法,将 GBM 癌症患者分为高表达组或低表达组(附录 S1F,G)。
细胞类型 RNA 表达
为确认这些标志物的细胞类型特异性基因,我们使用了人类蛋白质图谱网络工具 [24]。RNA 特异性类别依据正常组织 scRNA-seq 数据中所分析细胞类型的 mRNA 表达水平确定(附录 S1F,G)。
统计学
所有分析均使用 R(v.4.4.3)进行。分析前,对连续变量进行 log10 转换及标准化(z 分数)。使用 Shapiro–Wilk 检验评估正态性;鉴于所有变量均为非正态分布且各亚组样本量较小,采用非参数检验。双侧 p ≤ 0.05 被认为具有统计学意义。
对于多类别间比较,先进行 Kruskal–Wallis 检验,再使用 Wilcoxon 秩和检验(Mann–Whitney U)进行两两显著性检验,并针对多重比较校正 p 值。生成点图,以可视化展示整合 scRNA-seq 对象及 GBM 患者组织样本中目标基因的表达。
根据既往转录组学研究,取与每种细胞类型(例如少突胶质细胞、星形胶质细胞、髓系细胞)相关的预定义标志物基因的归一化(z 分数化)表达值的平均值,计算细胞类型评分。这些评分提供了不同样本间细胞类型相关转录程序的相对度量,并用于比较影像学定义的区域。
为评估分子评分在不同组织类别中的预测能力,使用 caret 框架训练多类别分类模型。采用了以下算法:多项逻辑回归、随机森林、XGBoost 和多项 LASSO 回归(glmnet)。通过重复五次的 10 折交叉验证评估模型,报告准确率、Cohen kappa 值及混淆矩阵。通过总体及各类别的置换重要性分析确定变量重要性。对于一对其余类别的比较,使用带 LASSO 正则化的广义线性模型(GLM)识别最相关的预测变量,并通过 pROC 包计算 ROC 曲线/AUC 值。
基于 45 个基因的表达矩阵,使用 ConsensusClusterPlus(v.1.64.0)对肿瘤样本进行无监督聚类。采用 Ward 法和 Spearman 距离的层次聚类,在一系列聚类数(K = 2–10)下评估聚类稳定性。根据共识累积分布函数(CDF)图、面积增量图及样本追踪图,选择最优聚类数(K = 5)。通过主成分分析(PCA)、t 分布随机近邻嵌入(t-SNE)、均匀流形逼近与投影(UMAP)以及轮廓分析验证聚类。采用卡方检验对聚类簇与类别之间的关联进行统计分析。使用 Cramér V 量化关联强度,其中 <0.3、0.3–0.5 和 >0.5 分别解释为弱、中等和强关联。
使用 Cox 比例风险模型(survival 和 survminer 包)进行生存分析。采用 LASSO 惩罚的 Cox 模型,将分类协变量设为不受惩罚,对连续预测变量分别进行单独及联合分析。使用 Schoenfeld 残差检验比例风险假设;对于违反假设的情况,采用分层(分类变量)或时间依赖项(连续变量)进行校正。使用 Harrell C 指数评估模型性能,并以森林图汇总结果(风险比及 95% CI)。绘制 Kaplan–Meier 曲线并进行 log-rank 检验,以评估不同分类变量下的总生存期。采用针对删失状态校正的偏 Spearman 相关分析,探索分子变量与生存之间的关联。
生成式 AI 工具(如 DeepL 和 ChatGPT)被用于语法检查和语句改写等任务。
结果
队列建立与实验流程
本研究共纳入 45 例 IDHwt GBM 患者。图 1A 展示了其主要临床特征及肿瘤中发现的遗传改变。由于队列规模有限,无法基于共现的基因组改变进行稳健的分子亚组划分。因此,我们采用与 GBM 主要分子类别常相关的反复出现的改变,进行了探索性分层,包括 NF1 改变、EGFR 改变和 PDGFRA 扩增 [25]。该分析显示,NF1 突变肿瘤以及不伴 EGFR 突变的 EGFR 扩增肿瘤与较长的总生存期(OS)相关,而 PDGFRA 扩增肿瘤与较短的总生存期相关(图 S1)。由于各类别病例数较少,应谨慎解读这些发现。
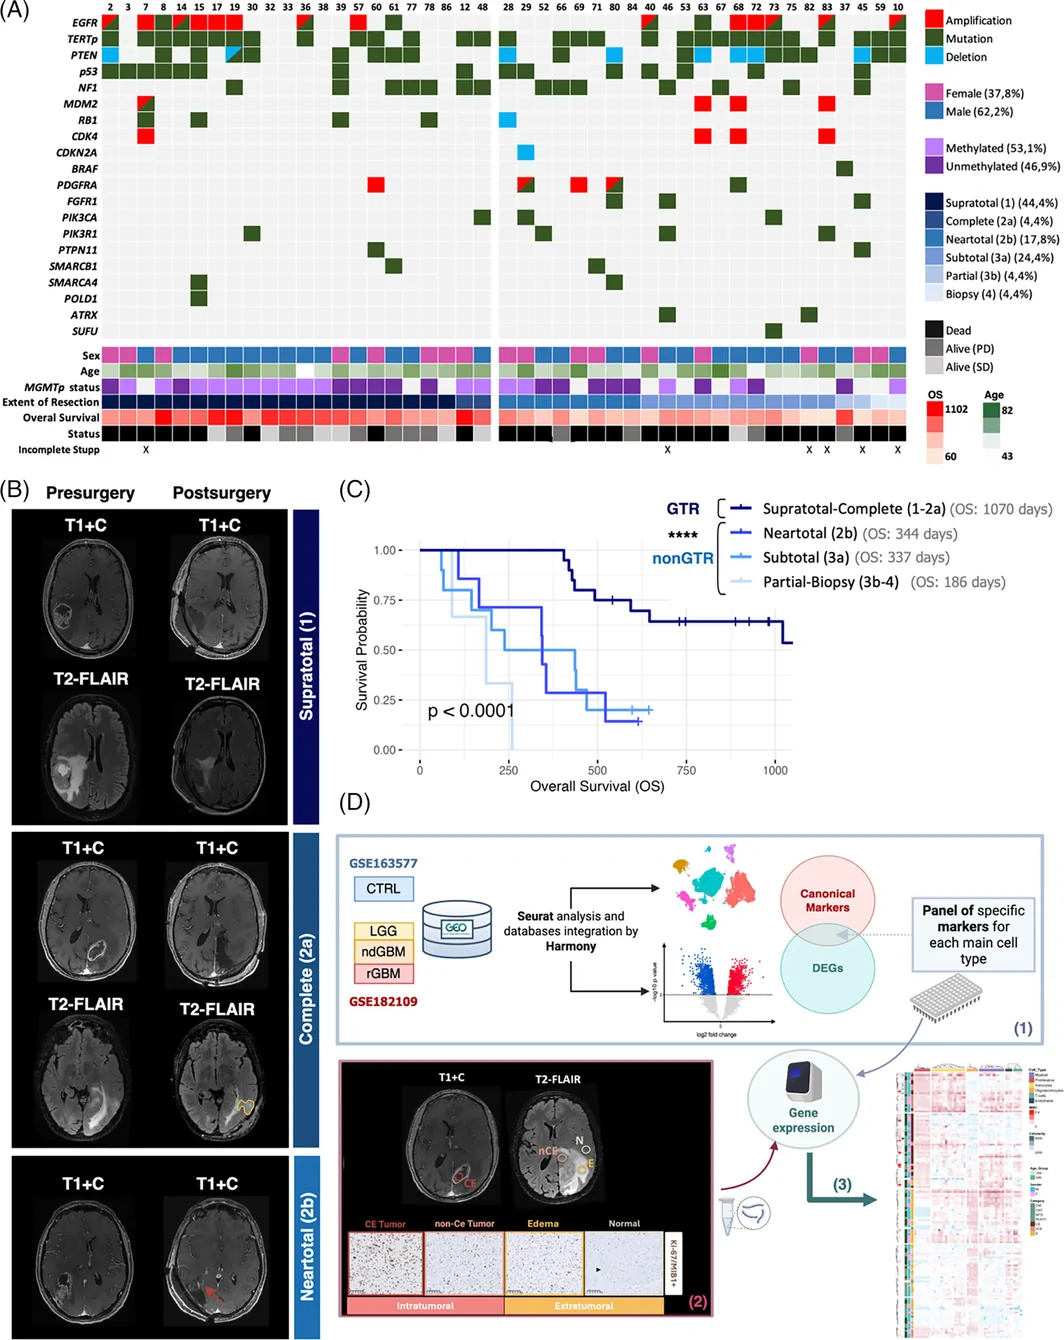
根据 RANO 标准 [7],对每例患者的切除程度进行分类:(i)超全切除(1 类):切除全部 CE 肿瘤,残留 nCE 肿瘤少于 5 cm3;(ii)完全切除(2a 类):切除全部 CE 肿瘤;(iii)近全切除(2b 类):残留 CE 肿瘤少于 1 cm3;(iv)次全切除(3a 类):残留 CE 肿瘤为 1 至 5 cm3;(v)部分切除(3b 类):残留 CE 肿瘤超过 5 cm3;以及(vi)活检(4 类):未减少肿瘤量(图 1B)。
在我们的队列中,术后即使存在小片 CE 肿瘤,也会对患者预后产生显著影响。接受近全切除与次全切除手术的患者之间,OS 无显著差异(图 1C)。因此,为提高相关性研究的统计效能,我们将患者分为两类:(i)GTR(接受 CE 肿瘤完全切除者,即超全切除和完全切除)和(ii)非 GTR(近全切除、次全切除、部分切除和活检)(图 1C)。值得注意的是,正如预期,非 GTR 组 95% 的病例在手术区域附近发生肿瘤复发。然而,我们观察到,在接受 CE 肿瘤完全切除的患者中,有 45% 的复发肿瘤出现在与手术腔分离的区域(图 S2A,B)。尽管 GTR 组局部复发与远处复发的复发时间无差异,但接受非 GTR 且发生局部复发的患者,其复发时间明显缩短(图 S2C)。
从入组患者的不同影像学区域(N、E、nCE 和 CE)采集活检标本(附录 S2)。部分样本进行新鲜冷冻,用于 RNA 提取和逆转录,随后采用通过公共存储库计算机分析获得的基因检测组合进行转录组分析。其余样本经石蜡包埋后用于 IHC 分析。总体流程详见图 1D。
样本的免疫组织化学特征分析
为开始表征 MRI 引导获取的样本,我们使用 Ki67/MIB‐1 抗体进行了 IHC 染色。自动定量 MIB1(Ki-67)指数和细胞密度(每个视野的总细胞数)(图 2A)。MIB1(Ki-67)染色常用于表征 GBM 细胞的增殖状态。有报道提示,在肿瘤核心,该染色不仅标记肿瘤细胞,还标记间质细胞,如增殖性内皮细胞和髓系细胞 [26]。我们使用 SOX2(标记肿瘤细胞)、CD68(标记髓系细胞)和 Ki67 抗体对周边样本进行了 IF 染色(图 2B)。尽管 SOX2 并非完全特异或敏感的 GBM 细胞标志物,但此处仅将其用于定性验证,旨在排除周边样本中非肿瘤性细胞对 MIB1(Ki-67)信号的主要贡献。定量结果显示,在大多数病例中,GBM 周边区域的大部分增殖细胞确实为肿瘤细胞(图 2C),提示 MIB1(Ki-67)指数可用作肿瘤核心以外区域肿瘤浸润程度的读出指标。
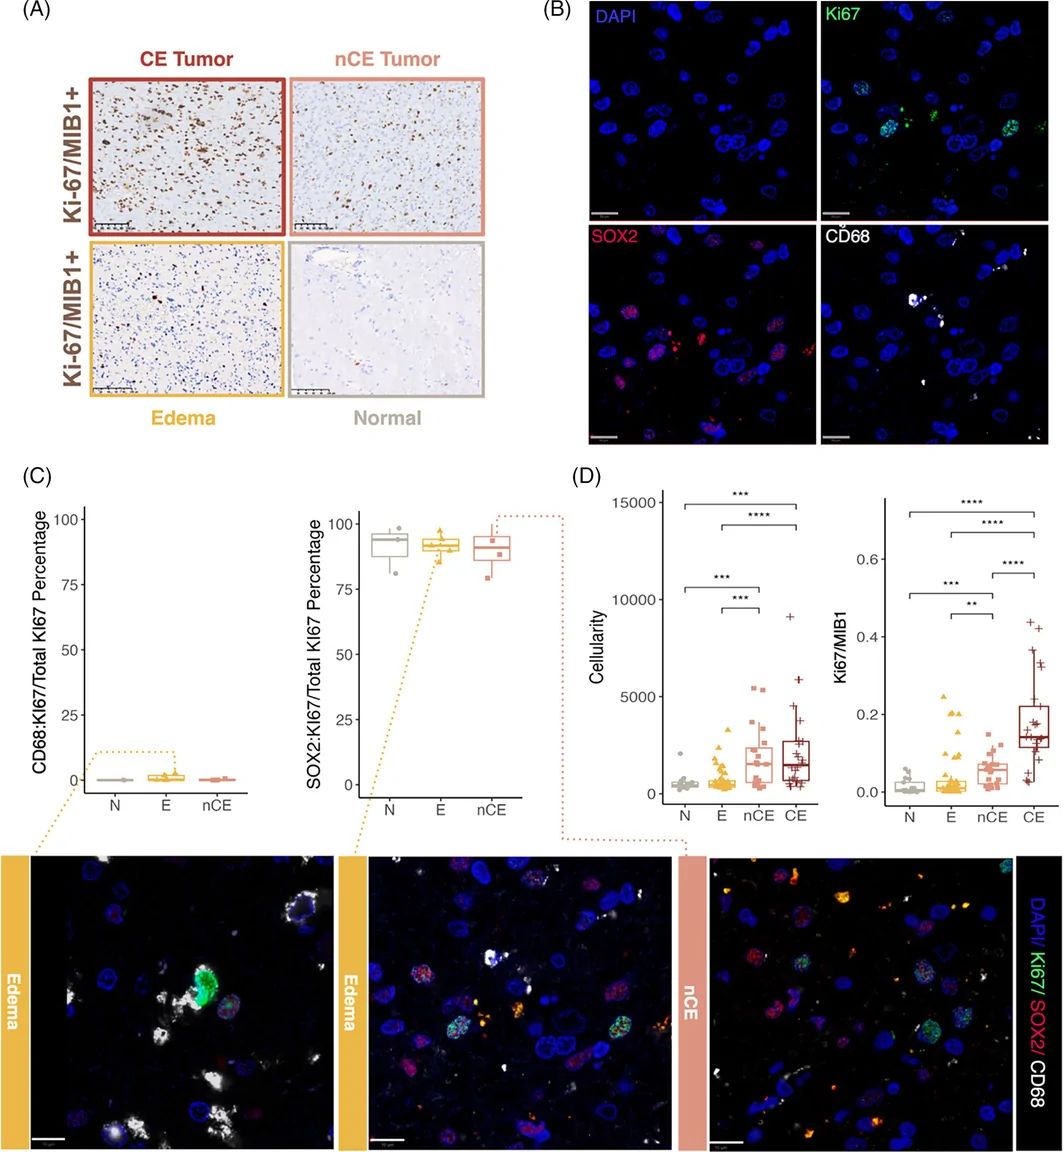
正如预期,CE 肿瘤区域的活检标本具有最高的细胞密度和增殖指数(图 2D)。然而,nCE 肿瘤样本中的 MIB1(Ki-67)+ 细胞百分比显著高于 MRI 判定为非成瘤性的区域(水肿和正常区域),其细胞密度则与 CE 活检标本相近(图 2D)。值得注意的是,在 nCE 肿瘤样本中,这两个参数与生存的相关性最强。较高的 MIB1(Ki-67)与较好的 OS 相关,而较高的细胞密度与较差的 OS 相关,但未达到统计学显著性(图 S3A)。
我们以图形展示了不同活检组的这两个细胞参数。利用水肿和正常脑活检标本的数值,依据 MIB1(Ki-67)指数的第一四分位数定义了“病理性”范围(高于 2.5%)(见图 S2B 中的虚线)。正如预期,所有 CE 样本和大多数 nCE 肿瘤样本(72.0%)均显示病理性特征。在我们的队列中,神经病理医师将一些细胞密度较高但 MIB1(Ki-67)% 极低的活检标本归类为反应性胶质增生,尽管在这种情况下,细胞密度增加可能反映了不同非肿瘤性细胞群的贡献。有趣的是,我们的分析发现,若干归类为水肿的活检标本(33.3%),以及少数影像学正常样本(22.2%),显示出较高的 MIB1(Ki-67)水平(图 S3B)。
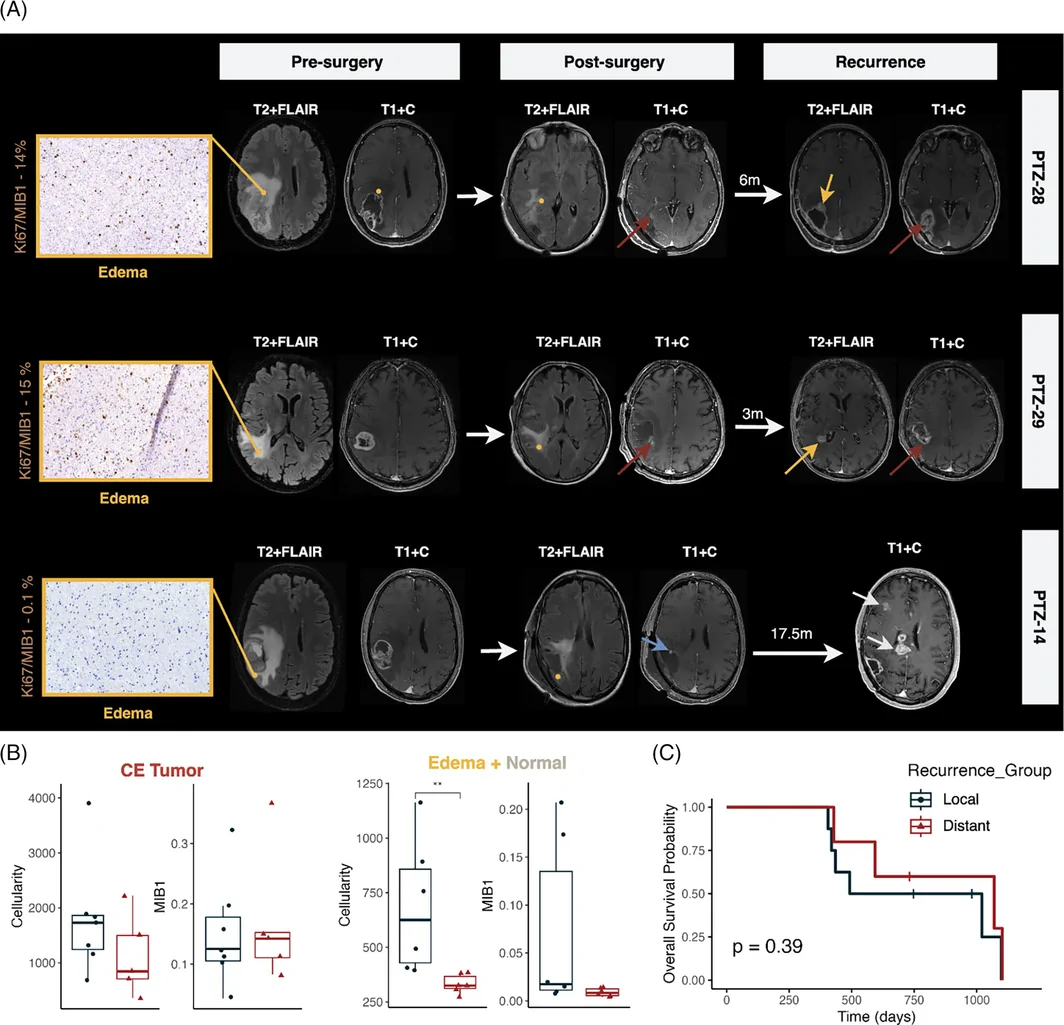
我们分析了部分患者的病情进展,这些患者在影像学归类为水肿或正常区域的活检标本中存在肿瘤浸润征象(图 3A)。术后 MRI 显示,患者 PTZ-28 和 PTZ-29 存在小片残留 CE 肿瘤区域(近全切除)(棕色箭头)。然而,两例患者术后均还残留了存在肿瘤浸润征象的水肿区域(黄色圆点)。两份活检标本均位于远离 CE 肿瘤的位置:PTZ-28 为 5 mm,PTZ-29 为 11 mm。术后很快(分别为 6 个月和 3 个月),残留 CE 肿瘤及残留水肿区域均发生肿瘤复发。患者 PTZ-14 接受了超全切除;但仍残留一处 MIB1(Ki-67)指数较低的水肿区域(黄色圆点),距核心 4 mm。该患者在术后 17.5 个月,在远离切除腔及水肿活检取样区域的多个部位出现肿瘤复发征象(白色箭头)(图 3A)。这些观察进一步支持以下观点:部分 GBM 患者存在超出 CE 和 nCE 区域的肿瘤浸润,如果未予手术切除,可能导致肿瘤迅速复发。与这一观点一致,我们分析了接受 GTR 的患者,发现非肿瘤区域(E + N)的高细胞密度与局部复发相关。然而,在 CE 肿瘤样本中未发现这种关联(图 3B)。生存分析显示,局部复发组与远处复发组的总生存期无统计学显著差异,但远处复发患者呈现生存期更长的趋势(图 3C)。
活检标本队列的转录组分析
GBM 周边区域的肿瘤微环境与肿瘤核心显著不同。为更好地表征我们的 GBM 活检队列,我们测量了代表不同神经细胞类型的所选基因的表达。利用公开 scRNA-seq 数据库的整合图谱 [20](补充图 S4),我们鉴定出不同的免疫细胞(髓系和淋巴系)、星形胶质细胞、少突胶质细胞及血管细胞(内皮细胞和周细胞)簇(图 4A)。我们还检测到两个过表达多种细胞增殖相关基因的细胞簇:胶质细胞簇(C6)和髓系细胞簇(C8)(图 4A)。经过多轮优化,我们筛选出每种细胞类型的特异性基因集(补充图 S5),并确认其在不同细胞簇中的差异表达(图 4B)。在两个独立的单核(图 S6A)和单细胞(图 S6B)数据集中的验证进一步支持了这些发现,证实了所选标志物预期的谱系特异性以及在本队列中观察到的区域性趋势。
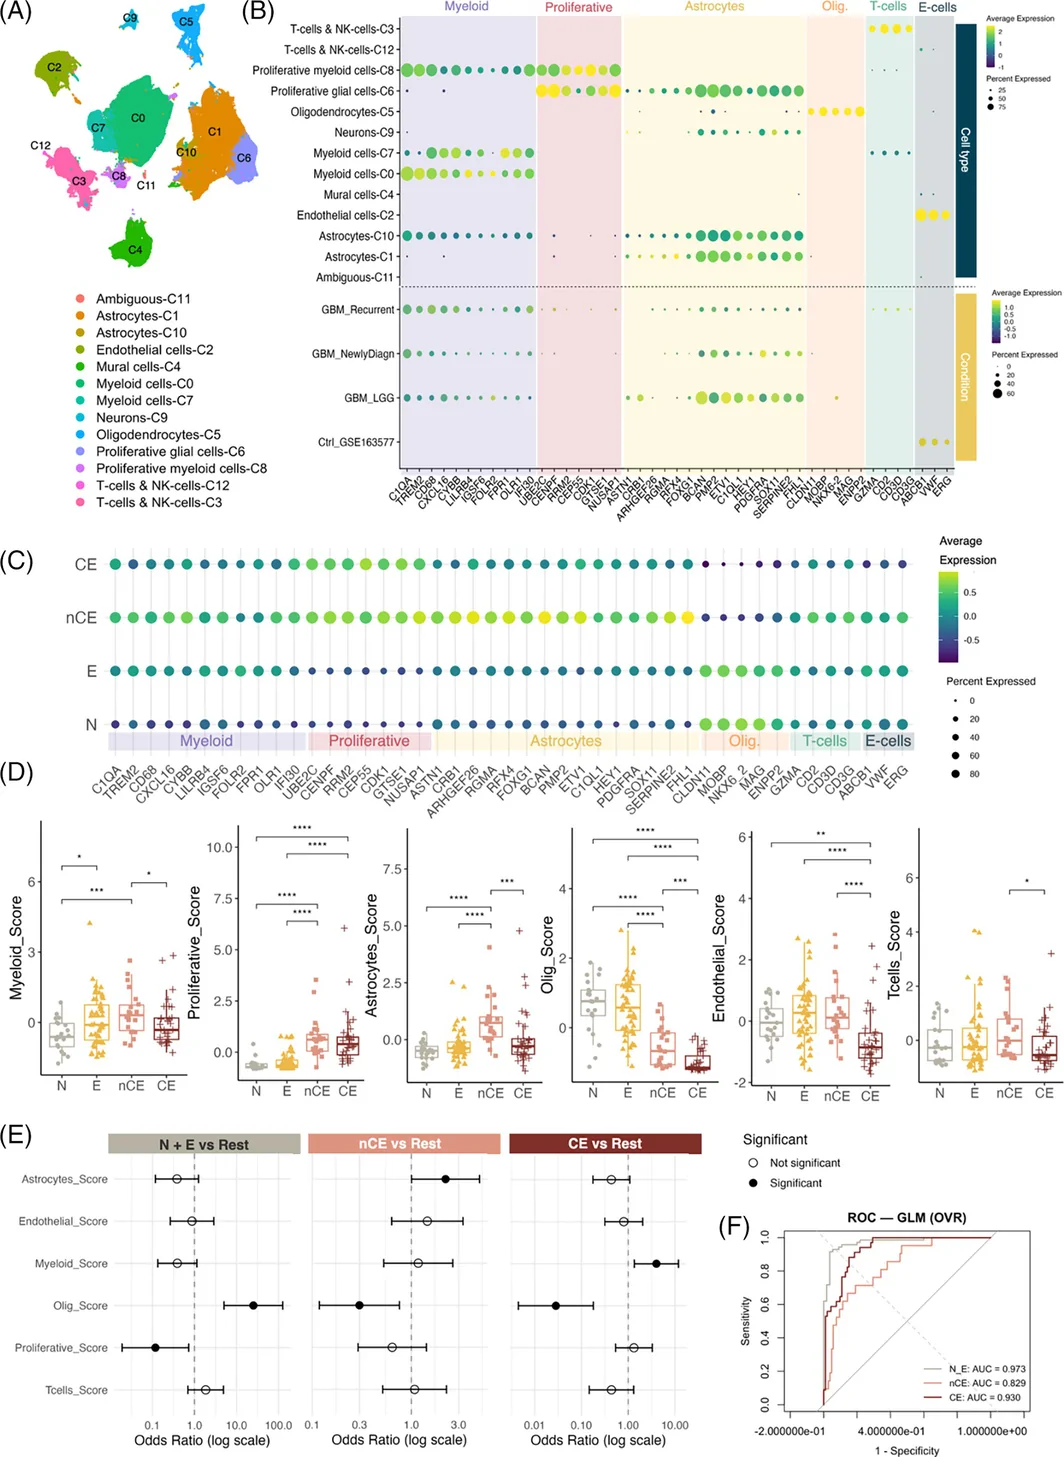
我们采用 qRT-PCR 定量所选基因的表达,并评估单个基因和细胞类型评分在不同影像学区域中的分布。如图 4B 所示,通过汇总分配给各细胞类型的预定义标志物基因的表达,计算细胞类型评分(见第 2 节)。与其他非成瘤性区域相比,CE 和 nCE 肿瘤样本的增殖标志物表达较高,少突胶质细胞相关基因则显著减少(图 4C,D)。在一个独立的 snRNA-seq 数据集中也观察到类似的区域性趋势,其中 TE/TC 样本富集增殖和星形胶质细胞程序,而 PT 样本显示少突胶质细胞相关信号相对富集(图 S7A)。与其他影像学区域相比,CE 肿瘤样本的内皮相关标志物表达降低。这一下降可能反映了经典内皮标志物识别 GBM 异常血管状态的能力有限。与 CE 样本相比,nCE 肿瘤活检标本富集星形胶质细胞、内皮细胞、髓系细胞及 T 细胞标志物。水肿组织的髓系基因表达也高于正常组织,这是这两个区域之间唯一的显著差异(图 4C,D)。对 qRT-PCR 衍生分子评分进行无监督主成分分析(PCA),发现 MRI 定义的区域之间存在结构化变异,CE/nCE 样本主要沿少突胶质细胞–增殖轴与正常/水肿样本分离(图 S7B)。在独立 snRNA-seq 队列中,对模块评分进行 PCA,也观察到类似的区域相关结构(图 S7C)。由于 E 和 N 样本高度相似,后续分析中将其合并(N + E),以提高统计稳健性。
为评估细胞类型评分在区分影像学区域方面的预测价值,我们采用了多类别广义线性模型(GLM,一对其余类别)(图 4E)。重要的是,这一建模方法被用作生物学推断框架,而非临床预测工具。该分析显示,少突胶质细胞评分和增殖评分是区分 N + E 区域最有力的指标。然而,较高的增殖评分显示出负向关联。与 N + E 区域相比,nCE 和 CE 区域的少突胶质细胞评分均降低,从而能够有效区分这些组。此外,星形胶质细胞评分和髓系细胞评分分别有助于 nCE 和 CE 样本的分类(图 4E)。该模型在所有类别中均表现稳健,N + E、nCE 和 CE 的 AUC 分别达到 0.973、0.829 和 0.930(图 4F)。然而,LASSO 后分析和 XGBoost 分析显示,只有少突胶质细胞评分和增殖评分仍是稳定一致的预测指标,且对 nCE 的预测能力下降(图 S8A–C)。
为改善对 nCE 的区分,我们将组织学变量、细胞密度及 MIB1(Ki-67)表达纳入模型(图 S8D–F)。在该模型中,MIB1(Ki-67)有助于区分 nCE 和 CE 样本,使模型在所有类别中均表现稳健(AUC:N + E 为 0.974,nCE 为 0.857,CE 为 0.946;图 S8E)。XGBoost 特征重要性分析突出显示少突胶质细胞、增殖及星形胶质细胞评分是关键预测指标,强调了细胞组成和组织学特征在区域分类中的作用(图 S8F)。
样本的无监督聚类
对 qRT-PCR 表达数据进行无监督聚类,证实为不同细胞类型筛选的基因沿 x 轴聚集在一起(图 5A)。在样本分类方面,我们将其分为五个簇,这一划分得到累积分布函数(CDF)图、面积增量图和样本追踪图的支持。这些图显示,当 K = 5 之后,簇间分离的增益逐渐减小(图 S9A)。通过主成分分析(PCA)和均匀流形逼近与投影(UMAP)进一步确认了聚类的稳健性和可分离性(图 S9B)。
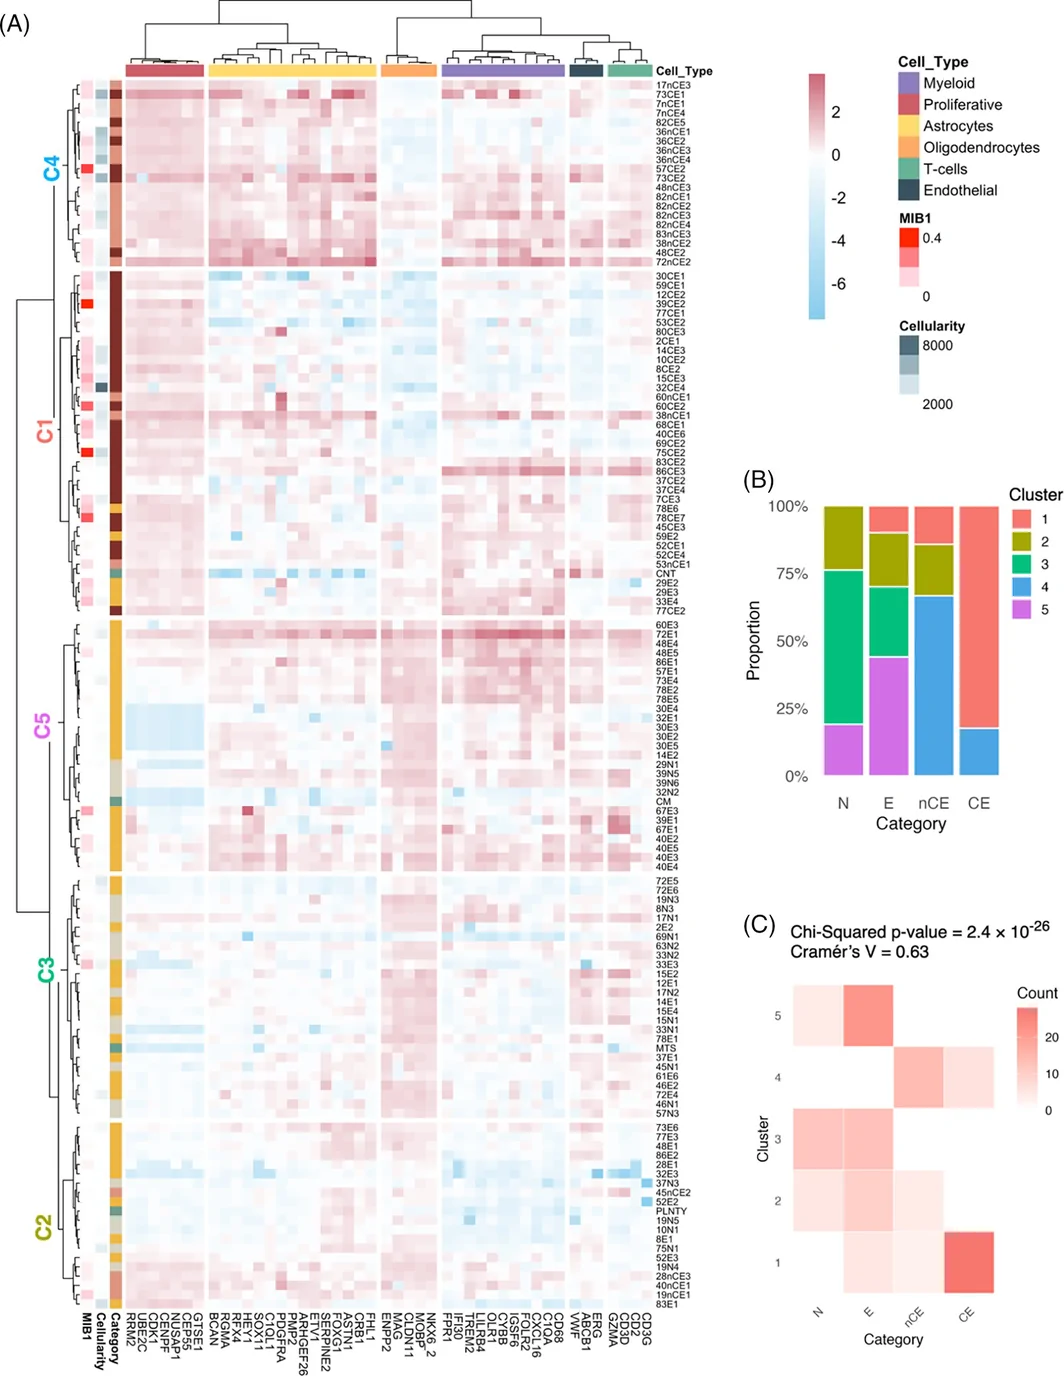
我们观察到 CE 与 nCE 肿瘤样本高度相似,它们共同聚集于簇 1(C1)和簇 4(C4)(图 5A,B)。这两个簇均富集增殖标志物,且相较于其他三个簇,少突胶质细胞标志物表达较低。值得注意的是,富集 nCE 样本的 C4 显示出更高水平的增殖、星形胶质细胞及内皮细胞标志物(图 S9C)。
有趣的是,部分影像学归类为水肿的样本与 CE 和 nCE 活检标本共同聚集于 C1,提示这些区域可能代表肿瘤浸润区域(图 5A,B)。然而,大多数瘤周样本分布于另外三个簇(C2、C3 和 C5)。与 C3 和 C2 相比,C5 的星形胶质细胞、少突胶质细胞、髓系细胞及内皮细胞评分明显升高。相反,与 C3 和 C5 相比,C2 的 T 细胞和少突胶质细胞评分显著降低(图 S9C)。这种聚类模式与影像学分类一致,卡方检验显示簇归属与样本类别之间存在显著关联,证实了这一点(χ 2 = 163.68,d.f. = 28,p < 2.2 × 10⁻¹⁶)(图 5C)。
我们还纳入了少量非 GBM 疾病患者影像学正常区域的活检标本:一例海绵状血管畸形(CM)、一例脑挫伤(CNT)、一例脑转移瘤(MTS)和一例多形性低级别神经上皮肿瘤(PLNTY)。值得注意的是,CNT 活检标本与若干 nCE 及水肿活检标本共同聚集于 C1,显示较高水平的增殖和髓系标志物(图 5A)。相反,另外三份活检标本分别在 C5(CM)、C3(MTS)和 C2(PLNTY)中与非成瘤性活检标本聚类,均显示低增殖标志物表达和高内皮标志物表达(图 5A)。
基因检测组合表达的预后价值
为评估临床因素与基因检测组合表达的联合作用,我们拟合了一个将切除程度、年龄和性别作为协变量的总体 Cox 模型(图 S10A)。随后,我们在各影像学区域内进行多变量 Cox 回归,并校正这些临床协变量(图 6A)。在各类细胞评分中,只有少突胶质细胞评分与患者结局存在显著关联。具体而言,该评分在 nCE 样本中与较好预后相关,但在 CE 样本中与较差预后相关。采用 LASSO 后回归优化变量筛选后,唯一具有显著性的发现是 CE 区域少突胶质细胞评分与较差预后的关联(图 S10B)。
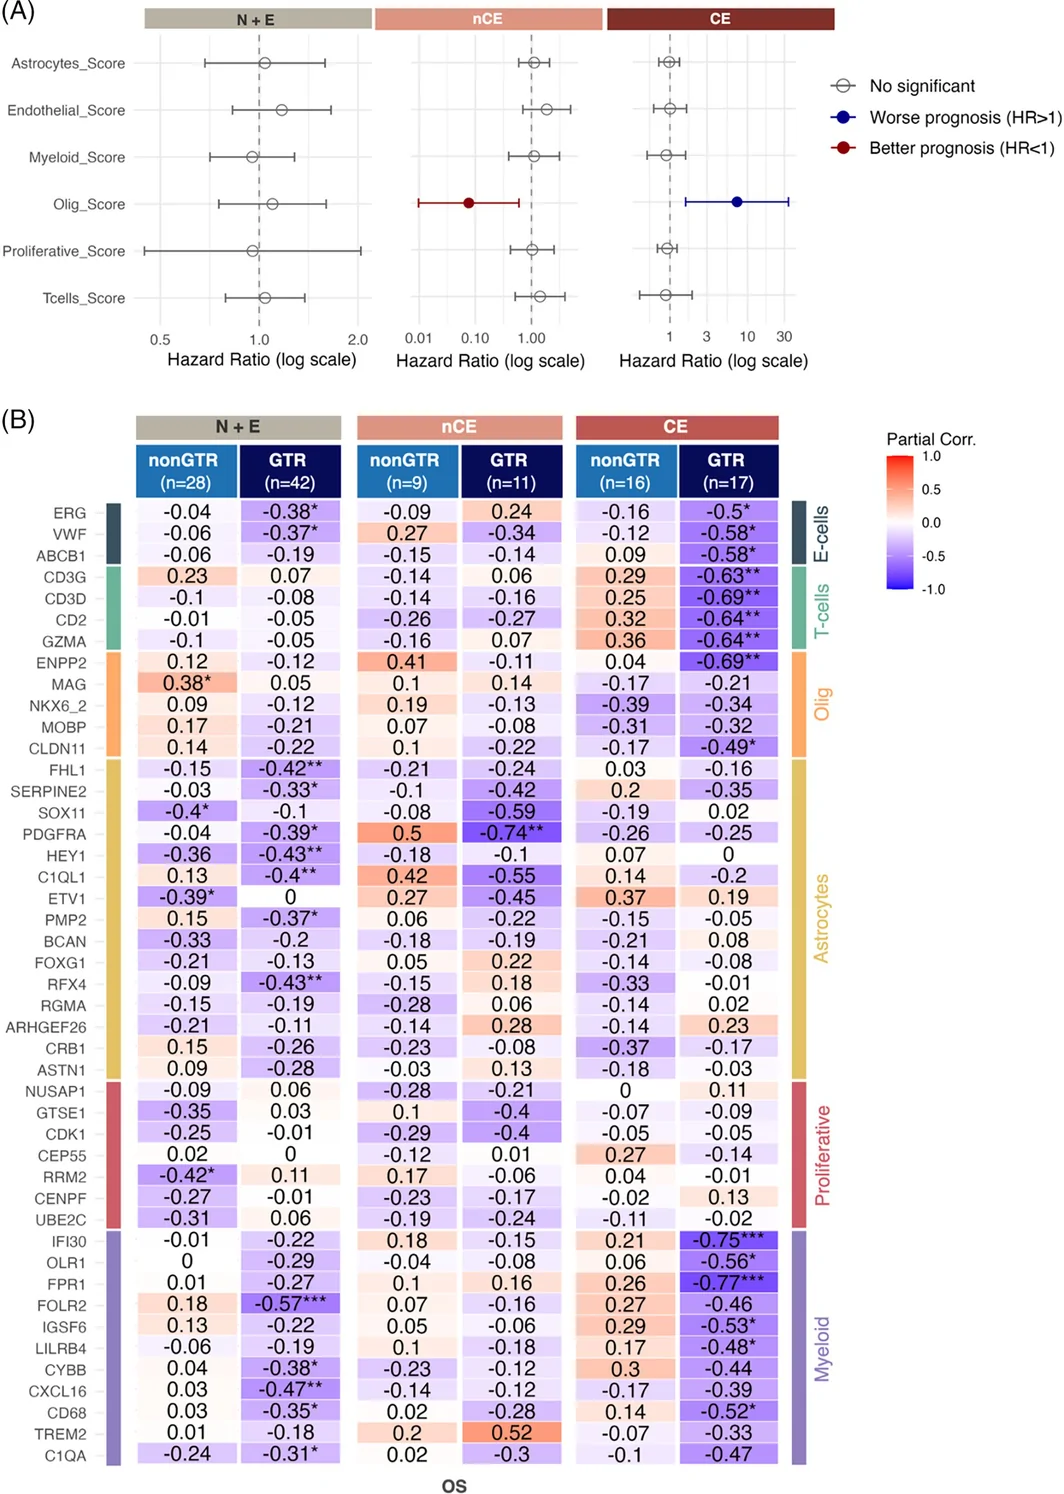
为探究单个基因的临床相关性,我们按切除程度和影像学区域对患者分层,对基因表达水平与 OS 进行偏相关分析。在非肿瘤样本(N 和 E)中,内皮、星形胶质细胞及髓系基因的表达与较差的 OS 相关,但这种关联主要见于接受 GTR 的患者(图 6B)。这一发现提示,正如预期,肿瘤核心切除后,这些样本的细胞表型对疾病进展的影响更大。在 nCE 活检标本中,可能由于样本量较小,仅少数星形胶质细胞基因在 GTR 组中与较差的 OS 相关(图 6B)。在 CE 样本中,多种免疫、血管及少突胶质细胞基因在 GTR 患者中与预后呈负相关(图 6B),提示即使 CE 完全切除后,肿瘤核心的表型仍会影响疾病进展。有趣的是,在接受非 GTR 切除的患者中,某些髓系和 T 细胞相关基因的较高表达与生存改善相关,尽管未达到显著性(图 6B)。这提示,GBM 肿瘤的免疫微环境对疾病进展的影响会随切除程度不同而相反。
讨论
GBM 仍是最难治疗的癌症之一,近几十年来仅有少数临床试验获得成功。将手术切除范围扩大至 nCE 肿瘤区域,是一种已显著改善 GBM 患者 OS 的方法 [5, 6, 7]。近期多项单细胞和空间组学研究表征了 GBM 边缘及白质微环境中的浸润性肿瘤细胞,凸显了非强化区域在生物学上的独特性 [13, 14, 15, 16, 27, 28, 29, 30]。然而,这些研究并未系统区分影像学定义的血管源性水肿与 nCE 肿瘤,也未将这些区域与标准化切除程度类别相结合。在我们包含 161 份 MRI 引导活检标本的队列中,每份样本均被前瞻性归入 CE、nCE、水肿或影像学正常区域,从而能够直接通过组织学及靶向转录组学对影像学标签进行验证。这一设计显示,在大多数情况下,nCE 区域与 CE 核心在生物学上无法区分,尤其是在细胞密度、增殖基因表达以及少突胶质细胞表达丧失方面。这些发现进一步强化了超全切除的价值,强调了手术在 GBM 治疗方案中的重要性,并支持在条件允许时尽可能扩大 nCE 肿瘤切除范围的观点。
在开展更广泛的 GBM 切除时,区分 nCE 肿瘤与水肿仍是一项主要挑战,因为这两个区域在 FLAIR 序列上均表现为高信号区。这一区分往往依赖主观影像学标准,且术后尤为困难 [7, 31]。除描述性价值外,少突胶质细胞特征丧失与增殖相关基因激活的组合,界定了一个可方便地应用于常规神经病理工作流程(如 qRT-PCR 或 IHC)的最小标志物组合。该组合可能有助于从生物学角度验证用于区分 nCE 肿瘤与水肿的影像学生物标志物,并为今后开发旨在表征瘤周浸润的术前生物标志物(基于 MRI 特征或液体活检)提供机制框架。
我们的数据提示,某些此前在 MRI 扫描上被判定为血管源性水肿、甚至正常组织的区域,可能存在显著的肿瘤浸润。这些发现凸显了迫切需要改进术前和术中工具,以更准确地勾画 GBM 受浸润的周边区域。关键在于,这些工具应与系统的组织学和分子验证相结合,以确保其真正反映肿瘤浸润程度。在这方面,我们的结果证实,MIB1(Ki-67)染色和细胞密度评估是可靠的组织病理学指标,尤其适用于周边区域。值得注意的是,Kuroda 等近期采用灌注引导的立体定向取样,对 GBM 中的 CE、nCE 和水肿进行比较,显示 nCE 的 Ki-67 指数和细胞密度显著高于水肿,而 CE 和 nCE 肿瘤区域均显示相似的高细胞密度 [17]。这一模式与我们的 MRI 引导队列中观察到的 MIB1(Ki-67)标记和细胞密度梯度高度一致,进一步表明影像学 nCE 通常对应浸润性肿瘤,而血管源性水肿的细胞密度相对较低。我们的研究在一个更大的前瞻性系列中,整合了所有影像学定义区域(包括影像学正常组织)按细胞类型解析的转录表达谱,从而拓展了这些发现。在此背景下,周边浸润不仅与增殖程序表达增加相关,更显著的是,与少突胶质细胞分化特征的明显丧失相关,其中包括髓鞘调控基因。在所检测的所有参数中,少突胶质细胞分化评分在区分 CE 和 nCE 肿瘤区域与瘤外组织方面具有最强的预测能力。
与其他微环境成分相比,成熟少突胶质细胞在 GBM 进展中的作用仍不明确。既往研究提出了相反的机制:富含髓鞘的微环境可能促进肿瘤细胞分化并减缓进展 [27],而巨噬细胞吞噬髓鞘则可促进增殖和复发 [32]。相比之下,有报道指出,复发更常发生在切除腔邻近的白质中,这可能得到少突胶质细胞谱系促肿瘤信号及增强的新生血管形成的支持 [33, 34]。值得注意的是,已有研究描述复发性 GBM 中少突胶质细胞和神经元富集 [35],提示这些细胞群可能在治疗压力下持续存在或重新出现。
需要指出的是,我们研究中使用的少突胶质细胞相关标志物主要与已分化/形成髓鞘的少突胶质细胞相关,因此不应将其理解为能够反映近期在 GBM 中描述的反应性少突胶质细胞状态。具体而言,一些研究表明,GBM 相关少突胶质细胞可能获得炎症性或干扰素反应性表型,包括以 CCL5 分泌或 C4B 和 SERPINA3 等疾病相关标志物为特征的反应性状态;这些状态在概念上不同于我们检测组合所代表的成熟少突胶质细胞程序 [36, 37]。因此,我们的发现更可能反映不同影像学区域中成熟少突胶质细胞相关程序的相对保留或丧失,而不是支持肿瘤的反应性少突胶质细胞富集。尽管如此,这些研究为解释情境依赖的少突胶质细胞功能提供了有用的机制框架。我们的结果进一步提示,少突胶质细胞谱系细胞的影响高度依赖其位置。在周边区域,少突胶质细胞分化标志物的保留,可能反映出相对完整的髓鞘形成微环境,该环境限制肿瘤可塑性,并支持更加分化的肿瘤状态。相反,在以轴突破坏和炎症信号为特征的 CE 区域内 [38],残留少突胶质细胞可能呈现反应性或干扰素相关状态,无法维持有效的髓鞘再生,转而促进支持肿瘤的信号传导。因此,CE 区域少突胶质细胞高评分与较差预后的关联,很可能反映少突胶质细胞功能状态的质性变化,而不仅是细胞丰度差异。综合而言,这些数据支持少突胶质细胞谱系细胞对 GBM 演进具有双重的、位置特异性的作用,强调了整合空间和功能分辨能力开展机制研究的必要性。
我们的组织学和转录组学分析显示,相较于 CE 活检标本,nCE 肿瘤区域的 MIB1(Ki-67)染色较低,而内皮标志物升高。肿瘤核心中经典内皮标志物表达降低,并不与微血管增生的存在相矛盾,而更可能反映内皮去分化和血管可塑性,包括成熟内皮标志物无法反映的异常血管生成程序及血管拟态 [39, 40]。此外,所观察到的内皮和增殖变化提示,强化与非强化区域具有不同的肿瘤表型。此前对 GBM 周边区域的单细胞和空间转录组分析已提出这一观点 [15, 16, 29]。此外,既往研究显示,复发性 GBM 非强化区域的肿瘤细胞表达与较低级别胶质瘤(LGG)相关的基因 [30]。与此一致,我们在 nCE 肿瘤活检标本以及 LGG 中观察到所选星形胶质细胞基因的高表达水平(图 4B)。这些发现意味着,与肿瘤核心相比,周边区域的肿瘤细胞可能侵袭性较低和/或对治疗反应更好。事实上,已有研究表明,来源于边缘区域的细胞对照射更加敏感 [41]。这些结果可能解释接受 GTR 的患者与术后残留 CE 肿瘤患者之间的生存差异。此前一项挪威研究记录到,相较于近全切除,CE 完全切除具有显著生存获益。这提示,即使极少量的残留 CE 肿瘤也可能影响疾病进展和/或治疗反应 [42]。需要在更大队列中开展具有详细术后 MRI 测量的进一步研究,以验证这些发现。这可支持在残留肿瘤可切除的患者中评估二次探查手术的安全性和获益。
大量 GBM 研究聚焦于肿瘤核心,该处的生长机制受到缺氧、坏死和血管生成等微环境压力的强烈影响。然而,对于接受 GTR 的患者,这一研究重点的相关性可能较低。在这些病例中,复发主要由浸润周围脑实质的残留肿瘤细胞驱动。这些细胞所承受的选择压力与肿瘤核心并不相同。尽管这一区别在理论上十分重要,但根据残留肿瘤体积评估治疗反应的临床试验仍然很少。Ellingson 等的一项开创性研究发现,术后残留 CE 肿瘤体积是新诊断 GBM 患者 OS 的独立预后因素,与治疗类型无关 [43]。值得注意的是,在无残留 CE 肿瘤且接受组蛋白去乙酰化酶抑制剂伏立诺他治疗的患者中,长期生存者所占比例格外高 [43, 44]。相反,一些免疫治疗在术后存在残留 CE 肿瘤的患者中显示出更高疗效 [45]。与这些观察一致,我们发现,肿瘤核心免疫相关基因的表达在存在残留 CE 病灶的患者中与 OS 呈正相关,而在接受 GTR 的患者中与 OS 呈负相关。这些发现提示,核心与浸润性肿瘤细胞的治疗易感性可能存在显著差异,这一概念得到既往研究的支持 [28]。此外,这些结果强调了根据术后是否存在残留 CE 肿瘤对 GBM 患者进行分层,并据此制定个体化治疗策略的重要性。它们还支持在 GBM 临床试验中以标准化方式评估切除程度的必要性,以减少研究组间的预后不均衡,并根据残留病灶的范围和性质确定特定治疗。
对于 CE 活检标本中免疫相关基因表达产生不同预后效应的另一种解释,基于近期报道的切除程度在不同肿瘤亚组中重要性的差异。已有文献指出,间充质型和低神经特征肿瘤的患者,其肿瘤免疫细胞含量高,并不能从广泛手术中获益 [46, 47]。这意味着,在 GTR 组中,较好的 OS 会与减弱的免疫表型相关。相反,在非 GTR 组中,免疫表型增强的患者会比其他患者具有更好的 OS。因此,鉴定用于 GBM 肿瘤分类的术前生物标志物极为重要,例如影像学参数或可在液体活检中检测的分子。除年龄、肿瘤位置及患者状态等其他临床变量外 [6, 8],这些生物标志物还可指导手术决策,帮助确定最大范围切除还是更保守的方法对患者更有利 [48]。
已有许多因素被提出用于解释 GBM 临床试验的高失败率。一个重要但常被忽视的局限是过度依赖手术切除的 CE 组织。这一方法无法反映肿瘤周边区域的生物学异质性,也不能反映接受完全切除患者残留病灶的生物学特征。本研究旨在通过提供一个表征肿瘤边缘的细胞和分子框架来弥补这一缺口。然而,应承认本研究存在若干局限。首先,队列规模相对有限,限制了我们确认超全切除较完全切除的临床获益的能力,也可能降低了某些细胞和分子特征的预后效能。此外,每个基因组类别中的病例数较少,无法基于共现改变进行更稳健的亚组划分。在 GTR 和非 GTR 患者中进行的探索性亚组分析,未发现依据最常见突变改变进行的一致性生存分层(数据未展示),但鉴于样本量有限且这些比较的统计效能降低,应谨慎解读这些发现。此外,部分病例缺少 MGMT 启动子甲基化状态资料,不过这一局限并未改变我们在队列中观察到的主要预后关联。最后,该靶向基因检测组合旨在对影像学定义的区域进行稳健且可实施的表征,因此无法区分功能不同的星形胶质细胞或髓系细胞状态,而这些状态已知会影响 GBM 进展。
空间异质性是 GBM 浸润研究固有的挑战。尽管手术安全性限制了每例患者可获取的活检数量,但对大型影像学分层队列进行分析,仍能得出稳健的群体层面结论。靶向转录组数据的无监督分析显示,样本部分按照影像学类别聚类,支持不同肿瘤之间存在共同的生物学特征,同时也凸显了水肿及影像学正常区域内仍存的变异。在肿瘤内部层面,来自同一影像学区域的大多数样本显示一致的特征谱,尽管浸润性特征偶尔仅限于部分活检标本,这提示 GBM 浸润并非均匀地呈放射状扩展,而可能沿优先的解剖或微环境路径发生。要更详细地解析这些模式,需要将更高分辨率的单细胞和空间方法与先进影像及解剖定位相结合。此外,由于本研究为观察性研究,仍需进行功能验证,以确定所鉴定的基因特征与预后或治疗反应之间是否存在因果关系。
尽管存在局限,我们的发现有助于弥合神经影像学、组织病理学与浸润性肿瘤边缘分子表达谱分析之间的差距。本文呈现的结果也凸显了基于 MRI 勾画范围的局限,并提供了分子和组织学工具,以更好地表征手术切缘并完善患者分层。将这些标志物整合到神经病理工作流程中,有望更准确地界定每例患者的肿瘤浸润表型。这可支持更加个体化的治疗策略,并改善 GBM 患者的结局。
- Design: 161 intraoperative biopsies prospectively collected from 45 GBM patients, classified by MRI as contrast-enhancing (CE) tumor, non-contrast-enhancing (nCE) tumor, vasogenic edema or radiologically normal tissue; MIB1 IHC for proliferation and cell density, plus targeted transcriptional profiling of immune, glial and vascular markers selected from scRNA-seq data.
- Findings: most nCE biopsies were neoplastic — high cellularity, proliferative markers and loss of oligodendrocyte signatures — but some edema-labeled regions also contained infiltrating tumor cells and were associated with progression: MRI classification of nCE is generally accurate but underestimates infiltration in edema.
- Prognosis: after gross-total resection, high peripheral cellularity predicted earlier local recurrence; immune-related phenotypes were associated with worse outcome only after complete resection of the enhancing tumor; the gene panel (particularly oligodendrocyte markers) carried prognostic information depending on biopsy location and extent of resection.
- Implication: assessing cell density and MIB1 in the periphery can refine recurrence-risk stratification; the authors argue for integrating histological and molecular evaluation of the tumor periphery into surgical and therapeutic decisions. Figures 1–6 included.
Scope: PMC open-access full text (CC BY-NC-ND 4.0) — abstract, introduction, methods, results and discussion, Figures 1–6 with captions. Author contributions, funding, conflicts, ethics statements, supporting information and references are not included.
Abstract
Glioblastoma (GBM) is one of the deadliest cancers, largely due to its nearly inevitable recurrence driven by residual tumor cells. Recent evidence suggests that performing supratotal resections that extend into non‐contrast‐enhancing (nCE) tumor regions may prolong survival. However, tumor infiltration in these areas has not been fully characterized. Our goal was to define the cellular landscape of the GBM periphery and its clinical relevance. To accomplish this, we prospectively collected 161 biopsies from 45 GBM patients. The samples were classified using magnetic resonance imaging (MRI) as either enhancing tumor, nCE tumor, vasogenic edema, or radiologically normal tissue. We performed immunohistochemistry with MIB1 staining to detect proliferative cells and measure cell density. We also performed transcriptional profiling, selecting immune, glial, and vascular markers from single‐cell RNA sequencing data. We analyzed the associations with the extent of resection and patient outcomes. Most nCE tumor biopsies displayed neoplastic features, including high cellularity, proliferative markers, and loss of oligodendrocyte signatures. However, some regions labeled as edema by MRI also contained infiltrating tumor cells and were associated with disease progression. Therefore, although MRI‐based classification of nCE tumor regions is generally accurate, it underestimates infiltration within edema‐labeled areas. Furthermore, in patients who underwent gross‐total resection, high peripheral cellularity predicted earlier local recurrence. This suggests that assessing cell density in the periphery can improve recurrence risk prediction. Regarding the tumor microenvironment analysis, immune‐related phenotypes were associated with a worse prognosis only after complete resection of the enhancing tumor. Furthermore, our gene panel, particularly the oligodendrocyte markers, provides prognostic insights depending on both biopsy location and resection extent. These findings support the integration of histological and molecular evaluations of the tumor periphery into surgical and therapeutic decision‐making processes. This approach offers a path to better patient stratification and outcome prediction in GBM.
INTRODUCTION
Glioblastoma (GBM) is the most common and lethal tumor of the central nervous system, with a five‐year survival rate of only 5% [1]. While they rarely metastasize, they do infiltrate the brain parenchyma extensively. Invasiveness is not exclusive to this high‐grade glioma; it is a key driver of treatment resistance, and it explains why GBM invariably recurs, typically at the edge of the resection cavity. This occurs even after aggressive surgical resection, followed by radiotherapy targeting the tumor bed and systemic treatment with temozolomide [2].
Magnetic resonance imaging (MRI) is the gold standard for diagnosing and characterizing GBM. GBM typically presents as a contrast‐enhancing (CE) lesion, sometimes with heterogeneity caused by intra‐tumoral necrosis, cysts, or hemorrhage. The core is surrounded by a hyperintense area in T2‐FLAIR (fluid‐attenuated inversion recovery) sequences. Recent studies suggest that GBM infiltration can be detected in regions with high FLAIR signal intensity. In particular, the non‐enhancing (nCE) tumor appears as lesions with mild‐to‐high signal intensity [3, 4]. However, distinguishing the nCE tumor from edema and gliosis remains challenging and depends largely on subjective radiological criteria. Furthermore, in some GBM cases, all the tumors show contrast enhancement, suggesting that infiltrative tumor areas are not always visible on conventional MRI or that some tumors are more infiltrative than others.
The concept of supratotal resection has gained traction in recent years. This approach aims to remove as much of the tumor as possible, including both CE and nCE, provided that it can be done safely and without causing significant neurological deficits. Several studies have reported a significant increase in overall survival (OS) for GBM patients, averaging an additional 6 months, an outcome unmatched by any other oncological treatment to date [5, 6]. Moreover, new response assessment in neuro‐oncology (RANO) criteria have been proposed to classify the extent of surgical resection including the supratotal resection category, and clinical trials are underway to validate the survival benefits of these extended resections [7, 8].
These results highlight the importance of characterizing the hyperintense FLAIR region at the periphery of GBM tumors. This area contains a mixture of tumor cells, immune system cells, reactive astrocytes, and cells from the oligodendrocyte lineage, within a vascular context that differs significantly from that of the tumor core [9, 10, 11, 12]. Several studies have used single‐cell techniques to provide detailed information on the cellular features of the GBM periphery and identify the enrichment of certain tumor cellular states [13, 14, 15, 16]. However, the number of samples analyzed in these studies was limited, and none of them investigated variations between distinct radiological regions or correlations with GBM progression.
In this study, we prospectively generated a cohort of 161 radiologically guided biopsies from the enhancing nodule region and its periphery. Using the new RANO criteria, we assessed the extent of resection in the 45 patients included in the study. Notably, the presence of residual CE tumor after surgery strongly impacted patient survival in our cohort. We performed an immunohistochemical (IHC) analysis on the paraffin‐embedded samples to measure cellular density and proliferation (Ki67‐positive cells), as indicators of tumor infiltration. Our results confirmed that nCE tumor areas contain a significant number of proliferating cells, with a density similar to that of the tumor core. However, we also identified tumor features in some regions that were radiologically classified as vasogenic edema and in areas with no radiological alterations. In patients who underwent a complete resection of the CE tumor (gross total resection, GTR), low cellularity levels in peripheral samples were associated with better OS and the appearance of recurrent tumors distant from the surgical site.
To further evaluate the extent of neoplastic infiltration and characterize the tumor microenvironment, we identified genes specific to different cell types using publicly available single‐cell RNA sequencing (scRNA‐seq) data. Unsupervised clustering of the differential gene expression analysis grouped nCE tumor samples with CE biopsies based on the enrichment of proliferative markers and the absence of normal endothelial and oligodendrocyte expression. Distinct cellular markers, particularly those associated with endothelial and immune cells, were linked to a worse prognosis in CE samples; however, this was only observed in patients who underwent a complete resection of the enhancing tumor. An inverse correlation was actually observed between myeloid and T cell markers and OS in the non‐GTR group of patients. Interestingly, oligodendroglial‐related gene expression in nCE biopsies was associated with improved OS; conversely, the opposite trend was observed in tumor core samples.
Overall, our study provides a histologic and transcriptomic characterization of a large cohort of peritumoral GBM samples. This characterization confirms the tumorigenic nature of most regions selected as nCE tumor regions based on FLAIR images. However, our data encourage the improvement of pre‐ and post‐surgical MRI techniques to identify areas of tumor infiltration that appear as vasogenic edema or radiologically normal regions. We believe that thoroughly characterizing the nature and extent of GBM tumors after surgery may have significant prognostic and predictive value.
METHODS
Human samples
A prospective study was conducted from April 2021 through April 2024 on all adult patients undergoing surgery for a novel diagnosis of high‐grade glioma, excluding those receiving stereotactic biopsies or cases in which obtaining multiple biopsies was deemed to pose unnecessary risk. We only included patients with a confirmed diagnosis of GBM with wild‐type isocitrate dehydrogenase (IDH) 1 and 2 genes. Preoperative MRI scans were used to determine tumor volume and location and to select the tumor regions for biopsy collection, prioritizing the most extensive safe tumor resection for each patient. The anatomical location of each biopsy was documented using intraoperative neuro‐navigation screenshots at the time of sampling and subsequently mapped onto the preoperative MRI for radiological classification. To minimize the impact of intraoperative brain shift, biopsies were preferentially obtained at early stages of the surgical procedure, when neuro‐navigation accuracy is highest. Samples obtained at later stages, for which reliable correspondence with preoperative MRI could not be ensured, were excluded from the analysis.
At least two experienced neuroradiologists independently reviewed the surgical images and categorized the biopsies into CE tumor, nCE tumor, vasogenic edema, or radiologically normal regions. Biopsies obtained in areas of FLAIR hyperintensity without contrast enhancement were subcategorized into non‐enhancing tumor and vasogenic edema. We used observational criteria to differentiate the samples in these two subcategories. Regions classified as nCE tumor included biopsies obtained from areas displaying nodular or expansive behavior, cortical thickening, and/or lower FLAIR signal intensity compared with vasogenic edema. In these samples, the apparent diffusion coefficient (ADC), measured using Olea Sphere ©, was consistently below 1 × 10⁻³ mm2/s. When available, perfusion imaging was also considered, with relative cerebral blood volume (rCBV) values typically above 1 supporting classification as nCE tumor.
Conversely, vasogenic edema was defined as regions with very high FLAIR signal intensity, typically showing digitiform patterns that respect the cortex and lacking the morphological features associated with nCE tumor; most of these samples exhibited ADC values between 1 × 10⁻³ and 2 × 10⁻³ mm2/s and, when available, rCBV values below 1, consistent with previous reports [17, 18].
Postoperative MRI scans (obtained within ≤72 h after surgery) were analyzed by radiologists to assess the extent of resection for each patient. Histopathological examination and sequencing allowed us to exclude all IDH mutant (IDHmut) cases, as well as CE tumor biopsies with high necrotic content. A detailed list of patients and collected samples is provided in Appendix S2.
Molecular characterization of the tumors
Biopsies taken during surgery (and before treatment) were stored in RNAlater (frozen) or fixed in PFA and embedded in paraffin (FFPE). DNA was extracted from FFPE tumor tissues using the Maxwell RSC DNA FFPE Kit (Promega) and quantified using Qubit 2.0 Fluorometer (Thermo Fisher Sci.). We used a custom AmpliSeq gene‐targeted next‐generation sequencing panel to analyze common mutations: TERTp, 1p/19q codeletion, EGFR/EGFRvIII/PDGFRA amplifications, and CDKN2A/PTEN deletions [19]. Ampliseq libraries were manually prepared using Ion AmpliSeq Library Kit Plus and sequenced on the Ion Torrent Genexus Integrated sequencer (Thermo Fisher). MGMT methylation status was assessed with the Pyromark Q24 kit (QIAGEN) (Appendix S2).
RNA extraction and qRT‐PCR
RNA was extracted using TRIzol (Invitrogen), following the protocol detailed in Appendix S2. One microgram of RNA was reverse transcribed using the PrimeScript RT Reagent Kit (Takara). qRT‐PCR was performed using SYBR Premix (Takara) and gene‐specific primers (Appendix S2) on the LightCycler 480 (Roche Diagnostics). GAPDH, HPRT, and RPII were tested as candidate housekeeping genes. After assessing expression consistency across these genes, GAPDH was selected for normalization. Reactions were run in technical duplicates, and no‐template controls were included. Relative gene expression was calculated using the ΔΔCt method.
Immunohistochemical and immunofluorescence staining and quantification
Staining was performed on 4 μm FFPE sections. Hematoxylin and eosin staining was used to confirm histological features. For chromogenic and fluorescent detection (Appendix S2), slides were preheated at 60°C for 30 min and subsequently processed using the BOND RXm automated advanced staining system (Leica Biosystems) with specific protocols for each staining type (Appendix S2). Diaminobenzidine (DAB)‐stained slides were scanned with a Hamamatsu NanoZoomer‐SQ microscope, and IF images were acquired on a Leica Thunder Imaging System with a 20x/0.80 NA objective.
Image quantification was performed using QuPath software with specific settings (Appendix S2). DAB staining was analyzed using the Positive‐cell detection method, which calculates the percentage of positive cells relative to the total number of cells within a defined area. IF quantification was carried out with the Composite Classifier method, integrating information from multiple fluorescence channels to classify objects based on combined marker intensities, enabling quantitative co‐expression analysis.
scRNA‐seq datasets analysis
We analyzed our previously published integrated human single‐cell atlas, which was generated by integrating publicly scRNA‐seq datasets from normal brain, IDHmut gliomas (lower‐grade gliomas, LGG), and GBM, as described previously [20]. We included non‐tumoral [21], LGG and GBM samples [22] (Appendix S2) so that the gene list could be potentially used with all glioma samples, although the results presented here are restricted to IDHwt GBM. Unsupervised clustering was performed using the Seurat pipeline (PCA‐based nearest‐neighbor graph construction followed by Louvain community detection), with batch correction across patients using Harmony and resolution parameters systematically evaluated to ensure cluster stability. To validate the key genes in the tumor periphery, processed RDS files were downloaded from public repositories. Data processing and analysis were conducted using the Seurat v4.3.0. Differentially expressed genes (DEGs) were determined with the Seurat functions FindAllMarkers (for Cell‐Type Specific Markers) and FindMarkers (for condition‐specific comparisons), requiring gene expression in at least 25% of cells and a minimum log fold‐change of 0.25.
Key genes identification
Two different types of analysis were performed (Appendix S2).
Analysis 1
Identification of Key Genes from DEGs (Appendix S2):
(1) Cell‐type specific markers from the Integrated Single‐Cell Atlas. DEGs that are markers of each cell type, using the following parameter across clusters: ptc.2 ≤ 0.1 for most of the clusters, ptc.2 < 0.2 for Astrocytes‐C10, and ptc.2 < 0.3 for endothelium, mural cells, and neurons. (2) DEGs in Control brains vs. LGG Patients within each specific cluster (parameter settings: avg_log2FC = <−1). (3) DEGs in Control brains vs. Newly Diagnosed GBM Patients (parameter settings: avg_log2FC = <−1). (4) DEGs in control brains versus recurrent GBM patients. DEGs in homeostasis versus newly recurrent GBM patients (within each specific cluster (parameter settings: avg_log2FC = <−1)).
Genes overlapping across these lists within each specific cell type were defined as key gene candidates (Appendix S1F and Table S1). They were further validated by comparing GTEx brain‐cortex/frontal cortex versus TCGA LGG and GBM datasets (Appendix S1F and Table S1). To assess significant expression differences, we applied Welch's t‐test (TCGA vs. GTEx) [23], identifying the most differentially expressed genes between normal brain tissue and glioma samples (Appendix S1F and Table S2).
Analysis 2
Identification of key genes from conservative markers DEGs (Appendix S1G):
We performed a Venn diagram‐based comparison between the significative conservative markers in the control brain and glioma samples, alongside cell‐type‐specific markers identified in the Integrated Single‐Cell Atlas (parameter settings: ptc.2 ≤ 0.1). It was applied when Analysis 1 did not yield strong markers for certain cell types, helping us to extract key markers for endothelial cells and oligodendrocytes.
Candidate genes from both analyses were finally visualized in the integrated single‐cell atlas and the core/peripheral database (Appendix S1B) to select the most cell‐type‐specific genes (Appendix S2).
Survival analysis
To assess the prognostic value of the expression of the markers in GBM, we used the The Human Protein Atlas web tool [24] (proteinatlas.org). RNA sequencing (RNAseq) data came from the TCGA. The best cutoff algorithm was used to divide GBM cancer patients into high‐ or low‐expression groups (Appendix S1F,G).
Cell type RNA expression
To confirm cell‐type‐specific genes of the markers we employ the The Human Protein Atlas web tool [24]. The RNA specificity category is based on mRNA expression levels in the analyzed cell types based on scRNA‐seq data from normal tissues (Appendix S1F,G).
Statistics
All analyses were conducted using R (v.4.4.3). Continuous variables were log10‐transformed and standardized (z‐score) prior to analysis. Normality was assessed using the Shapiro–Wilk test, and given the non‐normal distribution of all variables and the small subgroup sizes, non‐parametric tests were applied. A two‐sided p ≤ 0.05 was considered statistically significant.
For comparisons across multiple categories, the Kruskal–Wallis test was performed, followed by pairwise significance testing using the Wilcoxon rank‐sum test (Mann–Whitney U) with p‐value adjustment for multiple comparisons. Dot plots were generated to visualize the expression of genes of interest both in the integrated scRNA‐seq object and in GBM patient tissue samples.
Cell‐type scores were calculated by averaging the normalized (z‐scored) expression values of predefined marker genes associated with each cell type (e.g., oligodendrocytes, astrocytes, myeloid cells), based on prior transcriptomic studies. These scores provide relative measures of cell‐type–associated transcriptional programs across samples and were used for comparative analyses between radiologically defined regions.
To evaluate the predictive power of molecular scores across tissue categories, multiclass classification models were trained using the caret framework. The following algorithms were implemented: multinomial logistic regression, random forest, XGBoost, and multinomial LASSO regression (glmnet). Models were assessed by 10‐fold cross‐validation repeated five times, reporting accuracy, Cohen's kappa, and confusion matrices. Variable importance was determined through overall and per‐class permutation importance analyses. For one‐vs‐rest comparisons, generalized linear models (GLM) with LASSO regularization were used to identify the most relevant predictors, and ROC curves/AUC values were calculated with the pROC package.
Unsupervised clustering of tumor samples was performed using ConsensusClusterPlus (v.1.64.0) based on the expression matrix of 45 genes. Clustering stability was evaluated across a range of cluster numbers (K = 2–10) using hierarchical clustering with Ward's method and Spearman distance. The optimal number of clusters (K = 5) was selected based on the consensus cumulative distribution function (CDF) plot, delta area plot, and sample tracking plot. Clustering was validated by principal component analysis (PCA), t‐distributed stochastic neighbor embedding (t‐SNE), and uniform manifold approximation and projection (UMAP), and silhouette analysis. For statistical analysis of cluster–category associations, a Chi‐square test was performed. The strength of association was quantified with Cramér's V, where values <0.3, 0.3–0.5, and >0.5 were interpreted as weak, moderate, and strong associations, respectively.
Survival analyses were performed using Cox proportional hazards models (survival and survminer packages). Continuous predictors were analyzed both individually and jointly using LASSO‐penalized Cox models with unpenalized categorical covariates. Proportional hazards assumptions were verified with Schoenfeld residuals; violations were corrected using stratification (categorical) or time‐dependent terms (continuous). Model performance was evaluated using Harrell's C‐index, and results were summarized in a forest plot (hazard ratios with 95% CI). Kaplan–Meier curves with log‐rank tests were generated to assess overall survival according to different categorical variables. Partial Spearman correlations adjusted for censoring status were used to explore associations between molecular variables and survival.
Generative AI tools (such as DeepL and ChatGPT) were employed for tasks related to grammar checking and paraphrasing.
RESULTS
Establishment of the cohort and experimental workflow
A total of 45 IDHwt GBM patients were enrolled in the study. Figure 1A shows their main clinical features and the genetic alterations found in their tumors. Given the limited cohort size, robust molecular subgrouping based on co‐occurring genomic alterations was not feasible. We therefore performed an exploratory stratification using recurrent alterations frequently associated with major molecular classes of GBM, including NF1 alterations, EGFR alterations, and PDGFRA amplification [25]. This analysis showed that NF1‐mutant tumors and EGFR‐amplified tumors lacking concomitant EGFR mutations were associated with longer overall survival, whereas PDGFRA‐amplified tumors were associated with shorter overall survival (Figure S1). Because of the small number of cases within each category, these findings should be interpreted with caution.
The extent of resection for each patient was categorized according to the RANO criteria [7]: (i) supratotal resection (class 1): removal of all CE tumor and less than 5 cm3 of residual nCE tumor; (ii) complete resection (class 2a): removal of all CE tumor; (iii) neartotal resection (class 2b): less than 1 cm3 of residual CE tumor; (iv) subtotal resection (class 3a): between 1 and 5 cm3 of residual CE tumor; (v) partial resection (class 3b): more than 5 cm3 of residual CE tumor; and (vi) biopsy (class 4): no tumor reduction (Figure 1B).
In our cohort, the presence of even small areas of CE tumor after surgery strongly impacted patient prognosis. No significant differences in OS were observed between patients who underwent neartotal or subtotal surgeries (Figure 1C). For this reason, and to increase the statistical power of our correlation studies, we grouped patients into two categories: (i) GTR (those who received a complete resection of the CE tumor (supratotal and complete)) and (ii) non‐GTR (neartotal, subtotal, partial, and biopsy) (Figure 1C). Notably, tumor recurrence occurs close to the surgical niche in 95% of the cases in the non‐GTR group, as expected. However, we observed that recurrent tumors appeared in regions separated from the surgical cavity in 45% of patients who underwent a complete resection of the CE tumor (Figure S2A,B). Although time‐to‐recurrence was not different when comparing local vs. distant recurrences in the GTR group, it was clearly reduced in patients receiving a non‐GTR that suffered from a local recurrence (Figure S2C).
From enrolled patients, biopsies were collected from different radiological regions (N, E, nCE and CE) (Appendix S2). A portion of the samples was fresh‐frozen for RNA extraction and reverse transcription for transcriptomic analysis using a gene panel derived from an in‐silico analysis of public repositories. The remaining samples were embedded in paraffin for IHC analysis. The overall workflow is detailed in Figure 1D.
Immunohistochemical characterization of the samples
In order to start characterizing the MRI‐guided samples, we performed IHC staining using the Ki67/MIB‐1 antibody. The MIB1 index and the cellularity (total number of cells per field) were quantified automatically (Figure 2A). MIB1 staining has commonly been used to characterize the proliferative status of GBM cells. There are reports suggesting that in the tumor core, it labels not only tumor cells but also cells from the stroma, such as proliferative endothelial and myeloid cells [26]. We did IF staining of peripheral samples using SOX2 (to label tumor cells), CD68 (to label myeloid cells), and Ki67 antibodies (Figure 2B). Although SOX2 is not an entirely specific or sensitive marker of GBM cells, its use here was limited to a qualitative validation aimed at excluding a major contribution of non‐neoplastic cells to the MIB1 signal in peripheral samples. The quantification showed that most of the proliferating cells in the GBM periphery indeed correspond to tumor cells in the majority of cases (Figure 2C), suggesting that the MIB1 index can be used as a readout of the level of tumor infiltration outside the tumor core.
As expected, biopsies from the CE tumor region exhibited the highest cell density and proliferation index (Figure 2D). However, nCE tumor samples showed a significantly higher percentage of MIB1+ cells than areas considered non‐tumorigenic by MRI (edema and normal) and exhibited similar cellularity levels to CE biopsies (Figure 2D). Notably, both parameters showed the strongest correlation with survival among nCE tumor samples. High MIB1 correlated with a better OS, whereas high cellularity was associated with a worse OS, although it was not statistically significant (Figure S3A).
We graphically represented the two cellular parameters across the different groups of biopsies. Using the edema and normal brain biopsy values we defined a “pathological” range based on the first quartile of the MIB1 index (more than 2.5%) (see the dotted lines in Figure S2B). As expected, all CE samples and most nCE tumor samples (72.0%) displayed pathological features. In our cohort, some biopsies with high cellularity and very low MIB1% were classified as reactive gliosis by the neuropathologist, although increased cellularity in this setting may reflect contributions from different non‐neoplastic cell populations. Interestingly, our analysis revealed that several biopsies classified as edema (33.3%), as well as a few radiologically normal samples (22.2%), displayed high MIB1 levels (Figure S3B).
We analyzed the progression of some patients with signs of tumor infiltration in biopsies that were radiologically classified as edema or normal (Figure 3A). Postoperative MRI revealed a small residual CE tumor area in patients PTZ‐28 and PTZ‐29 (neartotal resections) (brown arrows). However, in both cases, areas of edema with signs of tumor infiltration were also left behind after surgery (yellow dots). Both biopsies were located apart from the CE tumor: 5 mm for PTZ‐28 and 11 mm for PTZ‐29. Tumor recurrence occurred very soon after surgery (6 and 3 months, respectively) in both the residual CE tumor and the residual edema region. Patient PTZ‐14 underwent a supratotal resection; however, a region of edema with a low MIB1 index was left behind (yellow dot), located 4 mm from the core. This patient showed signs of tumor recurrence 17.5 months after surgery in several areas far from the resection cavity and the region where the edema biopsy was taken (white arrows) (Figure 3A). These observations reinforce the notion that tumor infiltration beyond the CE and nCE regions, which occurs in some GBM patients, could lead to rapid tumor recurrence if not surgically removed. Consistent with this idea, we analyzed patients who underwent GTR and found that high cellularity in non‐tumoral regions (E + N) was associated with local recurrence. However, no such association was found in CE tumor samples (Figure 3B). Survival analysis showed no statistically significant differences in overall survival between local and distant recurrence groups, although a trend toward longer survival was observed in patients with distant recurrence (Figure 3C).
Transcriptomic analysis of the cohort of biopsies
The tumor microenvironment at the periphery of GBM differs significantly from the tumor core. To better characterize our cohort of GBM biopsies, we measured the expression of selected genes that are representative of different neural cell types. Using an integrated atlas from publicly available scRNA‐seq databases [20] (Supplementary Figure S4), we identified distinct clusters of immune cells (myeloid and lymphoid), astrocytes, oligodendrocytes, and vascular cells (endothelial and pericytes) (Figure 4A). We also detected two clusters of cells that overexpress many genes related to cell proliferation: glial (C6) and myeloid (C8) clusters (Figure 4A). After several refinement steps, we selected a gene set specific to each cell type (Supplementary Figure S5) and confirmed its differential expression across distinct clusters (Figure 4B). These findings were further supported by validation in two independent single‐nucleus (Figure S6A) and single‐cell (Figure S6B) datasets, which confirmed the expected lineage specificity of the selected markers and the regional trends observed in our cohort.
We used qRT‐PCR to quantify the expression of the selected genes and evaluate the distribution of individual genes and cell‐type scores across different radiological regions. Cell‐type scores were calculated by aggregating the expression of the predefined marker genes assigned to each cell type, as shown in Figure 4B (see Section 2). CE and nCE tumor samples showed higher expression of proliferative markers and a significant decrease in oligodendrocyte‐related genes compared to the other non‐tumorigenic regions (Figure 4C,D). Similar regional trends were observed in an independent snRNA‐seq dataset, in which TE/TC samples were enriched for proliferative and astrocytic programs, whereas PT samples showed relative enrichment of oligodendrocyte‐associated signals (Figure S7A). Expression of endothelial‐associated markers was reduced in CE tumor samples compared with the other radiological regions. This decrease may reflect the limited ability of canonical endothelial markers to capture aberrant vascular states in GBM. nCE tumor biopsies were enriched in astrocytic, endothelial, myeloid, and T‐cell markers relative to CE samples. Myeloid gene expression was also higher in edema than in normal tissue, representing the only significant difference between these regions (Figure 4C,D). An unsupervised principal component analysis (PCA) of the qRT‐PCR–derived molecular scores revealed structured variation across MRI‐defined regions, with CE/nCE samples segregating from normal/edema primarily along an oligodendroglial–proliferative axis (Figure S7B). A comparable region‐associated structure was also observed in the independent snRNA‐seq cohort by PCA of module scores (Figure S7C). Because of their high similarity, E and N samples were grouped (N + E) for subsequent analyses to increase statistical robustness.
To evaluate the predictive value of cell‐type scores for distinguishing radiological regions, we applied a multiclass generalized linear model (GLM, one‐vs‐rest) (Figure 4E). Importantly, this modeling approach was implemented as a framework for biological inference rather than as a clinical prediction tool. This analysis revealed that the oligodendrocyte and proliferative scores were the strongest discriminators of N + E regions. Higher proliferative scores, however, showed an inverse association. Both nCE and CE regions exhibited reduced oligodendrocyte scores compared to N + E regions, effectively differentiating these groups. Additionally, astrocyte and myeloid scores contributed to the classification of nCE and CE samples, respectively (Figure 4E). The model demonstrated robust performance across all categories, achieving AUCs of 0.973 for N + E, 0.829 for nCE, and 0.930 for CE (Figure 4F). However, post‐LASSO and XGBoost analyses revealed that only the oligodendrocyte and proliferative scores remained consistent predictors, with predictive power decreasing for nCE (Figure S8A–C).
To improve nCE discrimination, we incorporated into the model histological variables, cellularity, and MIB1 expression (Figure S8D–F). In this model, MIB1 contributed to the discrimination between nCE and CE samples, resulting in robust performance across all classes (AUC = 0.974 for N + E, 0.857 for nCE, 0.946 for CE; Figure S8E). XGBoost feature importance highlighted oligodendrocyte, proliferative, and astrocyte scores as key predictors, underscoring the role of cellular composition and histological features in regional classification (Figure S8F).
Unsupervised clustering of the samples
Unsupervised clustering of the qRT‐PCR expression data confirmed that the genes selected for the different cell types clustered together along the x‐axis (Figure 5A). For sample classification, we grouped them into five clusters, which were supported by cumulative distribution function (CDF), delta area, and sample tracking plots. These plots indicated diminishing gains in cluster separation beyond K = 5 (Figure S9A). Cluster robustness and separability were further confirmed through principal component analysis (PCA) and uniform manifold approximation and projection (UMAP) (Figure S9B).
We observed a high degree of similarity between CE and nCE tumor samples, which clustered together in Cluster 1 (C1) and Cluster 4 (C4) (Figure 5A,B). Both clusters were enriched in proliferative markers and exhibited lower expression of oligodendrocyte markers compared with the other three clusters. Notably, C4, which was enriched in nCE samples, displayed higher levels of proliferative, astrocytic, and endothelial cell markers (Figure S9C).
Interestingly, some samples classified radiologically as edema clustered with CE and nCE biopsies in C1, suggesting that these regions may represent areas of tumor infiltration (Figure 5A,B). However, most peritumoral samples were distributed into the other three clusters (C2, C3, and C5). C5 showed a marked increase in astrocytic, oligodendrocytic, myeloid, and endothelial scores compared with both C3 and C2. In contrast, cluster C2 displayed significantly lower T‐cell and oligodendrocyte scores relative to C3 and C5 (Figure S9C). This clustering pattern was consistent with the radiological classification, as confirmed by a chi‐square test showing a significant association between cluster assignment and sample category (χ 2 = 163.68, d.f. = 28, p < 2.2 × 10⁻¹⁶) (Figure 5C).
We also included a few biopsies from radiologically normal regions of patients with non‐GBM diseases: one case of cavernous malformation (CM), one case of contusion (CNT), one case of brain metastasis (MTS), and one case of polymorphous low‐grade neuroepithelial tumor (PLNTY). Notably, the CNT biopsy clustered together with several nCE and edema biopsies in C1, showing high levels of proliferative and myeloid markers (Figure 5A). In contrast, the other three biopsies clustered with non‐tumorigenic biopsies in C5 (CM), C3 (MTS), and C2 (PLNTY), all showing low proliferative and high endothelial marker expression (Figure 5A).
Prognosis value of the expression of the gene panel
To evaluate the combined contribution of clinical factors and gene panel expression, we fitted a global Cox model that included extent of resection, age, and sex as covariates (Figure S10A). Then, we performed multivariable Cox regressions, adjusting for these clinical covariates within each radiological region (Figure 6A). Of the various cellular scores, only the oligodendrocyte score exhibited a significant association with patient outcomes. Specifically, it was linked to a better prognosis in nCE samples but a worse prognosis in CE samples. After applying a post‐LASSO regression to refine variable selection, the association of the oligodendrocyte score in CE regions with a worse prognosis was the only significant finding (Figure S10B).
To investigate the clinical relevance of individual genes, we performed a partial correlation analysis of gene expression levels and OS, stratifying patients according to extent of resection and radiological region. Among the non‐tumoral samples (N and E), the expression of endothelial, astrocytic, and myeloid genes was associated with worse OS, but this association was mainly observed in patients who underwent a GTR (Figure 6B). This finding suggests that the cellular phenotype of these samples has a greater impact on disease progression after tumor core removal, as expected. In nCE biopsies, likely caused by the small sample size, only a few astrocytic genes were associated with poorer OS in the GTR group (Figure 6B). In CE samples, many immune, vascular, and oligodendrocyte genes were negatively correlated with prognosis in GTR patients (Figure 6B), suggesting that the tumor core phenotype impacts disease progression, even after a complete CE resection. Interestingly, higher expression of certain myeloid and T cell‐related genes was associated with improved survival, though not significantly, in patients who underwent non‐GTR resection (Figure 6B). This suggests that the immune microenvironment of GBM tumors has an opposite effect on disease progression depending on the extent of resection.
DISCUSSION
GBM remains one of the most challenging cancers to treat, with only a few successful clinical trials conducted in recent decades. One approach that has significantly improved OS in patients with GBM is extending surgical resection to include nCE tumor regions [5, 6, 7]. Several recent single‐cell and spatial‐omics studies have characterized infiltrating tumor cells at the GBM margin and within white‐matter niches, highlighting the biological distinctiveness of non‐enhancing regions [13, 14, 15, 16, 27, 28, 29, 30]. However, these studies do not systematically distinguish radiologically defined vasogenic edema from nCE tumor or integrate these compartments with standardized extent‐of‐resection categories. In our cohort of 161 MRI‐guided biopsies, each sample was prospectively assigned to CE, nCE, edema or radiologically normal regions, enabling direct histological and targeted transcriptomic validation of radiological labels. This design shows that nCE regions are, in most cases, biologically indistinguishable from the CE core, particularly with regard to cell density and proliferative gene expression, as well as loss of oligodendrocyte expression. These findings reinforce the value of supratotal resections, emphasize the relevance of surgery within the GBM treatment regimen, and support the idea of pushing the boundaries of nCE tumor resection whenever possible.
Distinguishing nCE tumor from edema remains a major challenge when performing more extensive GBM resections, because both regions appear as hyperintense regions on FLAIR sequences. This distinction often relies on subjective radiological criteria and becomes particularly difficult after surgery [7, 31]. Beyond its descriptive value, the combination of oligodendrocyte signature loss and activation of proliferation‐associated genes defines a minimal marker panel that could be readily implemented in routine neuropathological workflows (e.g., qRT‐PCR or IHC). This panel may facilitate the biological validation of radiological biomarkers distinguishing nCE tumor from edema and provide a mechanistic framework for the future development of preoperative biomarkers (based on MRI features or liquid biopsies) aimed at characterizing peritumoral infiltration.
Our data suggest that some areas previously identified as vasogenic edema, or even normal tissue, on MRI scans may harbor significant tumor infiltration. These findings highlight the urgent need for improved preoperative and intraoperative tools capable of more accurately delineating infiltrated peripheral regions of GBM. Crucially, such tools should be coupled with systematic histological and molecular validation to ensure they truly reflect the degree of tumor infiltration. In this regard, MIB1 staining and cell density assessment were confirmed by our results as robust histopathological indicators, particularly in the peripheral setting. Notably, Kuroda et al. recently used perfusion‐guided stereotactic sampling to compare CE, nCE, and edema in GBM, showing that Ki‐67 index and cell density are significantly higher in nCE than in edema, while CE and nCE tumor regions display similarly high cellularity [17]. This pattern closely matches the gradients of MIB1 labeling and cellularity observed in our MRI‐guided cohort, reinforcing that radiological nCE commonly corresponds to infiltrating tumor, whereas vasogenic edema shows comparatively lower cellularity. Our study extends these findings by integrating cell‐type‐resolved transcriptional profiling across all radiologically defined compartments, including radiologically normal tissue, in a larger prospective series. In this context, peripheral infiltration was associated not only with increased expression of proliferative programs but, more strikingly, with a marked loss of oligodendrocyte differentiation signatures, including myelin‐regulating genes. Among all parameters tested, the oligodendrocyte differentiation score had the strongest predictive power in distinguishing CE and nCE tumor regions from extra‐tumoral tissue.
The role of mature oligodendrocytes in GBM progression remains poorly defined compared with other microenvironmental components. Previous studies have proposed opposing mechanisms: myelin‐rich niches may promote tumor cell differentiation and slow progression [27] and myelin engulfment by macrophages can fuel proliferation and recurrence [32]. By contrast, recurrence has been reported to occur more frequently in white matter adjacent to the resection cavity, possibly supported by pro‐tumoral oligodendrocyte‐lineage signaling and enhanced neo‐vascularization [33, 34]. Notably, enrichment of oligodendrocytes and neurons has been described in recurrent GBMs [35], suggesting that these populations may persist or re‐emerge under therapy pressure.
It is important to note that the oligodendrocyte‐associated markers used in our study are primarily linked to differentiated/myelinating oligodendrocytes and therefore should not be interpreted as capturing the reactive oligodendrocyte states recently described in GBM. In particular, some studies have shown that GBM‐associated oligodendrocytes may acquire inflammatory or interferon‐responsive phenotypes, including reactive states characterized by CCL5 secretion or by disease‐associated markers such as C4B and SERPINA3, which are conceptually distinct from the mature oligodendrocyte program represented in our panel [36, 37]. Thus, our findings more likely reflect the relative preservation or loss of mature oligodendrocyte‐associated programs across radiological regions, rather than enrichment of tumor‐supportive reactive oligodendrocytes. Nevertheless, these studies provide a useful mechanistic framework for interpreting context‐dependent oligodendroglial function. Our results further suggest that the impact of oligodendrocyte‐lineage cells is strongly location dependent. In peripheral regions, preservation of oligodendrocyte differentiation markers may reflect a relatively intact myelinating microenvironment that constrains tumor plasticity and supports a more differentiated tumor state. In contrast, within CE regions characterized by axonal disruption and inflammatory signaling [38], residual oligodendrocytes may adopt reactive or interferon‐associated states that fail to sustain effective remyelination and instead contribute to tumor‐supportive signaling. The association of high oligodendrocyte scores with poorer prognosis in CE areas therefore likely reflects qualitative changes in oligodendroglial functional state rather than simply differences in cell abundance. Together, these data support a dual, location‐specific contribution of oligodendrocyte‐lineage cells to GBM evolution, underscoring the need for mechanistic studies integrating spatial and functional resolution.
Our histological and transcriptomic analyses reveal that MIB1 staining is lower in nCE tumor regions, while endothelial markers are elevated compared to CE biopsies. The reduced expression of canonical endothelial markers in the tumor core does not contradict the presence of microvascular proliferation, but rather likely reflects endothelial de‐differentiation and vascular plasticity, including aberrant angiogenic programs and vascular mimicry that are not captured by markers of mature endothelium [39, 40]. Moreover, the endothelial and proliferative changes observed suggest that there are distinct tumor phenotypes in enhancing and non‐enhancing compartments. This idea has been proposed in previous single‐cell and spatial transcriptomic analyses of peripheral GBM [15, 16, 29]. Moreover, tumor cells in non‐enhancing regions of recurrent GBM have previously been shown to express genes associated with lower‐grade gliomas (LGG) [30]. Consistent with this, we have observed high expression levels of selected astrocyte genes in nCE tumor biopsies, and also in LGGs (Figure 4B). These findings imply that tumor cells in peripheral regions may be less aggressive and/or more responsive to treatment compared to the tumor core. Indeed, edge‐derived cells have been shown to be more sensitive to irradiation [41]. These results could explain the survival difference between patients who underwent GTR and those with residual CE tumor post‐surgery. A previous Norwegian study documented a significant survival benefit of complete CE resection compared to neartotal resection. This suggests that even minimal residual CE tumor may affect disease progression and/or treatment response [42]. Further studies in larger cohorts with detailed post‐surgical MRI measurements are needed to validate these findings. This could support evaluating the safety and benefits of second‐look surgery in patients with resectable residual tumors.
Much GBM research has focused on the tumor core, where growth mechanisms are heavily influenced by microenvironmental pressures, such as hypoxia, necrosis, and angiogenesis. However, this focus may be less relevant for patients who undergo GTR. In these cases, recurrence is primarily driven by residual tumor cells that infiltrate the surrounding brain parenchyma. These cells are not subjected to the same selective pressures as the core. Despite the theoretical importance of this distinction, clinical trials evaluating treatment responses based on residual tumor volume remain scarce. A seminal study by Ellingson et al. identified postoperative residual CE tumor volume as an independent prognostic factor for OS in patients with newly diagnosed GBM, irrespective of therapy type [43]. Notably, long‐term survivors were disproportionately represented among patients with no residual CE tumor who were treated with vorinostat, a histone deacetylase inhibitor [43, 44]. Conversely, some immunotherapies have shown greater efficacy in patients with residual CE tumor after surgery [45]. Consistent with these observations, we found that the expression of immune‐related genes in the tumor core was positively associated with OS in patients with residual CE disease, but negatively associated with OS in patients who underwent GTR. These findings suggest that the therapeutic vulnerabilities of core and infiltrative tumor cells may differ substantially, a concept supported by previous studies [28]. Moreover, these results highlight the importance of stratifying GBM patients based on the presence or absence of residual CE tumor after surgery and tailoring treatment strategies accordingly. They also support the need to assess the extent of resection in a standardized manner in GBM clinical trials to reduce prognostic imbalances between study arms and to identify specific treatments depending on the extent and the nature of the residual disease.
An alternative explanation for the differential prognostic effect of immune‐related gene expression in CE biopsies is based on recently reported differences in the relevance of extent of resection in different tumor subgroups. It has been published that patients with mesenchymal and low‐neural tumors, which have a high immune cell content, do not benefit from extensive surgeries [46, 47]. This implies that, in the GTR group, a better OS would be associated with a decreased immune phenotype. Conversely, in the non‐GTR group, patients with an increased immune phenotype would have a better OS than others. Therefore, it is extremely important to identify preoperative biomarkers, such as radiological parameters or molecules that can be detected in liquid biopsies, to classify GBM tumors. Apart from other clinical variables, such as age, tumor location, and patient status [6, 8], these biomarkers could guide surgical decisions and help determine whether maximal resection or a more conservative approach would be more favorable for the patient [48].
Many factors have been proposed to explain the high failure rate of GBM clinical trials. One important yet often overlooked limitation is the overreliance on surgically resected CE tissue. This approach fails to capture the biological heterogeneity of the tumor periphery and does not reflect the biology of residual disease in patients who undergo complete resection. Our study aims to address this gap by providing a cellular and molecular framework for characterizing the tumor margin. However, several limitations should be acknowledged. First, the relatively modest cohort size limits our ability to confirm a clinical benefit of supratotal over complete resections and may have reduced the prognostic power of some cellular and molecular features. In addition, the small number of cases per genomic category precluded more robust subgrouping based on co‐occurring alterations. Exploratory subgroup analyses performed in both GTR and non‐GTR patients did not reveal consistent survival stratification according to the most frequent mutational alterations (data not shown), although these findings should be interpreted cautiously given the limited sample size and reduced statistical power of these comparisons. Additionally, MGMT promoter methylation status was unavailable for some cases, although this limitation did not alter the main prognostic associations observed in our cohort. Finally, the targeted gene panel was designed to provide a robust and implementable characterization of radiologically defined regions and therefore cannot resolve functionally distinct astrocytic or myeloid states, which are known to influence GBM progression.
Spatial heterogeneity represents an inherent challenge in studies of GBM infiltration. Although surgical safety constraints limit the number of biopsies that can be obtained per patient, the analysis of a large, radiologically stratified cohort enables robust population‐level conclusions. Unsupervised analyses of the targeted transcriptomic data revealed partial clustering of samples according to radiological category, supporting the existence of shared biological features across tumors, while also highlighting residual variability within edema and radiologically normal regions. At the intra‐tumoral level, most samples from the same radiological compartment displayed concordant profiles, although infiltrative features were occasionally restricted to a subset of biopsies, suggesting that GBM infiltration is not uniformly radial and may follow preferential anatomical or microenvironmental trajectories. Dissecting these patterns in greater detail will require higher‐resolution single‐cell and spatial approaches integrated with advanced imaging and anatomical mapping. Moreover, as this study is observational, functional validation will be necessary to determine whether the identified gene signatures are causally linked to prognosis or therapeutic response.
Despite limitations, our findings help bridge the gap between neuroimaging, histopathology, and molecular profiling of the infiltrative tumor margin. The results presented here also highlight the limitations of MRI‐based delineation and provide molecular and histological tools to better characterize the surgical margins and refine patient stratification. Integrating these markers into neuropathological workflows has the potential to more accurately define the phenotype of tumor infiltration for each patient. This could support more personalized therapeutic strategies and improve outcomes for GBM patients.