- ELOC 突变型肾细胞癌(RCC)是 WHO 认定的独立类型,迄今报道约 40 例;与透明细胞肾细胞癌(ccRCC)同样有 HIF-α 蛋白蓄积,但以显著的平滑肌瘤样间质增生和较惰性的临床经过为特征。
- 材料:作者此前在 102 例 ccRCC 全基因组测序中识别出 5 例 ELOC 突变型 RCC;本研究对最多 13 例日本病例(含 8 例既往报道)行蛋白质组学与免疫组化分析,寻找区分 ELOC 突变型 RCC 与 ccRCC 的标志物。
- 诊断意义:蛋白质组学显示 CK7、scinderin(SCIN)与 sortilin 1(SORT1)在 ELOC 突变型 RCC 中显著高表达;SCIN 与 SORT1 是新的潜在辅助诊断标志物。ELOC 突变与 VHL 双等位基因失活互斥,PBRM1、SETD2、BAP1 突变少见。
- 代谢与流行病学:与 ccRCC 相比更依赖氧化磷酸化、较少依赖糖酵解,可能与 NAPRT、QPRT 低表达致 NAD+ 相对耗竭有关;不同队列发病频率存在地域差异,日本较高。附表 1 与图 1–5 中英对照。
收录范围:PMC 开放获取全文(CC BY-NC-ND 4.0)——摘要、引言、材料与方法、结果、讨论,表 1 与图 1–5 及图注中英对照;补充材料、致谢、利益冲突声明与参考文献未收录。
摘要
ELOC 突变型肾细胞癌(RCC)是一种罕见肿瘤,迄今仅报道约 40 例;就缺氧诱导因子 α(HIF-α)蛋白积聚而言,其与透明细胞肾细胞癌(ccRCC)具有共同的分子背景。ELOC 突变型肾细胞癌的特点是显著的平滑肌瘤样间质生长,且临床病程较 ccRCC 更为惰性。在我们既往的研究中,对 102 例 ccRCC 进行全基因组测序,发现了 5 例 ELOC 突变型肾细胞癌。本研究对多达 13 例日本 ELOC 突变型肾细胞癌进行了蛋白质组学和免疫组化分析,其中包括既往报道的 8 例,以阐明其独特的分子机制,并寻找有助于区分 ELOC 突变型肾细胞癌与 ccRCC 的生物标志物。蛋白质组学分析显示,与 ccRCC 相比,细胞角蛋白 7、scinderin(SCIN)和 sortilin 1(SORT1)等分子在 ELOC 突变型肾细胞癌中显著过表达。值得注意的是,SCIN 和 SORT1 成为区分 ELOC 突变型肾细胞癌与 ccRCC 的新型潜在诊断生物标志物。进一步分析提示,与 ccRCC 相比,ELOC 突变型肾细胞癌更依赖氧化磷酸化,而较少依赖糖酵解。这种代谢转变可能与 NAPRT 和 QPRT 低表达导致的 NAD+ 相对耗竭有关。此外,我们观察到不同队列间的疾病发生频率存在地域差异,日本的发生频率较高。我们的发现为认识 ELOC 突变型肾细胞癌的发病机制提供了新见解,并提示 SCIN 和 SORT1 可作为潜在的辅助生物标志物。
引言
ELOC 突变型肾细胞癌(RCC)已被世界卫生组织(WHO)归为独立实体,1迄今包括我们既往报道在内,仅有约 40 例报道。2–10这一罕见分子亚型的特征是 ELOC 双等位基因失活,导致 HIF-α 蛋白积聚,继而发生肿瘤。3这一机制与透明细胞肾细胞癌(ccRCC)相似。具有 ELOC 突变的肿瘤通常不存在 VHL 双等位基因失活,且 ccRCC 中常见的 PBRM1、SETD2 和 BAP1 突变发生频率较低。11此外,ELOC 突变病例通常缺乏 ccRCC 中典型的特定体细胞拷贝数改变(SCNAs),如 chr.5q 增益以及 chr.3p、chr.9 和 chr.14 缺失。11 ELOC 突变型肾细胞癌的临床预后优于 ccRCC,其肿瘤通常较小,按 WHO/国际泌尿病理学会分级系统评估,组织学级别较低。7,11 ELOC 突变型肾细胞癌的特征包括结节被显著的平滑肌间质(称为纤维肌性带)分隔,以及局灶性乳头状结构。在免疫表型方面,ELOC 突变型肾细胞癌的特点是细胞角蛋白 7(CK7)呈斑片状至弥漫性阳性,碳酸酐酶 9(CAⅨ)呈盒状弥漫性阳性染色。7,11尽管基因和蛋白表达研究有限,但已有报道显示 ELOC 突变型肾细胞癌中哺乳动物雷帕霉素靶蛋白(mTOR)通路下调。11然而,该肿瘤独特组织学特征背后的分子机制仍在很大程度上不明,且尚无实用的诊断生物标志物报道。
在既往研究中,我们发现了 5 例 ELOC 突变型肾细胞癌,来自 102 例 ccRCC 病例。8此外,既往还报道过 8 例日本 ELOC 突变型肾细胞癌。3本文展示 ELOC 突变型肾细胞癌的基因组学、转录组学、蛋白质组学及免疫组化特征,并与 ccRCC 进行比较。
材料与方法
患者与组织标本
我们遵循机构及国家研究委员会的伦理标准,以及 1964 年《赫尔辛基宣言》及其后续修订。本研究获得国家癌症中心研究伦理委员会批准(批准编号:G2008-03)。所有患者均就其数据发表(包括确切年龄、性别、就诊医疗中心或罕见诊断等 3 项或更多间接标识信息),以及样本采集、分析和测序数据存储签署了书面知情同意书。
本研究纳入在国家癌症中心医院(日本东京)诊断为 ccRCC 的 102 例患者。参与者的性别、人数及年龄详见补充数据 1、补充数字内容 1,http://links.lww.com/PAS/C373,以及既往研究。8所有标本均在手术切除后立即保存于液氮中,并从邻近正常肾组织获取胚系对照标本。具有 ELOC 双等位基因失活、形态学特征相符且无 VHL 双等位基因失活的肿瘤被归类为 ELOC 突变型肾细胞癌。
DNA 提取与全基因组测序
从肿瘤及配对正常组织中提取基因组 DNA。使用 TruSeq DNA PCR-free 试剂盒(Illumina,美国加利福尼亚州圣迭戈),以 1 μg 超声处理后的 DNA 制备插入片段长度为 350 bp 的文库。在 NovaSeq. 6000 仪器(Illumina)上以 150 bp 双端读长对文库进行测序。使用 BWA-MEM 0.7.8 版12将肿瘤和非肿瘤样本的测序读段比对至人类参考基因组(GRCh37)。数据处理采用 SAMtools 1.9 版和自研程序,去除潜在的 PCR 重复并生成 pileup 文件。碱基筛选标准包括比对质量评分 ≥20 和碱基质量评分 ≥10。
基因组分析
如既往所述,我们使用自研程序进行突变检出,以尽量减少假阳性。13,14使用 FACETS 0.6.0 版15进行拷贝数分析,参数如下:“snp. nbhd =500”、“preProcSample’s val =50”以及“procSample’s Cval =300”。扩增、增益、纯合性缺失、杂合性缺失以及全基因组加倍样本的定义见既往研究。8
突变特征谱分析
使用 FitMS(https://signal.mutationalsignatures.com/analyse2)进行突变特征谱分析,采用器官特异性特征谱中的 GEL-kidney-SBS 信号突变特征谱。16
RNA 提取与 RNA 测序
使用 HiSeq. 2500 仪器(Illumina)进行 RNA 测序。使用 NEBNext Ultra II Directional RNA Library Prep Kit(New England BioLabs,美国马萨诸塞州伊普斯威奇)制备文库。使用 Bowtie 0.12.7 版17比对双端读段,分别应用“–v 3”和“-a”选项,以允许最多 3 个错配并检出全部多重匹配。选择距离和方向正确的最佳匹配后,计算每百万转录本数(TPM)。
免疫组化
对 13 例 ELOC 突变型肾细胞癌进行 CK7、CAIX、scinderin(SCIN)和 sortilin 1(SORT1)的免疫组化(IHC)检测。此外,对 8 例进行 GPNMB 免疫组化检测。脱蜡切片在靶标修复液(pH 9.0)中经高压加热进行抗原修复。所用一抗如下:抗 CAIX(克隆 EP161,1:400,兔单克隆;Epitomic,货号不适用)、抗 CK7(克隆 OV-TL 12/30,1:500,小鼠单克隆;Agilent Technologies,美国加利福尼亚州圣克拉拉,M7018)、抗 SCIN(1:100,兔多克隆;Proteintech,11579-1-AP)、抗 SORT1(1:1000,兔多克隆;Abcam,ab16640)和抗 GPNMB(人骨活化蛋白/GPNMB 抗体,1:400;R&D Systems)。抗体用抗体稀释液(Agilent Technologies)稀释。免疫组化分析使用 AutostainerLink 48(Agilent Technologies)自动完成。
免疫组化染色由至少 2 名病理专家独立评估。阳性评分由阳性肿瘤细胞比例(阳性率)乘以染色强度计算。染色强度分级为弱染色 1 分、强染色 3 分;例如,80% 细胞呈强染色的肿瘤得分为 3×0.8。当样本内染色强度不一致时(如从弱到强),采用平均强度值计算。为获得经内部验证的判别能力估计,同时尽量降低小样本的不稳定性,我们采用分层 5 折交叉验证,重复 50 次。每次划分时,各折均保持类别比例。设置固定随机种子以保证可重复性。使用 R 中 pROC 包的 roc 函数生成受试者工作特征(ROC)曲线。
蛋白质组学分析
对每位患者的 4 份样本进行液相色谱-质谱(LC-MS)分析(共 32 份样本;样本编号:ELOC 突变型肾细胞癌样本 KI111、KI236、KI275 和 KI279,以及 ccRCC 样本 KI235、KI237、KI257 和 KI263)。从生物素化蛋白组分中制备肽段用于 LC-MS。肽段样本从福尔马林固定、石蜡包埋(FFPE)组织切片中提取。使用切片机将 FFPE 组织块切成 3 μm 厚的组织切片,并以二甲苯、乙醇和蒸馏水脱蜡。将脱蜡后的样本悬浮于 EasyPep 裂解缓冲液(Thermo Fisher Scientific)中,使用手持式匀浆器匀浆。在 95°C 下孵育 30 分钟后,使用 Bioruptor 以“高”功率进行超声处理,每 30 秒开启/关闭循环一次,共 30 分钟。按照 EasyPep 操作规程进行丙酮沉淀。将所得沉淀重悬于 1.4 M 胍中,进行氨基甲酰甲基化。重悬后,使用 Lys-C 和胰蛋白酶进行肽段酶解。离心后收集上清,采用二喹啉甲酸法测定蛋白浓度。使用 EVOTIP(EVOSEP)纯化肽段(500 ng)。纯化后的肽段通过由 Evosep One LC 系统(Evosep)与 Astral 质谱仪(Thermo Fisher Scientific)联用的 LC-MS 系统进行分析。流动相由 0.1% 甲酸水溶液和含 0.1% 甲酸的 99.9% 乙腈组成。采用 2Th 隔离窗口进行数据非依赖性采集,覆盖的质量范围为 380 至 1000 m/z。使用 8 cm Evosep 色谱柱,以每天 60 份样本的通量进行分离。使用 Dia-NN 1.8 版分析数据,并利用人类 UniProt 数据库鉴定蛋白。肽段鉴定的假发现率阈值设为 1%。
基因集富集分析
使用 h.all.v2023.2.Hs.symbols.gmt 基因集和 GSEA 4.3.2 版进行基因集富集分析(GSEA)。根据肽离子强度或 TPM 识别显著通路。置换次数设为 1000,类型设为“gene_set”。确定显著性的 q 值截断值设为 0.15。
结果
ELOC 突变型肾细胞癌的发生频率及 ELOC 基因的突变位点
除我们既往的基因组研究外,8 多项大规模基因组研究也报道了 ELOC 突变,2,3,7,18这些发现很可能来自对随机选取的 ccRCC 病例的分析。我们比较了各项大规模研究中这些 ELOC 突变的发生频率(图 1A)。日本队列中 ELOC 突变型肾细胞癌的检出率为 3.80%(ELOC 突变型肾细胞癌:13 例,ccRCC:342 例),而其他队列的发生频率为 <1%。这种恶性肿瘤发生率的差异可能归因于胚系突变或外源性诱变剂暴露的差异。19,20然而,与 ccRCC 相比,我们未发现 ELOC 突变型肾细胞癌与任何特定突变特征谱或高频胚系突变存在关联(补充图 1A、补充数字内容 2,http://links.lww.com/PAS/C374)。
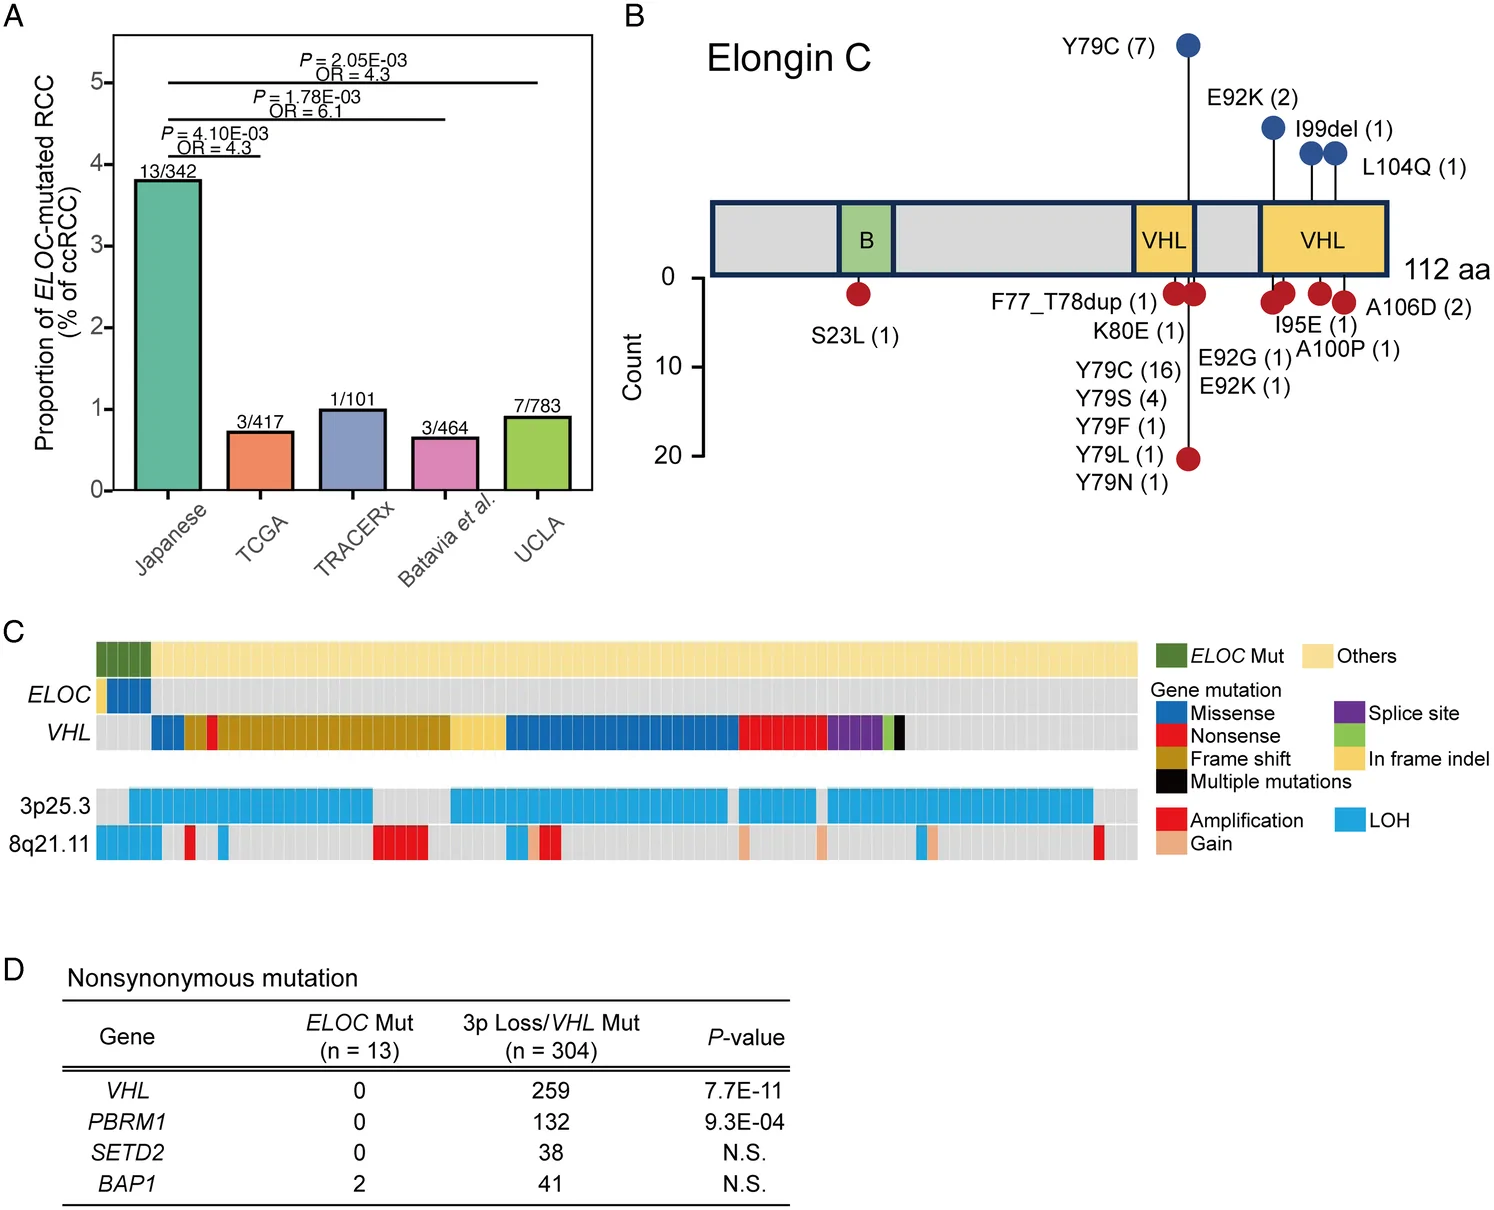
全球 37 例 ELOC 突变型肾细胞癌中共记录到三十九个 ELOC 突变。2–7,9,10由 ELOC 基因编码的 Elongin C 由 112 个氨基酸组成,含有 2 个与 VHL 蛋白相互作用的区域。21除一例外,所有 ELOC 突变型肾细胞癌病例均在这 2 个区域内出现改变。氨基酸替换较常发生于第 71 至 80 位残基,尤其是 Y79C 和 Y79S(图 1B)。在日本病例中,7 例患者在密码子 236 处存在错义突变,导致 ELOC 突变型肾细胞癌中常见的 Y79C 替换(图 1B)。值得注意的是,本研究及既往报道均未发现无义突变。
ELOC 突变型肾细胞癌的基因组异常
我们比较了 ELOC 突变型肾细胞癌与 ccRCC 的非同义突变以及 chr.3p 和 chr.8q 状态(图 1C)。八例因无法评估 SCNAs 而被排除,剩余 94 例用于基因组分析(补充数据 1、补充数字内容 1,http://links.lww.com/PAS/C373)。其中,5 例具有 ELOC 突变及 chr.8q21.11 缺失,后者为包含 ELOC 基因的位点(图 1C)。这些病例均未见 VHL 双等位基因失活,2 例出现 VHL 基因所在的 chr.3p 缺失,这是 ccRCC 中常见的改变(图 1C、D)。我们利用 Sato 等的数据,进一步分析了 ccRCC 中经常发生改变的基因突变,包括 PBRM1、SETD2 和 BAP1(图 1D)。2未观察到 PBRM1 或 SETD2 突变,仅 2 例 ELOC 突变型肾细胞癌携带 BAP1 突变;但差异无统计学意义(图 1D)。ccRCC 通常在多个 chr.3p 基因中存在高频突变,包括 VHL、PBRM1、SETD2 和 BAP1,而 ELOC 突变型肾细胞癌的 chr.8 上除 ELOC 外未见反复出现的突变(数据未显示)。由于某些具有 mTOR 通路相关突变的肿瘤在组织学上与 ELOC 突变型肾细胞癌相似,22,23我们也检查了这些基因。94 例中有七例携带 mTOR 通路突变(TSC1 突变,n=1;TSC2 突变,n=1;MTOR 突变,n=5)。其中 6 例存在 VHL 突变,且全部病例均显示 chr.3p 缺失;这些肿瘤被归类为 ccRCC。
ELOC 突变型肾细胞癌的体细胞拷贝数异常
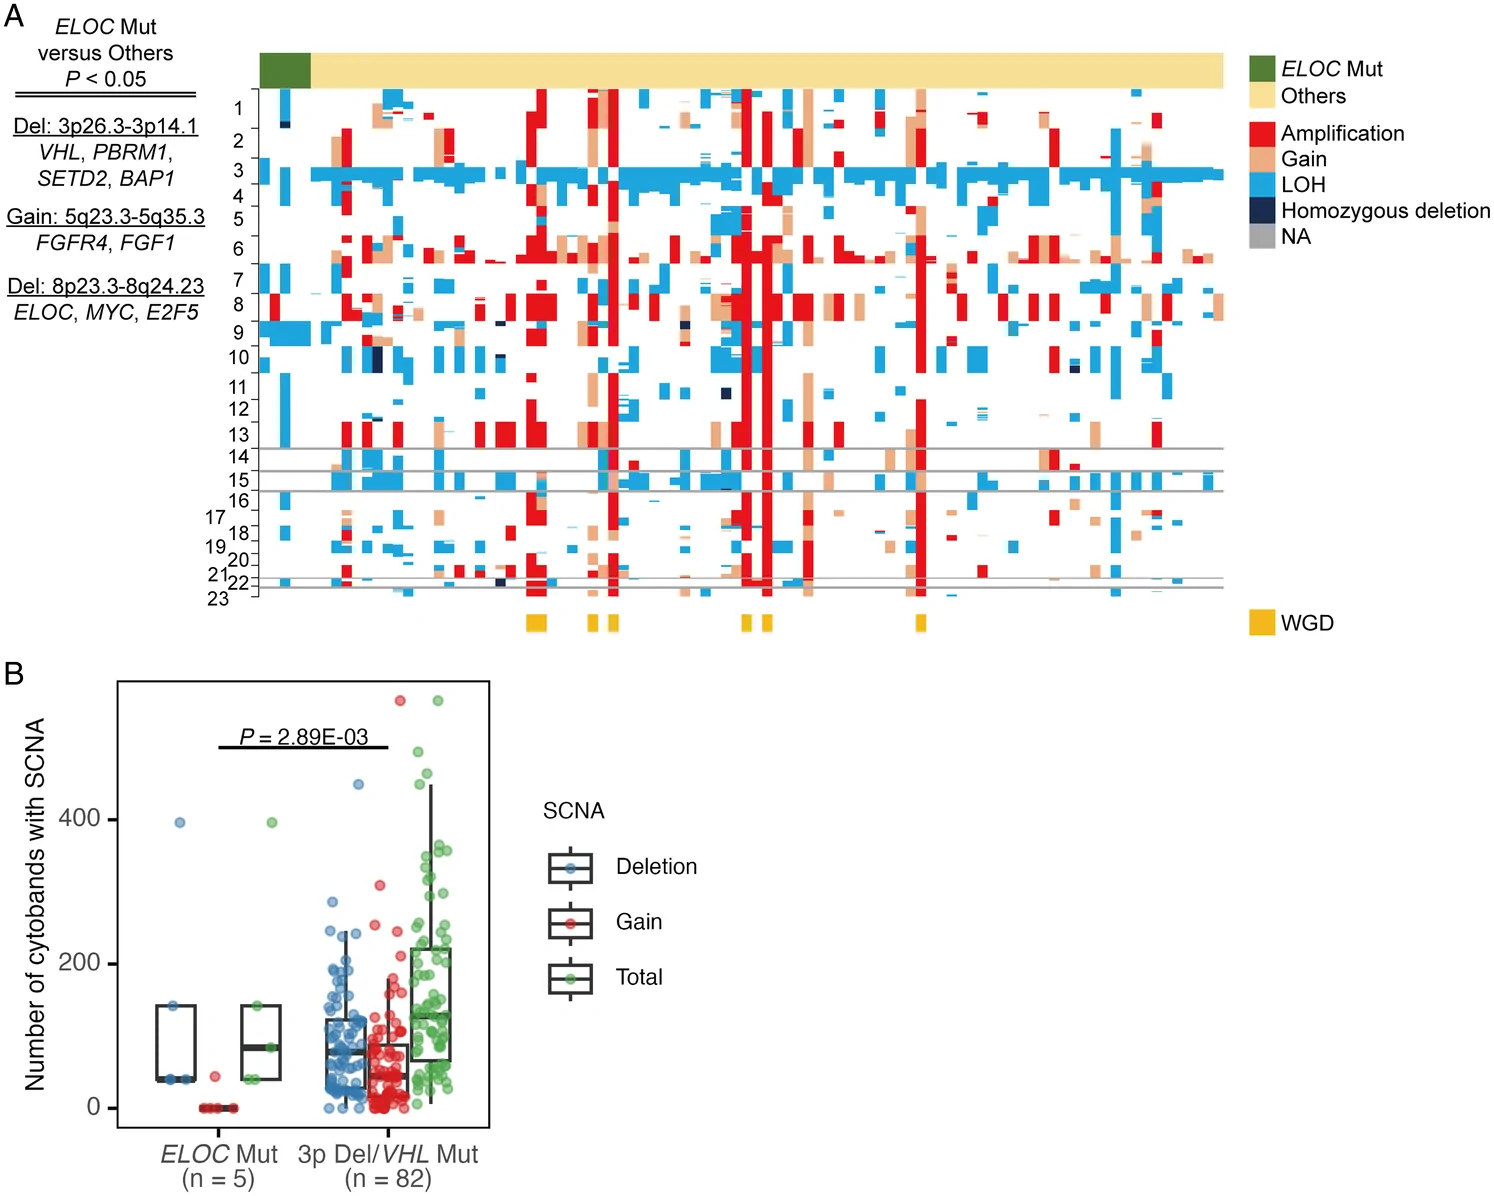
我们检查了 ELOC 突变型肾细胞癌全基因组范围内的 SCNAs(图 2A)。与 ccRCC 相比,ELOC 突变型肾细胞癌中 chr.8p23.3 至 chr.8q24.23 区域的缺失更为常见,该区域包含 ELOC、MYC 和 E2F5。相反,与 ccRCC 不同,ELOC 突变型肾细胞癌中 chr.3p26.3-chr.3p14.1 区域缺失及 chr.5q23.3-chr.5q35.3 区域增益较少见(图 2A)。进展性 ccRCC 中常见的 chr.9 和 chr.14 缺失,8在 ELOC 突变病例中分别仅见于一例和零例。ELOC 突变型肾细胞癌全基因组范围内的 SCNAs 总数和缺失总数与 ccRCC 无显著差异(图 2B)。相比之下,ELOC 突变型肾细胞癌的拷贝数增益少于 ccRCC(P=2.89E-03)。在这些病例中,诊断为 pT3a 的病例缺失数量最多,但未见拷贝数增益。
ELOC 突变型肾细胞癌的临床病理特征
我们分析了携带 ELOC 突变的肾细胞癌患者的临床病理资料。日本患者年龄为 42 至 77 岁,平均年龄为 62 岁(补充数据 2、补充数字内容 3,http://links.lww.com/PAS/C375)。日本病例中有 11 例 pT1 和 2 例 pT3a,大多数未发生进展(补充数据 2、补充数字内容 3,http://links.lww.com/PAS/C375)。然而,一例 pT3a 患者术后复发并出现肺转移。
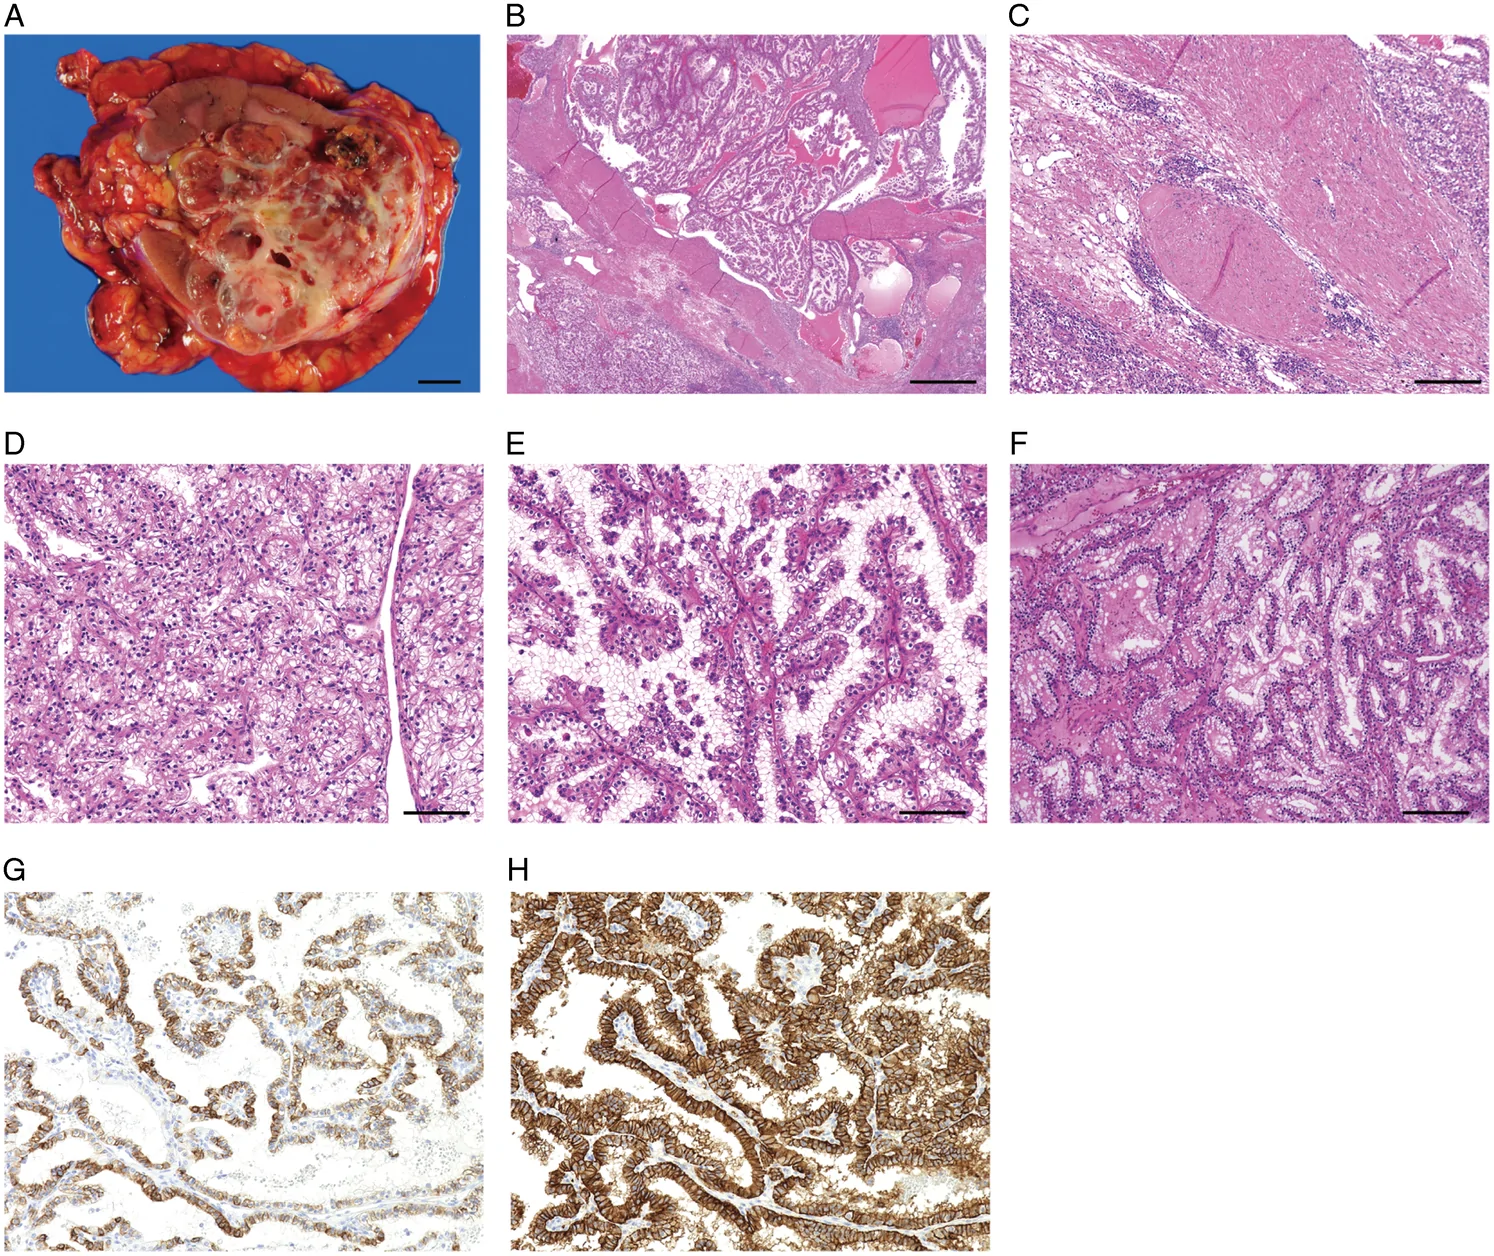
我们的 5 例 ELOC 突变型肾细胞癌呈多结节状外观,形成结节状大体形态(图 3A 和补充图 2A–D、补充数字内容 4,http://links.lww.com/PAS/C376)。组织学上,这些病例均具有显著的平滑肌瘤样间质,即所谓的纤维肌性带(图 3B、C)。肿瘤细胞胞质丰富、透明,结构模式多样(图 3D-F)。肿瘤表现为实性腺泡状、管状、分支管状及囊性结构混合,与 ccRCC 非常相似(表 1)。相比之下,2 例患者表现为纯乳头状结构,这在 ccRCC 中很少见。免疫组化研究显示,ELOC 突变型肾细胞癌各病例的 CK7 表达水平不同,仅 4 例 CK7 阴性。6,7,9日本病例中,11 例 CK7 阳性,3 例几乎阴性(图 3G 和表 1)。所有 ELOC 突变型肾细胞癌病例均呈 CAⅨ 强而弥漫阳性,CAⅨ 为 HIF 的靶基因;其表达环绕整个细胞膜,而非透明细胞乳头状肾细胞肿瘤(ccpRCT)中典型的杯状模式(图 3H 和表 1)。我们还对 8 例 ELOC 突变型肾细胞癌进行了 GPNMB 免疫组化评估。七例完全阴性,1 例呈弱阳性(表 1)。
| 样本编号 | WHO/ISUP 分级 | 坏死 | 肉瘤性成分 | 结构模式 | 平滑肌瘤样间质 | CK7(阳性细胞百分比) | CAⅨ*(阳性细胞百分比) | GPNMB |
|---|---|---|---|---|---|---|---|---|
| KI111 | G2 | 无 | 无 | 管状/分支管状、乳头状、实性腺泡状 | 阳性 | 40 | 100 | N.D. |
| KI231 | G2 | 无 | 无 | 实性腺泡状、囊性、管状/分支管状 | 阳性 | 0 | 100 | N.D. |
| KI236 | G3 | 无 | 无 | 乳头状、实性腺泡状、管状/分支管状 | 阳性 | 20 | 100 | N.D. |
| KI275 | G2 | 无 | 无 | 实性腺泡状、管状/分支管状 | 阳性 | <1 | 100 | N.D. |
| KI279 | G3 | 无 | 无 | 实性腺泡状 | 阳性 | <1 | 100 | N.D. |
| ccRCC_27 | G1 | 无 | 无 | 实性腺泡状 | 阳性 | 20 | 100 | 阴性 |
| ccRCC_35 | G1 | 无 | 无 | 乳头状、实性腺泡状 | 阳性 | 5 | 100 | 阴性 |
| ccRCC_42 | G3 | 无 | 无 | 实性腺泡状 | 阳性 | 10 | 100 | 局灶弱阳性 |
| ccRCC_48 | G2 | 无 | 无 | 实性腺泡状、管状/分支管状、乳头状 | 阳性 | 70 | 100 | 阴性 |
| ccRCC_54 | G2 | 无 | 无 | 管状/分支管状 | 阳性 | 90 | 100 | 阴性 |
| ccRCC_107 | G2 | 无 | 无 | 乳头状、实性腺泡状 | 阳性 | 40 | 100 | 阴性 |
| ccRCC_186 | G2 | 无 | 无 | 实性腺泡状、管状/分支管状 | 阳性 | 95 | 100 | 阴性 |
| ccRCC_193 | G2 | 无 | 无 | 管状/分支管状、实性腺泡状 | 阳性 | 95 | 100 | 阴性 |
所有病例均呈盒状模式。
N.D. 表示未检测;pap,乳头状;Sol Alv,实性腺泡状;Tu/BTu,管状/分支管状。
有助于区分 ELOC 突变型肾细胞癌与 ccRCC 的生物标志物
为寻找潜在的诊断生物标志物,我们对 32 份样本进行了基于 LC-MS 的蛋白质组学分析,这些样本来自 4 例 ELOC 突变型肾细胞癌和 4 例 ccRCC,每例 4 份样本。分析发现,若干蛋白在 ELOC 突变型肾细胞癌中的表达显著高于 ccRCC(图 4A)。其中,SCIN 和 SORT1 在 ELOC 突变型肾细胞癌中显著过表达;转录组学数据也证实了这一发现,显示两者在 ELOC 突变型肾细胞癌中的表达水平显著较高(图 4A、B)。
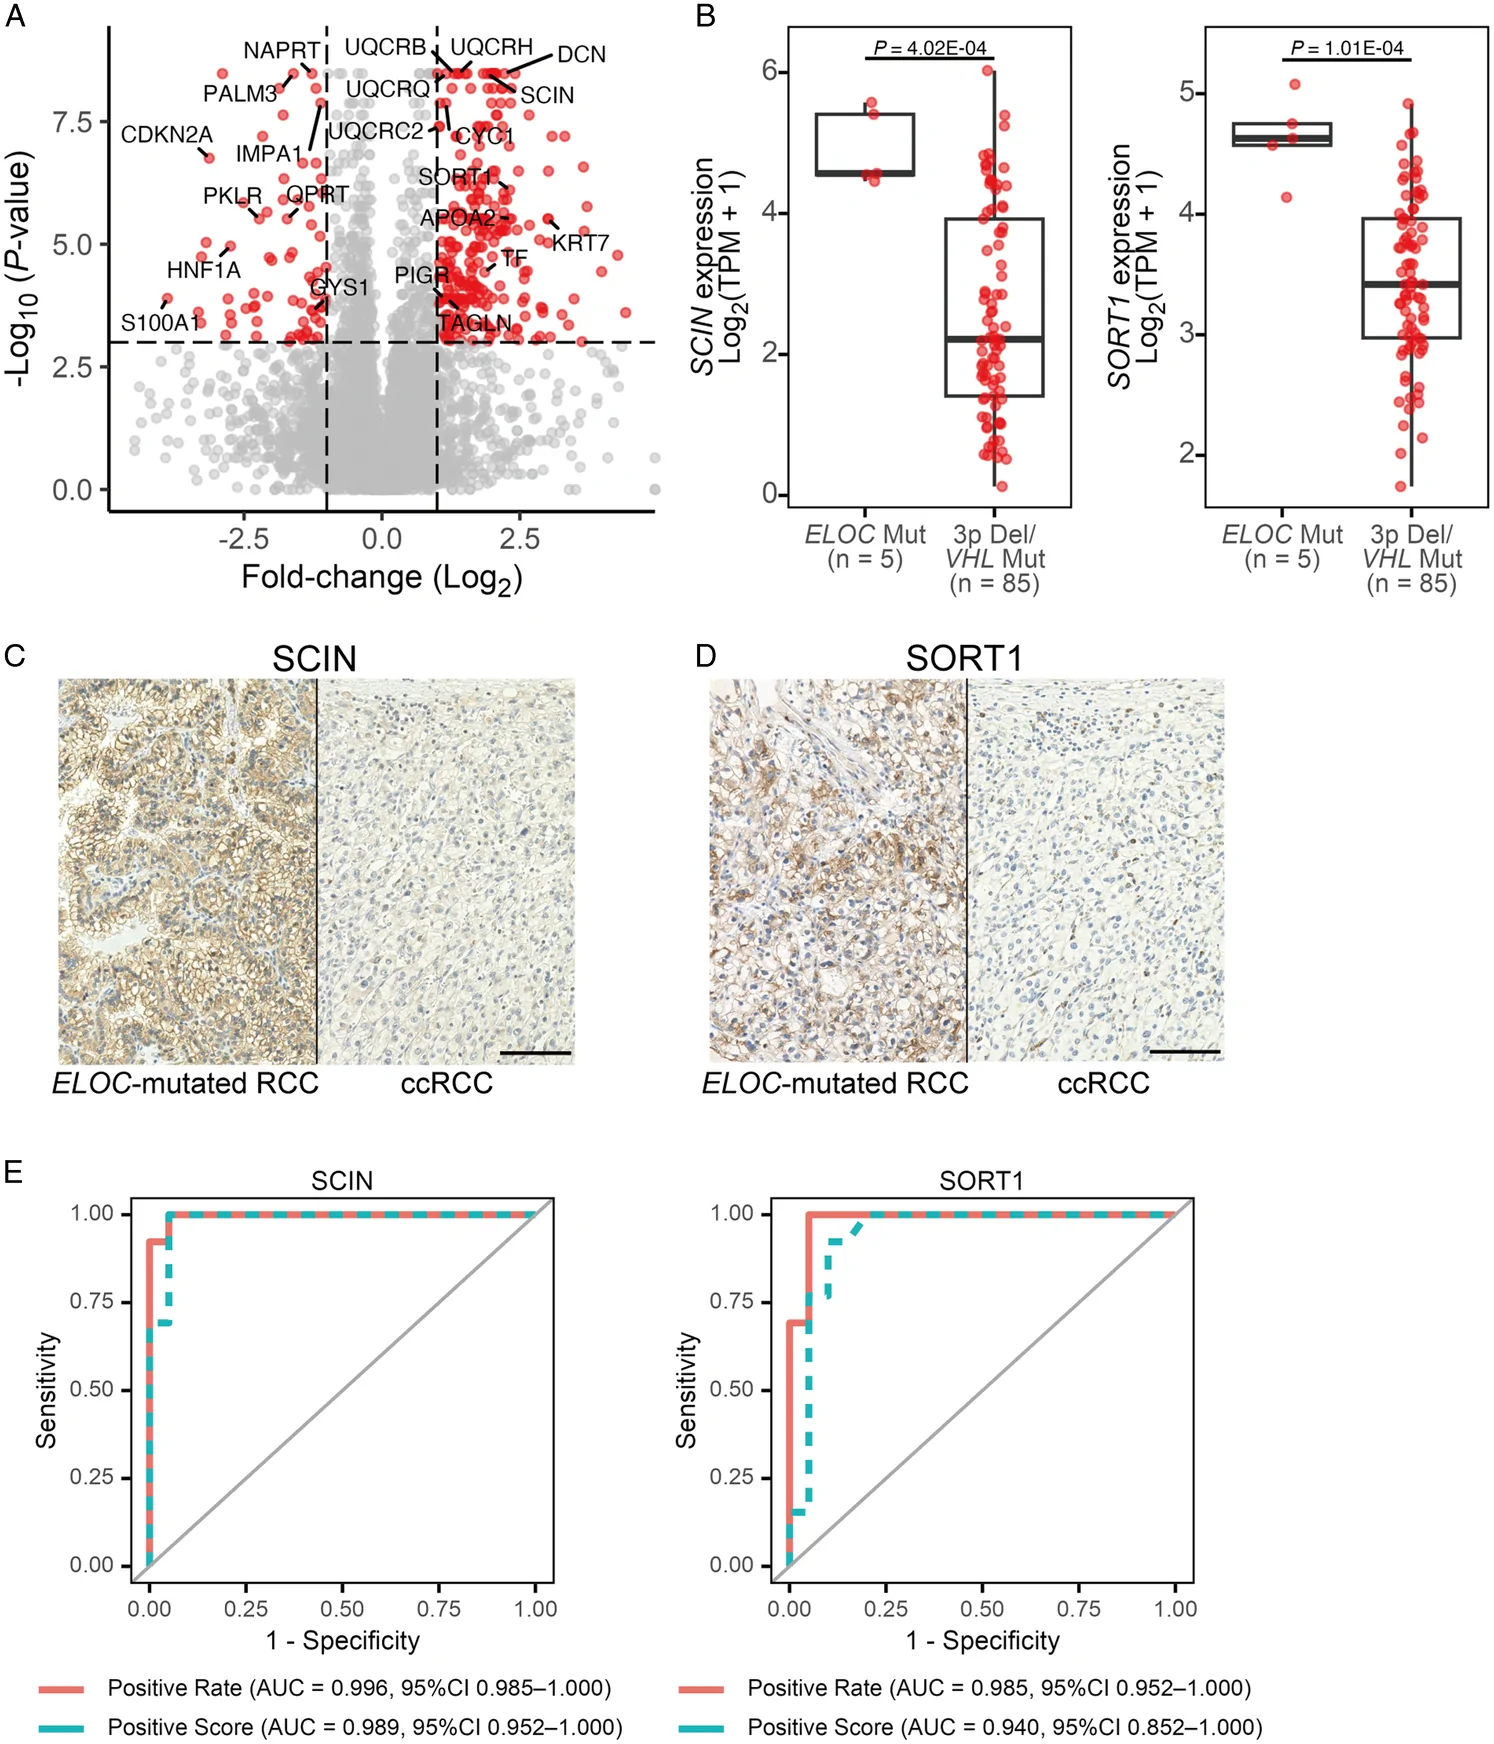
随后,我们通过对 13 例 ELOC 突变型肾细胞癌和 20 例 ccRCC 进行免疫组化,评估 SCIN 和 SORT 1 的诊断价值。两种蛋白均在远端肾小管细胞的细胞膜上呈阳性,而在近端肾小管细胞的细胞膜上呈阴性。它们在 ccRCC 中几乎阴性或仅局灶弱阳性,而在 ELOC 突变型肾细胞癌中呈明确的膜阳性(图 4C、D 和补充数据 3、补充数字内容 5,http://links.lww.com/PAS/C377)。我们对 6 例 ccpRCT 进行了免疫组化,所有病例均呈这两种蛋白阳性。(补充图 3A–C、补充数字内容 6,http://links.lww.com/PAS/C378)。通过阳性率以及结合阳性率与染色强度的综合评分评估诊断效能(补充数据 3、补充数字内容 5,http://links.lww.com/PAS/C377)。在重复分层 5 折交叉验证中,两种蛋白均表现出较高的敏感性和特异性,支持其作为区分 ELOC 突变型肾细胞癌与 ccRCC 的生物标志物的潜在价值(图 4E)。
ELOC 突变型肾细胞癌的代谢系统
尽管已有报道指出 ELOC 突变型肾细胞癌较 ccRCC 更少依赖 mTOR 通路,11但两者分子特征的差异仍不清楚。为此,我们利用这两类肿瘤的蛋白质组学数据进行了 GSEA。GSEA 显示,ccRCC 中 MYC 靶基因的蛋白表达上调(图 5A)。相反,ELOC 突变型肾细胞癌中 MYC 基因表达和 MYC 靶基因表达均下调(图 5B、C)。MYC 基因位于 chr.8q,所有 ELOC 突变病例均在该位点出现杂合性缺失(LOH)。HIF-1α 抑制 MYC,而 HIF-2α 增强其活性,24,25这两种因子在 ELOC 突变型肾细胞癌中均有表达(补充图 4A 和 B、补充数字内容 7,http://links.lww.com/PAS/C379)。E2F5 同样位于 chr.8q,且在多种癌症中促进细胞增殖,26–28其表达相对下调(图 5D、E)。
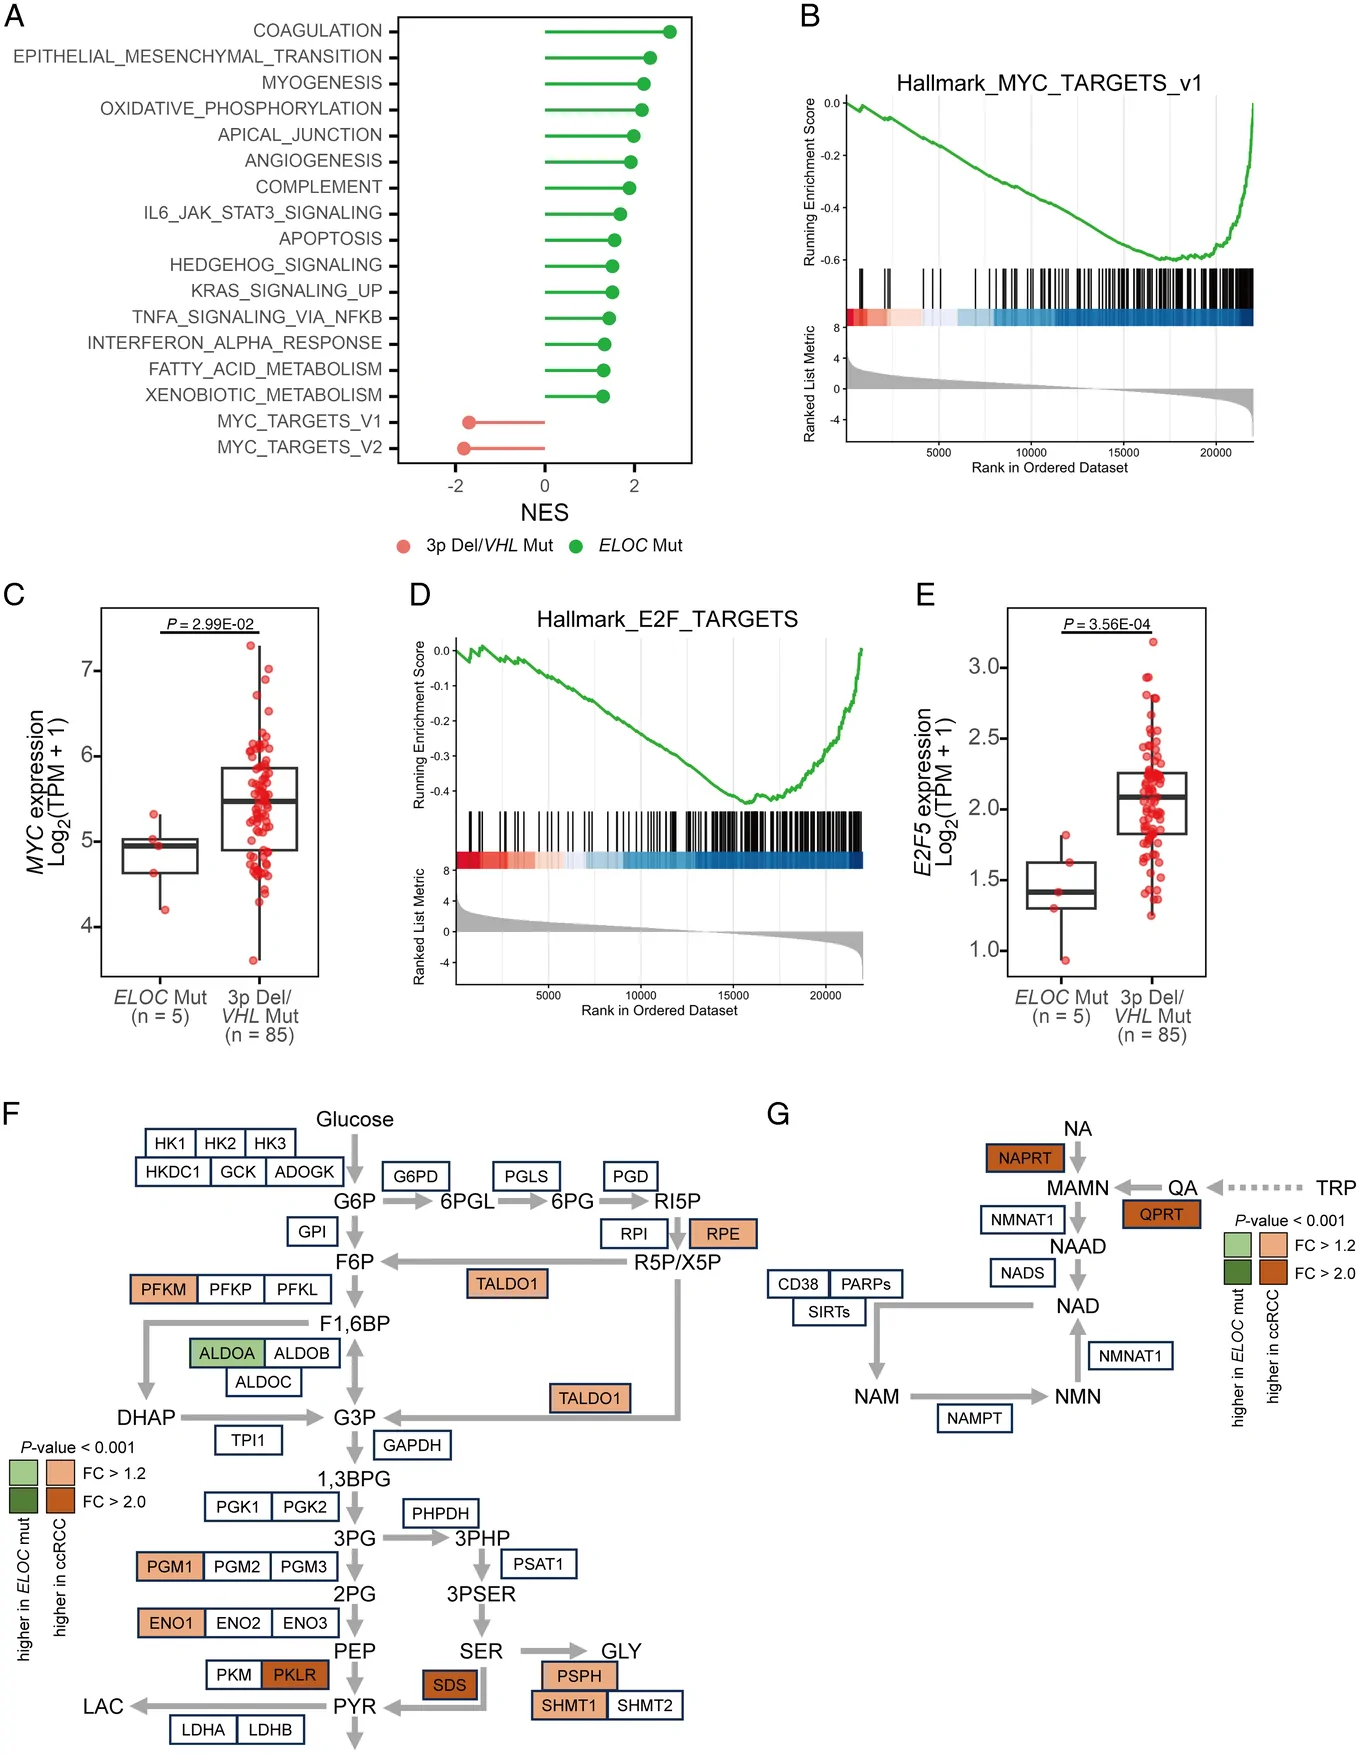
GSEA 进一步显示,ELOC 突变型肾细胞癌中肌生成、血管生成以及包括氧化磷酸化(OXPHOS)和脂肪酸代谢在内的多条代谢通路富集增强(图 5A)。鉴于 ELOC 突变型肾细胞癌和 ccRCC 均具有以 HIF-α 积聚为特征的共同分子背景,3其肿瘤环境可能处于相似的缺氧条件。缺氧时,癌细胞通常转向糖酵解以产生三磷酸腺苷。29然而,对糖酵解酶的分析发现,PGM1、ENO1、PKLR 和 SDS 等多种酶在 ELOC 突变型肾细胞癌中的表达较低(图 5F),提示其更偏向于 OXPHOS 而非糖酵解。
为探究这一代谢转变的基础,我们检查了参与 NAD+ 代谢的通路。糖酵解过程中,NAD+ 被还原为 NADH,而在 OXPHOS 中,NADH 又被氧化为 NAD+。30NAD+ 主要通过 Preiss-Handler 通路、犬尿氨酸通路及补救途径生成。烟酸磷酸核糖转移酶(NAPRT,参与 Preiss-Handler 通路)和喹啉酸磷酸核糖转移酶(QPRT,与犬尿氨酸通路相关)在 ELOC 突变型肾细胞癌中的表达相对较低(图 5G)。31
讨论
本研究对多达 13 例 ELOC 突变型肾细胞癌进行了基因组学、转录组学和蛋白质组学分析,以及免疫组化检测。我们的研究聚焦于这一罕见组织学亚型,其分子病理学尚未得到广泛研究。本研究的发现可能增进我们对这类肿瘤的认识。然而,由于其罕见性,样本量有限,且全部为日本患者;因此,仍需在更大队列中进一步验证。
综合既往研究和我们的研究,日本共报道了 13 例 ELOC 突变型肾细胞癌,提示这一肿瘤类型在日本人群中可能更为常见。该趋势是通过比较病例数有限的不同队列得出的。此外,尽管两个日本队列均显示 ELOC 突变型肾细胞癌的发生频率相对较高,但这些研究并非一定采用相同的测序平台和分析流程。诱变因素暴露或胚系突变可能造成这些发生率差异。然而,仅针对日本肾细胞癌病例进行的突变特征谱分析,未发现任何与 ELOC 突变相关的特定诱变过程,而已有报道表明 SBS1 对非日本 ELOC 突变型癌病例的发生有贡献。此外,未发现与 ELOC 突变相关的胚系突变。由于本研究样本量有限,我们无法确定这一分子亚型在日本人群中更常见的原因。
在非同义突变分析中,所有 ELOC 突变型肾细胞癌病例均未发现 VHL 双等位基因失活,提示这些突变相互排斥。ccRCC 常携带 chr.3p 上 VHL 基因邻近的多个基因突变,如 PBRM1、SETD2 和 BAP1。2然而,与既往研究一致,这些基因突变在 ELOC 突变型肾细胞癌中很少见。3,7,11本研究在 chr.8q 上除 ELOC 突变外,同样未发现反复出现的基因突变。一般认为,仅有 VHL 基因双等位基因失活不足以获得恶性潜能,32ccRCC 的发生还需要多个额外突变。33仍需进一步研究阐明 ELOC 失活在肿瘤发生中的确切作用。值得注意的是,目前未有无义突变或移码突变的报道,但已观察到 ELOC 基因上的 Y79C 等热点突变。这种模式提示,保留 Elongin C 的部分功能对肿瘤发生至关重要。3就 SCNAs 而言,ELOC 突变型肾细胞癌的拷贝数增益频率低于 ccRCC,与既往研究一致,10而两类肿瘤的缺失频率无显著差异。在 ELOC 突变病例中,pT3a 病例的 LOH 水平高于其他 ELOC 突变病例。这提示,在 ELOC 突变型肾细胞癌的肿瘤进展中,LOH 可能比拷贝数增益发挥更关键的作用。
所有病例均观察到平滑肌瘤样间质,与既往报道的 ELOC 突变型肾细胞癌特征一致。7,11尽管 CK7 阳性免疫染色因其与 ccRCC 的差异表达而受到关注,7,11但本队列中有三例几乎阴性,提示仅凭 CK7 阴性结果不能排除 ELOC 突变型肾细胞癌。LC-MS 蛋白质组学分析在 ELOC 突变型肾细胞癌中发现了多个候选标志物;基于抗体质量及可获得性,我们选择 SCIN 和 SORT1 进行免疫组化验证。SCIN 是一种肌动蛋白切断和封端蛋白,可调节细胞皮质肌动蛋白细胞骨架的重塑;34SORT1 是 Vps10p 结构域家族的 I 型跨膜受体,参与细胞内蛋白分选、内吞及配体转运。35这些蛋白的表达失调与癌细胞运动能力及转移潜能有关。36,37免疫组化评估显示,两种蛋白均具有较高的敏感性和特异性,提示其可能在临床实践中成为实用的诊断生物标志物,类似于 CK7 在 ELOC 突变型肾细胞癌与 ccRCC 鉴别诊断中的作用。尽管该模型在内部交叉验证中表现良好,但样本量较小,仍需在更大的独立队列中验证,以确定其可推广性。此外,这些蛋白与 ELOC 突变的关系仍不清楚,需要进一步研究阐明其在 ELOC 突变型肾细胞癌中表达升高或保留的分子机制。由于 ccpRCT 也呈这些蛋白阳性,因此它们可能无助于区分 ELOC 突变型肾细胞癌与 ccpRCT。此外,本研究检测的大多数 ELOC 突变型肾细胞癌病例 GPNMB 阴性,仅一例呈弱阳性。本研究未设置独立的、携带 TSC/MTOR 通路改变的伴纤维瘤样间质肾细胞癌比较组进行评估。23本队列中,具有 TSC/MTOR 通路改变的病例也携带 VHL 改变,因此被判定为 ccRCC;故仍有必要针对这一鉴别诊断情境进一步研究。
我们研究了 ELOC 突变型肾细胞癌独特组织学表现背后的分子机制。我们提出,MYC 靶基因下调以及向 OXPHOS 的代谢转变,有助于形成 ELOC 突变型肾细胞癌所表现出的惰性生长。MYC 靶基因下调可能由包含 MYC 基因的 chr.8q 缺失引起(图 5A-C)。此外,HIF-1α 拮抗 MYC,而 HIF-2α 增强其活性。24,25这两个基因在 ELOC 突变型肾细胞癌中均有表达(补充图 4A、B、补充数字内容 7,http://links.lww.com/PAS/C379),提示 HIF-1α 可能参与 MYC 靶基因的下调。对 OXPHOS 的依赖可能由 NAPRT 和 QPRT 低表达造成的 NAD+ 相对耗竭所诱导。由于 chr.8q 也编码 NAPRT,其缺失可能造成一种矛盾状态:即使在 HIF-1α 积聚的情况下,肿瘤细胞也无法依赖糖酵解。与上述观点一致,具有 chr.8q 缺失的 ccRCC 在组织学上类似于 ELOC 突变型肾细胞癌,7且 chr.8q 增益与多种癌症的不良预后相关。38–40ELOC 突变型肾细胞癌中的间质细胞与肿瘤细胞不同,并不表现为不受控制的增殖,其生长很可能是由多种因素驱动的反应性过程。实际上,我们观察到 ELOC 突变型肾细胞癌中多种细胞因子上调,如 BMP4、PDGFA 和 TGFA(补充图 5A-C、补充数字内容 8,http://links.lww.com/PAS/C380)。考虑到间质与肿瘤细胞的生长速度,肿瘤的惰性行为也可能有助于纤维肌性带的形成。尽管 ELOC 突变型肾细胞癌具有促进平滑肌瘤样间质生长的独特分子特征,但部分 ccRCC 病例仍可能通过反应性间质反应获得类似的组织学特征。
总之,关于 ELOC 突变型肾细胞癌特征的报道较少,我们的研究揭示了其与 ccRCC 相比独特的分子机制。这些发现有助于改进 ELOC 突变型肾细胞癌的诊断策略,尤其是与 ccRCC 的鉴别。然而,由于这一肿瘤类型罕见,本研究的样本量有限。因此,仍需进一步开展更大规模的国际研究来验证这些发现。
- ELOC-mutated RCC is a WHO-recognized entity with only ~40 reported cases; it shares HIF-α accumulation with clear cell RCC (ccRCC) but is characterized by prominent leiomyomatous stromal growth and a more indolent course.
- Material: the authors previously identified 5 ELOC-mutated RCCs among 102 ccRCCs by whole-genome sequencing; here up to 13 Japanese cases (including 8 previously reported) underwent proteomic and immunohistochemical analysis to find markers separating ELOC-mutated RCC from ccRCC.
- Diagnostic relevance: cytokeratin 7, scinderin (SCIN) and sortilin 1 (SORT1) were significantly overexpressed in ELOC-mutated RCC; SCIN and SORT1 emerge as novel potential supportive biomarkers. ELOC mutation was mutually exclusive with biallelic VHL inactivation, and PBRM1, SETD2 and BAP1 mutations were rare.
- Metabolism and epidemiology: greater reliance on oxidative phosphorylation and less on glycolysis than ccRCC, possibly linked to relative NAD+ depletion from low NAPRT and QPRT; frequency varied geographically, higher in Japan. Table 1 and Figures 1–5 included.
Scope: PMC open-access full text (CC BY-NC-ND 4.0) — abstract, introduction, materials and methods, results and discussion, Table 1 and Figures 1–5 with captions. Supplementary material, acknowledgments, conflict statements and references are not included.
Abstract
ELOC-mutated renal cell carcinoma (RCC) is a rare tumor with only ∼40 cases reported to date; it shares a molecular background with clear cell RCC (ccRCC) in terms of hypoxia-inducible factor-alpha (HIF-α) protein accumulation. ELOC-mutated RCC is characterized by prominent leiomyomatous stromal growth and a more indolent clinical course compared with ccRCC. In our previous study, whole-genome sequencing of 102 ccRCC cases identified 5 cases of ELOC-mutated RCC. In the present study, we conducted proteomic and immunohistochemical analyses on up to 13 Japanese ELOC-mutated RCCs, including 8 previously reported cases, to elucidate its distinct molecular mechanisms and identify biomarkers that may be useful in distinguishing ELOC-mutated RCC from ccRCC. Proteomic profiling revealed that molecules, including cytokeratin 7, scinderin (SCIN), and sortilin 1 (SORT1), were significantly overexpressed in ELOC-mutated RCC compared with ccRCC. Notably, SCIN and SORT1 emerged as novel potential diagnostic biomarkers for distinguishing ELOC-mutated RCC from ccRCC. The analysis further suggested that ELOC-mutated RCC relies more on oxidative phosphorylation and less on glycolysis than ccRCC. This metabolic shift may be linked to the relative depletion of NAD+ due to the low expression of NAPRT and QPRT. In addition, we observed geographic variation in the disease frequency among different cohorts, with a higher frequency in Japan. Our findings provide novel insights into the pathogenesis of ELOC-mutated RCC and highlight SCIN and SORT1 as potential supportive biomarkers.
INTRODUCTION
ELOC-mutated renal cell carcinoma (RCC) has been classified as a distinct entity by the World Health Organization (WHO),1 with only ∼40 reported cases, including our previous report, to date.2–10 This rare molecular subtype is characterized by biallelic inactivation of the ELOC, leading to the accumulation of HIF-α proteins and the consequent development of tumors.3 This mechanism is similar to that of clear cell RCC (ccRCC). Tumors with ELOC mutations generally lack biallelic VHL inactivation and have a low frequency of mutations in PBRM1, SETD2, and BAP1, which are common in ccRCC.11 Furthermore, ELOC-mutated cases frequently lack specific somatic copy number alterations (SCNAs), such as the gain of chr.5q and loss of chr.3p, chr.9, and chr.14, which are typical in ccRCC.11 ELOC-mutated RCC is associated with a better clinical prognosis than that of ccRCC, generally producing smaller histologically low-grade tumors, according to the WHO/International Society of Urologic Pathologists grading system.7,11 ELOC-mutated RCC is distinguished by the separation of its nodules by a prominent smooth muscle stroma, known as a fibromuscular band, and focal papillary architecture. Immunophenotypically, ELOC-mutated RCC is characterized by patchy to diffusely labeled cytokeratin 7 (CK7) and box-shaped diffuse positive staining for carbonic anhydrase 9 (CAⅨ).7,11 Although gene and protein expression studies are limited, the mammalian target of rapamycin (mTOR) pathway was reported to be downregulated in ELOC-mutated RCC.11 However, the molecular mechanisms underlying the unique histologic features of this tumor remain largely unclear, and no useful diagnostic biomarkers have been reported.
In our previous study, we identified 5 ELOC-mutated RCC cases among 102 ccRCC cases.8 In addition, 8 Japanese cases of ELOC-mutated RCC have been reported previously.3 Here, we represent the genomic, transcriptomic, proteomic, and immunohistochemical characteristics of ELOC-mutated RCC and compare them with those of ccRCC.
MATERIALS AND METHODS
Patients and Tissue Specimens
We adhered to the ethical standards of both the institutional and national research committees, as well as the 1964 Declaration of Helsinki and its subsequent amendments. This study received approval from the Research Ethics Committee of the National Cancer Centre (approval number: G2008-03). Written informed consent was obtained from all patients for the publication of their data (including 3 or more indirect identifiers, such as exact age, sex, medical center attended, or rare diagnoses), as well as for the collection of samples, their analysis, and the deposition of sequencing data.
This study involved 102 patients diagnosed with ccRCC at the National Cancer Centre Hospital (Tokyo, Japan). Details regarding the participant’s sex, number, and age can be found in Supplementary Data 1, Supplemental Digital Content 1, http://links.lww.com/PAS/C373 and the previous study.8 After surgical resection, all specimens were immediately stored in liquid nitrogen, and germline control specimens were obtained from adjacent normal kidney tissues. Tumors harboring biallelic ELOC inactivation and exhibiting concordant morphologic features without biallelic VHL inactivation were classified as ELOC-mutated RCC.
DNA Extraction and Whole-Genome Sequencing
Genomic DNA was extracted from both tumors and matched normal tissues. Libraries with an insert size of 350 bp were prepared from 1 μg sonicated DNA using a TruSeq DNA PCR-free kit (Illumina, San Diego, CA). Libraries were sequenced on a NovaSeq. 6000 instrument (Illumina) using paired-end reads of 150 bp. The sequencing reads were aligned to the human reference genome (GRCh37) using BWA-MEM version 0.7.812 for both tumor and nontumor samples. To process the data, we used SAMtools version 1.9 and an in-house program to remove potential PCR duplicates and generate pileup files. The criteria for base selection included a mapping quality score of ≥20 and a base quality score of ≥10.
Genomic Analyses
We performed mutation calling using our in-house program to minimize false positives, as previously described.13,14 FACETS version 0.6.015 was used for copy number analysis with the following parameters: “snp. nbhd =500,” “preProcSample’s val =50,” and “procSample’s Cval =300.” The definitions of amplification, gain, homozygous deletions, loss of heterozygosity, and whole-genome doubled samples are provided in a prior study.8
Mutational Signature Analysis
Mutational signature analysis was performed using FitMS (https://signal.mutationalsignatures.com/analyse2) with the GEL-kidney-SBS signal-mutational signatures from the organ-specific signature.16
RNA Extraction and RNA Sequencing
RNA sequencing was performed using a HiSeq. 2500 instrument (Illumina). Libraries were prepared using the NEBNext Ultra II Directional RNA Library Prep Kit (New England BioLabs, Ipswich, MA). Paired-end reads were aligned using the Bowtie version 0.12.7,17 applying the “–v 3” and “-a” options to permit mismatches of up to 3 and to detect all multiple hits, respectively. Transcripts per million (TPM) values were calculated after selecting the best hits with the correct distances and orientations.
Immunohistochemistry
Immunohistochemistry (IHC) for CK7, CAIX, scinderin (SCIN), and sortilin 1 (SORT1) was performed in 13 ELOC-mutated RCC cases. In addition, GPNMB IHC was performed in 8 cases. Deparaffinized sections were autoclaved in a target retrieval solution (pH 9.0) for antigen retrieval. The primary antibodies used were as follows: anti-CAIX (clone EP161, 1:400, rabbit monoclonal; Epitomic, catalog number not applicable), anti-CK7 (clone OV-TL 12/30, 1:500, mouse monoclonal; Agilent Technologies, Santa Clara, CA, M7018), anti-SCIN (1:100, rabbit polyclonal; Proteintech, 11579-1-AP), anti-SORT1 (1:1000, rabbit polyclonal; Abcam, ab16640), and anti-GPNMB (Human Osteoactivin/GPNMB antibody, 1:400; R&D Systems). Antibodies were diluted in Antibody Diluent (Agilent Technologies). The IHC analysis was conducted automatically using AutostainerLink 48 (Agilent Technologies).
Immunohistochemical staining was independently evaluated by at least 2 expert pathologists. A positive score was calculated by multiplying the proportion of positive tumor cells (positive rate) by the staining intensity. Staining intensity was graded as 1 for weak and 3 for strong; for example, a tumor with strong staining in 80% of cells received a score of 3×0.8. When staining intensity varied within the sample (eg, weak to strong), the average intensity value was used for calculation. To obtain an internally validated estimate of discrimination while minimizing small-sample instability, we used stratified 5-fold cross-validation repeated 50 times. In each split, folds preserved the class ratio. A fixed random seed was set for reproducibility. Receiver operating characteristic (ROC) curves were generated using the roc function in the pROC package in R.
Proteomic Analysis
Liquid chromatography-mass spectrometry (LC-MS) analysis was performed on 4 samples from each patient (a total of 32 samples; sample IDs: ELOC-mutated RCC samples KI111, KI236, KI275, and KI279, and ccRCC samples KI235, KI237, KI257, and KI263). Peptides from biotinylated protein fractions were prepared for LC-MS. Peptide samples were extracted from formalin-fixed, paraffin-embedded (FFPE) tissue sections. Tissue sections of 3 μm were cut from the FFPE tissue blocks using a microtome and deparaffinated with xylene, ethanol, and distilled water. The deparaffinized samples were suspended in EasyPep lysis buffer (Thermo Fisher Scientific) and homogenized with a handheld homogenizer. After incubation at 95°C for 30 minutes, sonication was performed using a Bioruptor with 30-second on/off cycles at “High” power for a total of 30 minutes. Acetone was precipitated following the EasyPep protocol. The resulting pellet was resuspended in 1.4 M guanidine and subjected to carbamidomethylation. Peptide digestion was performed using Lys-C and trypsin after resuspension. After centrifugation, the supernatant was collected, and the protein concentration was determined using the bicinchoninic acid assay. The peptides (500 ng) were purified using EVOTIP (EVOSEP). Purified peptides were analyzed using an LC-MS system equipped with an Evosep One LC system (Evosep) coupled to an astral mass spectrometer (Thermo Fisher Scientific). The mobile phases consisted of 0.1% formic acid in water and 0.1% formic acid in 99.9% acetonitrile. Data-independent acquisition was conducted using a 2Th isolation window, covering a mass range of 380 to 1000 m/z. Separation was performed using an 8 cm Evosep column with 60 samples/day. The data were analyzed using Dia-NN version 1.8, using the human UniProt database for protein identification. The false discovery rate threshold for peptide identification was set at 1%.
Gene Set Enrichment Analysis
Gene set enrichment analysis (GSEA) was conducted using the h.all.v2023.2.Hs.symbols.gmt gene set with GSEA version 4.3.2. Significant pathways were identified on peptide ion intensities or TPM. The number of permutations was set to 1000, along with the “gene_set” type. A cutoff q-value of 0.15 was established for determining significance.
RESULTS
Frequency of ELOC-Mutated RCC and Mutation Spots at the ELOC Gene
In addition to our previous genomic study,8 ELOC mutations have been reported in various large-scale genome studies,2,3,7,18 likely in the analysis of a random selection of ccRCC cases. We compared the frequencies of these ELOC mutations across large-scale studies (Fig. 1A). ELOC-mutated RCC was detected in 3.80% (ELOC-mutated RCC: 13 cases, ccRCC: 342 cases) of the Japanese cohort, whereas other cohorts showed a frequency of <1%. This discrepancy in the incidence of malignant tumors may be attributable to variations in germline mutations or exposure to exogenous mutagens.19,20 However, we did not find any association in ELOC-mutated RCC with any specific mutational signatures when compared with ccRCC or any high-frequency germline mutations (Supplementary Fig. 1A, Supplemental Digital Content 2, http://links.lww.com/PAS/C374).
Thirty-nine ELOC mutations were recorded in 37 ELOC-mutated RCC cases worldwide.2–7,9,10 Elongin C, encoded by the ELOC gene, comprises 112 amino acids and contains 2 regions that interact with the VHL protein.21 All but one ELOC-mutated RCC case exhibited alterations within these 2 regions. Amino acid substitutions occurred more frequently at residues 71 to 80, particularly Y79C and Y79S (Fig. 1B). In Japanese cases, 7 patients harbored a missense mutation at codon 236, leading to the Y79C substitution frequently observed in ELOC-mutated RCC (Fig. 1B). Notably, no nonsense mutations were identified in the present study or in previous reports.
Genomic Aberrations in ELOC-Mutated RCC
We compared the nonsynonymous mutations and the statuses of chr.3p and chr.8q in ELOC-mutated RCC with those in ccRCC (Fig. 1C). Eight cases were excluded due to the inability to assess SCNAs, leaving 94 cases for genomic analysis (Supplementary Data 1, Supplemental Digital Content 1, http://links.lww.com/PAS/C373). Among these, 5 cases harbored an ELOC mutation and loss of chr.8q21.11, the locus containing the ELOC gene (Fig. 1C). None of these cases showed biallelic VHL inactivation, and 2 exhibited loss of chr.3p, where the VHL gene is located—a common alteration in ccRCC (Fig. 1C, D). We further analyzed mutations in genes frequently altered in ccRCC, including PBRM1, SETD2, and BAP1, using data from Sato et al (Fig. 1D).2 No PBRM1 nor SETD2 mutations were observed, and only 2 ELOC-mutated RCC cases carried BAP1 mutations; however, the difference was not statistically significant (Fig. 1D). While ccRCC typically harbors frequent mutations in several chr.3p genes, including VHL, PBRM1, SETD2, and BAP1, ELOC-mutated RCCs did not exhibit recurrent mutations on chr.8, excluding ELOC (data not shown). Because some tumors with mTOR pathway-related mutations are histologically similar to ELOC-mutated RCC,22,23 we also examined these genes. Seven of 94 cases carried mutations in the mTOR pathway (TSC1 mutation, n=1; TSC2 mutation, n=1; MTOR mutation, n=5). VHL mutations were present in 6 of these, and all showed loss of chr.3p; these tumors were classified as ccRCC.
Somatic Copy Number Aberration of ELOC-Mutated RCC
We examined the SCNAs across ELOC-mutated RCC genomes (Fig. 2A). Deletion of the region from chr.8p23.3 to chr.8q24.23, which harbors ELOC, MYC, and E2F5, occurred more frequently in ELOC-mutated RCC than in ccRCC. Conversely, deletions in the chr.3p26.3-chr.3p14.1 region and gains in the chr.5q23.3-chr.5q35.3 were detected less often in ELOC-mutated RCC, unlike in ccRCC (Fig. 2A). Deletions of chr.9 and chr.14, typically seen in progressive ccRCC,8 were detected in one case and none of the ELOC-mutated cases, respectively. The total number of SCNAs and deletions across the ELOC-mutated RCC genome was not significantly different from that in ccRCC (Fig. 2B). In contrast, ELOC-mutated RCC showed fewer copy number gains than did ccRCCs (P=2.89E-03). Among the cases, the one diagnosed with pT3a had the highest number of deletions but showed no copy number gains.
Clinicopathologic Features of ELOC-Mutated RCC
We analyzed the clinicopathologic data of patients with RCC harboring ELOC mutations. The Japanese patients were aged 42 to 77 years, with a mean age of 62 years (Supplementary Data 2, Supplemental Digital Content 3, http://links.lww.com/PAS/C375). In the Japanese cases, we observed 11 cases of pT1 and 2 cases of pT3a, most of which were nonprogressive (Supplementary Data 2, Supplemental Digital Content 3, http://links.lww.com/PAS/C375). However, one patient with pT3a experienced postoperative recurrence of lung metastasis.
Our 5 ELOC-mutated RCC cases displayed a multinodular appearance, creating a nodular gross configuration (Fig. 3A and Supplementary Fig. 2A–D, Supplemental Digital Content 4, http://links.lww.com/PAS/C376). Histologically, all these cases had prominent leiomyomatous stroma, so-called fibromuscular bands (Fig. 3B, C). The tumor cytoplasm was voluminous and clear, with various architectural patterns (Fig. 3D-F). The tumors featured a mix of solid alveolar, tubular, branching tubular, and cystic architectures, which were very similar to those of ccRCC (Table 1). In contrast, 2 patients presented with a pure papillary architecture, an occurrence that is rare in ccRCC. Immunohistochemical studies have shown that ELOC-mutated RCC exhibits varying levels of CK7 expression across cases, with only 4 cases being negative for CK7.6,7,9 In the Japanese cases, 11 cases were positive for CK7, while 3 were almost negative (Fig. 3G and Table 1). All ELOC-mutated RCC cases demonstrated strong and diffuse positivity for CAⅨ, a target gene of HIF, with expression surrounding the entire cell membrane instead of the typical cup-like pattern in clear cell papillary renal cell tumor (ccpRCT) (Fig. 3H and Table 1). We additionally evaluated GPNMB immunohistochemistry in 8 ELOC-mutated RCC cases. Seven cases were completely negative, whereas 1 case showed weak positivity (Table 1).
| Sample ID | WHO/ISUP grade | Necrosis | Sarcomatous component | Architectural patterns | Leiomyomatous stroma | CK7 (% of positive cells) | CAⅨ* (% of positive cells) | GPNMB |
|---|---|---|---|---|---|---|---|---|
| KI111 | G2 | no | no | Tu/BTU, pap, Sol Alv | Positive | 40 | 100 | N.D. |
| KI231 | G2 | no | no | Sol Alv, Cystic, Tu/BTU | Positive | 0 | 100 | N.D. |
| KI236 | G3 | no | no | Pap, Sol Alv, Tu/BTU | Positive | 20 | 100 | N.D. |
| KI275 | G2 | no | no | Sol Alv, Tu/BTU | Positive | <1 | 100 | N.D. |
| KI279 | G3 | no | no | Sol Alv | Positive | <1 | 100 | N.D. |
| ccRCC_27 | G1 | no | no | Sol Alv | Positive | 20 | 100 | Negative |
| ccRCC_35 | G1 | no | no | Pap, Sol Alv | Positive | 5 | 100 | Negative |
| ccRCC_42 | G3 | no | no | Sol Alv | Positive | 10 | 100 | focally weakly positive |
| ccRCC_48 | G2 | no | no | Sol Alv, Tu/BTU, pap | Positive | 70 | 100 | Negative |
| ccRCC_54 | G2 | no | no | Tu/BTU | Positive | 90 | 100 | Negative |
| ccRCC_107 | G2 | no | no | Pap, Sol Alv | Positive | 40 | 100 | Negative |
| ccRCC_186 | G2 | no | no | Sol Alv, Tu/BTU | Positive | 95 | 100 | Negative |
| ccRCC_193 | G2 | no | no | Tu/BTU, Sol Alv | Positive | 95 | 100 | Negative |
All cases showed box-shape pattern.
N.D. indicates not done; pap, papillary; Sol Alv, solid alveolar; Tu/BTu, tubular/branching tubular.
Biomarkers Useful for Distinguishing ELOC-Mutated RCC From ccRCC
To identify potential diagnostic biomarkers, we performed LC-MS-based proteomic analysis on 32 samples derived from 4 ELOC-mutated RCC cases and 4 ccRCC cases, 4 samples per case. This analysis revealed several proteins with significantly higher expression in ELOC-mutated RCC than in ccRCC (Fig. 4A). Among them, SCIN and SORT1 were significantly overexpressed in ELOC-mutated RCC, a finding that was corroborated by transcriptomic data, which also showed significantly higher expression levels in ELOC-mutated RCC (Fig. 4A, B).
We next evaluated the diagnostic utility of SCIN and SORT 1 through IHC in 13 ELOC-mutated RCC cases and 20 ccRCC cases. Both proteins were positive in the cell membrane of distal tubule cells, but not in those of proximal tubule cells. They were almost negative or only focally weakly positive in ccRCC, whereas ELOC-mutated RCC demonstrated distinct membranous positivity (Fig. 4C, D, and Supplementary Data 3, Supplemental Digital Content 5, http://links.lww.com/PAS/C377). We performed IHC for 6 ccpRCT cases, and all cases were positive for these proteins. (Supplementary Fig. 3A–C, Supplemental Digital Content 6, http://links.lww.com/PAS/C378). Diagnostic performance was assessed using both the positivity rate and a composite score combining positivity rate and staining intensity (Supplementary Data 3, Supplemental Digital Content 5, http://links.lww.com/PAS/C377). Both proteins showed high sensitivity and specificity under repeated stratified 5-fold cross-validation, supporting their potential utility as biomarkers for distinguishing ELOC-mutated RCC from ccRCC (Fig. 4E).
Metabolic System in ELOC-Mutated RCC
Although ELOC-mutated RCC is reportedly less dependent on the mTOR pathway than ccRCC,11 the differences in their molecular features remain poorly understood. To address this, we performed GSEA using proteomic data from both tumor types. GSEA revealed that protein expression of MYC target genes was upregulated in ccRCC (Fig. 5A). In contrast, both MYC gene expression and MYC target gene expression were downregulated in ELOC-mutated RCC (Fig. 5B, C). The MYC genes are located on chr.8q, and all ELOC-mutated cases showed loss of heterozygosity (LOH) at this locus. While HIF-1α acts to suppress MYC and HIF-2α enhances its activity,24,25 both factors were expressed in ELOC-mutated RCC (Supplementary Fig. 4A and B, Supplemental Digital Content 7, http://links.lww.com/PAS/C379). E2F5, which is also located on chr.8q and promotes cell proliferation in various cancer types,26–28 was relatively downregulated (Fig. 5D, E).
GSEA further indicated enrichment of myogenesis, angiogenesis, and several metabolic pathways, including oxidative phosphorylation (OXPHOS) and fatty acid metabolism, were enhanced in ELOC-mutated RCC (Fig. 5A). Given that both ELOC-mutated RCC and ccRCC share a common molecular background characterized by HIF-α accumulation,3 their tumor environments are likely subject to similar hypoxic conditions. Under hypoxia, cancer cells generally shift toward glycolysis for adenosine triphosphate production.29 However, analysis of glycolytic enzymes revealed that several, including PGM1, ENO1, PKLR, and SDS, were expressed at lower levels in ELOC-mutated RCC (Fig. 5F), suggesting a preference for OXPHOS over glycolysis.
To investigate the basis of this metabolic shift, we examined pathways involved in NAD+ metabolism. During glycolysis, NAD+ is reduced to NADH, whereas in OXPHOS, NADH is oxidized back to NAD+.30 NAD+ is mainly produced through the Preiss-Handler, kynurenine, and salvage pathways. Expressions of nicotinate phosphoribosyltransferase (NAPRT) (involved in the Preiss-Handler pathway) and quinolinate phosphoribosyltransferase (QPRT) (associated with the kynurenine pathway) were relatively low in ELOC-mutated RCC (Fig. 5G).31
DISCUSSION
In this study, we performed genomic, transcriptomic, and proteomic analyses, along with IHC, in up to 13 ELOC-mutated RCC cases. Our research highlighted this rare histologic subtype, which has not been extensively studied in terms of its molecular pathology. The findings from this study may enhance our understanding of this type of tumor. However, due to its rarity, the sample size was limited and comprised exclusively of Japanese patients; therefore, further validation with larger cohorts will be necessary.
Considering previous studies in conjunction with our research, a total of 13 ELOC-mutated RCC cases have been reported in Japan, suggesting that this tumor type may be more prevalent among Japanese individuals. This trend was determined by comparing different cohorts with a limited number of cases. In addition, these studies were not necessarily performed using identical sequencing platforms and analytical pipelines, although both Japanese cohorts showed a relatively higher frequency of ELOC-mutated RCC. Exposure to mutagenic factors or germline mutations may contribute to these differing incidence rates. However, mutational signature analysis restricted to Japanese RCC cases did not identify any specific mutagenic process associated with the ELOC mutation, whereas SBS1 has been reported to contribute to non-Japanese ELOC-mutated carcinoma cases. Furthermore, no germline mutations were found to correlate with the ELOC mutation. Due to the limited sample size in our study, we could not determine the causes underlying the more frequent occurrence of this molecular subtype in the Japanese population.
Among the nonsynonymous mutations, biallelic VHL inactivation was not found in all cases of ELOC-mutated RCC, indicating that these are mutually exclusive mutations. ccRCC often harbors several mutations adjacent to the VHL gene, such as PBRM1, SETD2, and BAP1 on chr.3p.2 However, these gene mutations were rarely observed in ELOC-mutated RCC, as in previous studies.3,7,11 No recurrent gene mutations, excluding the ELOC mutation on chr.8q, were also found in this study. Biallelic inactivation of the VHL gene alone is considered insufficient for acquiring malignant potential,32 and several additional mutations are necessary to develop ccRCC.33 Further investigations are needed to elucidate the precise role of ELOC inactivation in tumorigenesis. Notably, no nonsense or frameshift mutations have been reported, while hot spot mutations, such as Y79C, on the ELOC gene have been observed. This pattern suggests that retention of some elongin C functions is essential for tumor development.3 Regarding SCNAs, ELOC-mutated RCC exhibited a lower frequency of copy number gains than that of ccRCC, consistent with the previous study,10 whereas the frequency of deletions did not differ significantly between the two tumor types. Among the ELOC-mutated cases, the case with pT3a showed a higher level of LOH than did the other ELOC-mutated cases. This suggested that LOH may play a more critical role in tumor progression in ELOC-mutated RCC than copy number gain.
Leiomyomatous stroma was observed in all cases, consistent with the previously reported characteristics of ELOC-mutated RCC.7,11 Although CK7-positive immunostaining has attracted attention for its differential expression in ccRCC,7,11 Three cases in our cohort were almost negative, suggesting that CK7-negative findings alone cannot rule out ELOC-mutated RCC. LC-MS proteomics highlighted several candidates in ELOC-mutated RCC; SCIN and SORT1 were selected for IHC validation based on antibody quality and availability. SCIN is an actin-severing and -capping protein that regulates remodeling of the cortical actin cytoskeleton,34 and SORT1, a type I transmembrane receptor of the Vps10p-domain family, functions in intracellular protein sorting, endocytosis, and ligand trafficking.35 Dysregulation of the expression of these proteins has been implicated in cancer cell motility and metastatic potential.36,37 Immunohistochemical evaluation demonstrated that both proteins showed high sensitivity and specificity, suggesting that they may serve as useful diagnostic biomarkers in clinical practice, similar to CK7 in differential diagnosis between ELOC-mutated RCC and ccRCC. Although the model performed well in internal cross-validation, the small sample size necessitates validation in larger, independent cohorts to establish generalizability. Moreover, the relationship between these proteins and ELOC mutation remains unclear, and additional studies are needed to elucidate the molecular mechanisms underlying their elevated or preserved expression in ELOC-mutated RCC. Because ccpRCT was positive for these proteins, they are unlikely to be informative for distinguishing ELOC-mutated RCC from ccpRCT. In addition, GPNMB was negative in most ELOC-mutated RCC cases examined in this study, with only one case showing weak positivity. In this study, we did not evaluate a separate comparator group of RCC with fibromatous stroma harboring TSC/MTOR pathway alterations.23 In our cohort, cases with TSC/MTOR pathway alterations also harbored VHL alterations and were therefore interpreted as ccRCC; thus, further investigation of this differential diagnostic setting is warranted.
We investigated the molecular mechanisms underlying the distinguished histology in ELOC-mutated RCC. We propose that the downregulation of MYC target genes and a metabolic shift toward OXPHOS contribute to the indolent growth observed in ELOC-mutated RCC. Downregulation of MYC target genes was likely caused by the loss of chr.8q, which contains the MYC gene (Fig. 5A-C). Additionally, HIF-1α antagonizes MYC, while HIF-2α enhances its activity.24,25 Both genes were expressed in ELOC-mutated RCC (Supplementary Fig. 4A, B, Supplemental Digital Content 7, http://links.lww.com/PAS/C379), suggesting that HIF-1α could contribute to the downregulation of MYC target genes. The reliance on OXPHOS was likely induced by relative NAD+ depletion due to the low expression of NAPRT and QPRT. Chr.8q loss may create a contradictory situation where tumor cells cannot rely on glycolysis, even under HIF-1α accumulation, as it also encodes NAPRT. Consistent with these notions, ccRCC with chr.8q loss exhibits histology similar to that of ELOC-mutated RCC,7 and chr.8q gains have been associated with poor prognosis across various cancer types.38–40 The stromal cells in ELOC-mutated RCC do not exhibit uncontrolled proliferation, unlike the tumor cells, and their growth is likely a reactive process driven by various factors. Indeed, we observed upregulation of several cytokines, such as BMP4, PDGFA, and TGFA, in ELOC-mutated RCC (Supplementary Fig. 5A-C, Supplemental Digital Content 8, http://links.lww.com/PAS/C380). Given the growth speeds of the stroma and tumor cells, the indolent tumor behavior may also contribute to the formation of the fibromuscular bands. Although ELOC-mutated RCC possesses distinct molecular features that promote leiomyomatous stromal growth, it remains possible that some ccRCC cases may acquire similar histologic features through reactive stromal responses.
In conclusion, the features of ELOC-mutated RCC have been rarely described, and our studies highlighted the distinctive molecular mechanism compared with that of ccRCC. These findings could contribute to the development of improved diagnostic strategies for ELOC-mutated RCC, particularly in distinction from ccRCC. However, the rarity of this tumor type resulted in a limited sample size in our study. Therefore, further larger-scale, international studies are required to validate these findings.